Cosmic Ray contribution to the WMAP polarization data on the Cosmic Microwave Background
Abstract
We have updated our analysis of the 9-year WMAP data using the collection of polarization maps looking for the presence of additional evidence for a finite ’cosmic ray foreground’ for the CMB. We have given special attention to high Galactic latitudes, where the recent BICEP2 findings were reported. The method of examining the correlation with the observed gamma ray flux proposed in our earlier papers and applied to the polarization data shows that the foreground related to cosmic rays is still observed even at high Galactic altitudes and conclusions about gravitational waves are not yet secure. Theory has it that there is important information about inflationary gravitational waves in the fine structure of the CMB polarization properties (polarization vector and angle) and it is necessary to examine further the conclusions that can be gained from studies of the CMB maps, in view of the disturbing foreground effects.
I Introduction
The ’structure’ of the Cosmic Microwave Background (CMB) is a fertile area for the testing of cosmological models, but the elimination of foreground effects due to processes in the Galaxy, particularly in the Halo, is not a trivial problem. The processes relate mainly to photons due to Cosmic Ray (CR) electrons and radiation from dust. The frequency used in the CMB maps (Bennett et.al. (2013) hereafter referred to as the WMAP) is that for which the foreground contributions are a minimum. It is interesting to note (Banday & Wolfendale, 1991) that at this frequency the sum of the components gives almost the 2.7 K temperature spectral shape.
In our recent publication ((Wibig & Wolfendale, 2015)), which confirmed results reported by us about ten years ago ((Wibig & Wolfendale, 2005)) with the one-year only WMAP data, Tegmark, de Oliviera-Costa & Hamilton (2004), we have shown that there is strong evidence that the procedure of eliminating the known and identified foreground contributions is not perfect. We have found some contributions from large Galactic structures which have not been taken into account yet.
The method we used was based on the correlation of the explicit cosmic ray origin effects measured by the EGRET satellite Esposito et al. (1999), i.e. the gamma ray flux, and the CMB temperature characteristics.
In the present work we are still using the EGRET Gamma Ray measurement but comparing the high energy photon flux with the polarization characteristics of the microwave radiation registered by the WMAP experiment.
Some remarks are necessary about the sources of the data. Although the CMB ’temperature’ maps used earlier were cleaned of foreground, to the best degree available, by the authors, those for polarization – as published – have not been. There is thus an inevitable foreground contribution. Turning to the gamma ray map, the EGRET measurements have been superseded by the Fermi-LAT data. However, a comparison of the two sky maps shows that they are very similar. The features in the maps which are relevant to the present analysis relate largely to the distribution of CR-target material, which is in the form of atomic and (lumpy) molecular hydrogen. It is the interaction of CR with the gas which produces the measured gamma rays. Our hypothesis regarding the CMB foreground is that some, at least, will be due to CR-heated dust and electron synchrotron radiation, both of which are only indirectly connected with the gas. Thus, and in order to preserve continuity with previous work, we continue to adopt the EGRET maps.
II The analysis
The sky map of CMB temperature fluctuations has been analysed in many different ways. The most important and significant is the search for the cosmological structures observed against the background of random noise. On the other hand the observed sky map at any frequency of the electromagnetic spectrum has obvious structures related to the Galactic ’shadow’ or to Galactic sources. These structures make a foreground on the CMB sky and we need to identify them and then extract them. For the temperature maps the process of the foreground reduction gives the set of ”cleaned” maps, which contains to a great extent the real ’cosmological’ CMB structures, but the process of cleaning is not obvious and there could be different strategies leading to slightly different results. This is a source of systematics in the further analysis of the CMB data and in turn the source of uncertainties in the resulting cosmological parameters. For the polarization case the vector character of the data makes the cleaning procedure much more complicated. In addition, the small degree of polarization makes the flux under consideration much harder to determine experimentally. All this is probably the reason that the set of polarization data of WMAP available to the public do not contain the ’cleaned maps’ with any known cleaning procedure.
The analysis of the WMAP polarization data shows a strong enhancement of the intensity of radiation close to the Galactic disk as would be expected for all foregrounds.
The same structure is seen for the gamma ray flux in the EGRET map. We supposed that the EGRET map (with point sources excluded) is a view of the possible foreground on CMB maps caused by the cosmic rays and Galactic matter structures. The correlation between the EGRET gamma ray flux and the temperature fluctuations measured in this direction by WMAP was used in our previous papers (Wibig & Wolfendale, 2005, 2015). We have followed this way of constructing the sky map of the respective correlation coefficients for the polarization parameters of WMAP.
The polarization is measured as a set of Stoke’s parameters ( and ). For each point (pixel) in the sky the number of independent observations is also given. The statistics (exposure) of different parts of the sky is not uniform and there are patterns relevant to the detector structures and measurement technique as mentioned already in Jarosik et al. (2007).This is a factor which contributes slightly to the reported average values of polarization. The polarization intensity, , even if there is a completely random polarized light registered, is defined as the square root of , and has non-zero average values. The square of fluctuates as the sum of the squares of two randomly distributed quantities. Each value of and is the average value of a number of measurements, so it should in principle obey a normal, Gaussian, distributions with width proportional to the square root of the measurement number. All Stokes parameter values (, and ) measured by WMAP depend on how long each fragment of the sky was observed.
This is very important when one is looking for the small structures of polarized CMB. In the present paper, however, we concentrate on big and very big structures, as were the ones we found in the temperature fluctuation analysis.
To diminish the effect of random fluctuations we used the technique of the ’running average’ thereby smoothing the small scale effects. The smoothing of the WMAP polarization parameter maps was done by calculating the value of each parameter for each point on the high resolution WMAP, averaging all the points within a cone of radius 10∘ weighted with the exponential weight: .
Such smoothed and maps were used to derive the polarization intensity and the polarization angle . We define the angle with respect to the N-S direction: value 0 represents the N-S direction and 90∘ is for the W-E direction.
The procedure of running average was used to smooth the WMAP data for all frequency bands. Further analysis has been performed for each band separately, but also we add the fluxes of Q, V and W bands to produce a less fluctuating picture. The results and conclusions do not change using the sum, so below we present some details only for this case.
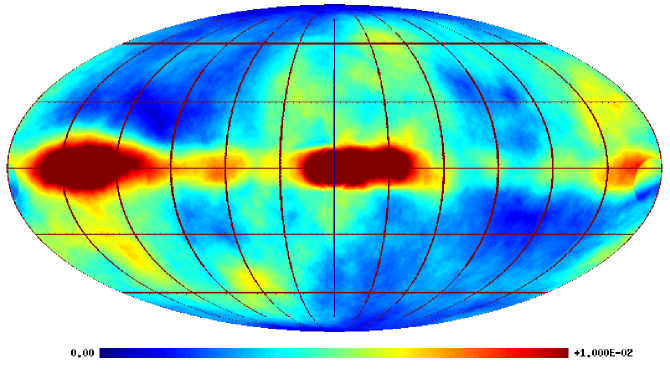
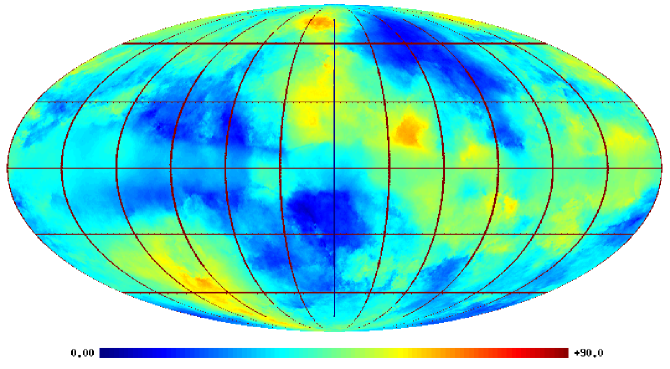
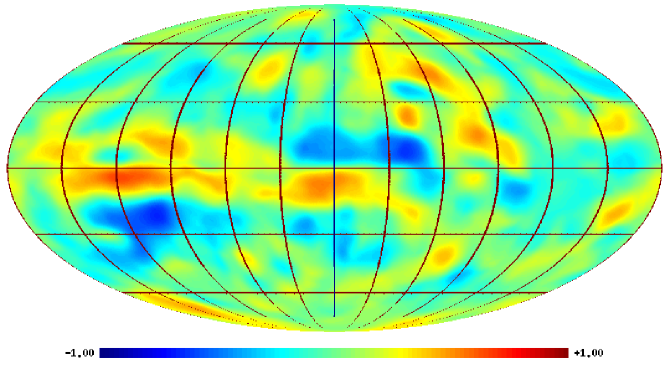
The input maps are given in Fig.1.
The polarization map shows the emission from the Galactic disk, which is not excluded from the data sets. There is also visible the Equatorial Plane which could be partially an effect of the statistics discussed above. The angle map does not contain these well defined and understood structures, but in general the angle map could be misleading. At every point the value of is obtained whatever the values of and are, however small is the total polarization flux itself. Due to the uncertainties of the measurement for small values of and the polarization direction is highly undetermined (small fluctuations of around the value of 0 from a positive to negative value change abruptly the direction from N-S to W-E). The maps for the angle should therefore be used with great care.
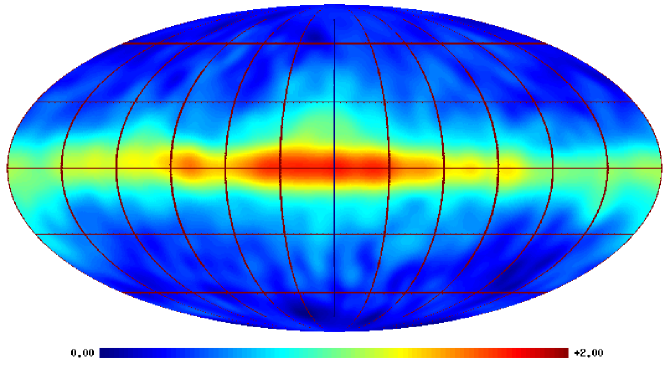
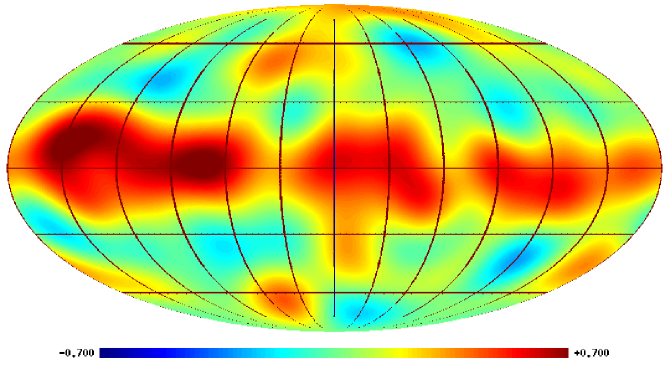
Maps for both these quantities were then compared with the EGRET intensity map shown in Fig. 2. For each pixel the correlation with gamma ray intensity was calculated as a linear correlation coefficient for all point in the neighbourhood of the pixel defined as the directions in the sky within the cone of radius of 10∘.
| (1) |
where is the EGRET gamma ray flux and - the polarization or the polarization angle towards the point . Parenthesis in Eq.(1) means averaging over all points in the cone centred at the point ; and are respectively the squared variances of the EGRET gamma ray flux and the WMAP polarization signals – within this cone.
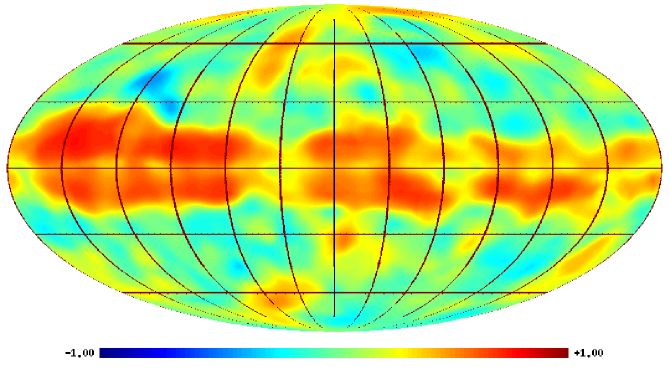
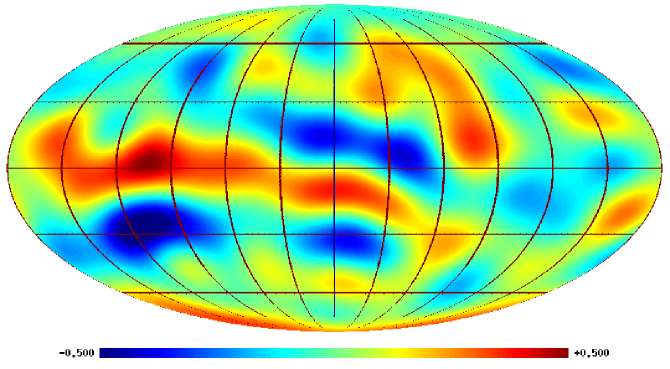
The correlation coefficient maps are shown in Fig. 3 for the polarization intensity (a) and the polarization angle (b). The first shows obvious correlation with the disk emission from the EGRET map. The disk component is limited to small values. Above it seems to vanish. The map in Fig 3(b) shows similar patterns limited again to .
In the sky far from the Galactic Plane there are some pattern of quite large sizes seen in Figs. 1 and 3. They could come from random fluctuations (’cosmological variance’) or they could be related to some processes determined by big structures in the Universe, most likely in the vicinity of our Galaxy, or some Galactic structures, or even quite local Galactic structures.
To study this we have to look first at the size spectra of the patterns.
II.1 Spherical harmonics
To examine this structures we can use the spherical harmonic analysis. It is known that the distribution of the signals on a sphere can be expanded as a linear combination of spherical harmonics:
| (2) |
The effect of filtering (by the smoothing procedure applied to the raw data) was studied in Wibig & Wolfendale (2015). No additional power resulting from the ’running average’ we used is observed in the spectrum for values of below the respective averaging size.


Spectra of the polarization and polarization angles measured by WMAP are shown in Fig. 4. We compared them with the randomized sky map spectra obtained by shuffling pixels on the original WMAP maps. Such maps do not contain any information about the Galaxy and the position with respect to any real structures, so they can be used as an estimation of the background for our foreground analysis. As we can see in Fig. 4, for greater than the effect of the running average suppressed possible existing forms in the CMB sky. The curious lowering of the angle spectrum even below randomly shuffled pixel sky spectra for is not understood: it is a specific feature of the map in Fig. 1b.


The correlation coefficients maps suggest the existence of non-random low patterns, too. The power spectra of maps in Fig. 3 are shown in Fig. 5. We can see that the effect of the structures exists in the correlation maps. The unusual behaviour of the angle spectra around has disappeared. Polarization and polarization angle correlation coefficient spectra look quite similar, only for of a few the large Galactic disk related spectral power of the correlations for polarization value is slightly higher than for angle.
To see if the effect is only that related to the well visible Galactic disk, or is extended over high altitudes, we examined the spectra calculated for the parts of the sky with different cuts on Galactic altitude . A search for more complicated big patterns is almost impossible, mainly because of the uncertainties of the measured values of the polarization light. Instead of plotting the whole spectra, we sum up the values shown in Figs.4 and 5 in the low interval: from 3 to 10. We defined the respective ’spectral power density’ as
| (3) |
where is the solid angle of the analyzed sky covering the region of .
III Results for high altitudes


As we can see for the polarization value (Fig. 6a) there are structures existing to Galactic altitudes of about 60∘ and these structures are not random patterns. In the case of the polarization angle (Fig. 6b) there is an enhancement of the power very close to the Galactic disk, and then the spectral power for low goes close to the random sky spectral power, but is still about 20% higher. We would like to examine if this is by chance, or is a real effect.
This question can be answered, if we check if these structures are related to the Galactic structures observed in the gamma ray intensity map of the EGRET experiment. The respective sums of power in the low parts of the linear correlation coefficient for polarization and polarization angle are shown in Figs. 6 and 7.


Comparing the power contained in the correlation coefficient spectra three features are seen:
-
-
the low spectral power is observed both in the polarization intensity and in the polarization angle,
-
-
in both cases the dependence is very similar
-
-
the existence of the non-random structures is observed in the whole sky, up to .
This could stand for evidence that the polarization intensity and the angle are related to the gamma ray flux rather than to the Galactic structure itself.
We plot in Fig. 8 the sum of 10 of the first harmonic spectral components for the linear correlation coefficient of the EGRET flux and the polarization value and the polarization angle. The maps consists of a number of blobs of size which are distributed all over the high regions.
IV Conclusions
We have examined the CMB WMAPs in some detail from the standpoint of searching for Galactic foreground effects. They appear to be there, at all Galactic latitudes and not just near the Galactic Plane.This conclusion follows from a comparison of the polarization maps with those of Cosmic Gamma Rays. The presence of a significant foreground in the latitude range to degrees, is such as to render the interpretation of the BICEP-02 polarization data (Ade et al., 2014) in terms of inflationary gravitational waves untenable at the present time (see, e.g., Adam et al. (2014)). However, the fact that the foreground does diminish to some extent with increasing latitude, , suggests that a more sophisticated analysis might be trustworthy.
acknowledgements
The Kohn Foundation is thanked for supporting this work.
References
- Adam et al. (2014) R. Adam et al. [Planck Collaboration], arXiv:1409.5738 [astro-ph.CO].
- Ade et al. (2014) Ade, P. A. R. et al.,,2014, PRL, 112, 241101.
- Banday & Wolfendale (1991) Banday, A. J., Wolfendale, A. W., 1991, MNRAS, 252, 452.
- Bennett et.al. (2013) Bennett, C. L., et.al., 2013, ApJS., 208, 20B.
-
Esposito et al. (1999)
Esposito, J. A. et al. 1999 ApJS 123 203;
http://heasarc.gsfc.nasa.gov/docs/journal/cgro7.html. - Gorski et.al. (2005) Gorski, K. M., Hivon, E., Banday, A. J., Wandelt, B. D., Hansen, F. K., Reinecke, M., & Bartlemann, M. 2005, ApJ, 622, 759.
- Jarosik et al. (2007) Jarosik, N., et al., 2007, ApJS, 170 263.
- Tegmark, de Oliviera-Costa & Hamilton (2004) Tegmark, M., de Oliviera-Costa, A., Hamilton, A., 2003, Phys. ReV., D, 68 ,123523.
- Wibig & Wolfendale (2005) Wibig T. and Wolfendale, A. W., 2005, MNRAS, 360, 236.
- Wibig & Wolfendale (2015) Wibig T. and Wolfendale, A. W., 2015, MNRAS, 448, 1030.