Madison, WI 53706, USA 44institutetext: Sydney Institute for Astronomy, School of Physics, University of Sydney, NSW 2006, Australia 55institutetext: Space Telescope Science Institute, 3700 San Martin Drive, Baltimore, MD 21218, USA
An HST/COS legacy survey of intervening Si iii absorption in the extended gaseous halos of low-redshift galaxies ††thanks: Based on observations obtained with the NASA/ESA Hubble Space Telescope, which is operated by the Space Telescope Science Institute (STScI) for the Association of Universities for Research in Astronomy, Inc., under NASA contract NAS5D26555.
Abstract
Aims. Doubly ionized silicon (Si iii) is a powerful tracer of diffuse ionized gas inside and outside of galaxies. It can be observed in the local Universe in ultraviolet (UV) absorption against bright extragalactic background sources. We here present an extensive study of intervening Si iii-selected absorbers and study the properties of the warm circumgalactic medium (CGM) around low-redshift () galaxies.
Methods. We analyzed the UV absorption spectra of 303 extragalactic background sources, as obtained with the Cosmic Origins Spectrograph (COS) on-board the Hubble Space Telescope (HST). We developed a geometrical model for the absorption-cross section of the CGM around the local galaxy population and compared the observed Si iii absorption statistics with predictions provided by the model. We also compared redshifts and positions of the absorbers with those of galaxies using archival galaxy-survey data to investigate the relation between intervening Si iii absorbers and the CGM.
Results. Along a total redshift path of , we identify intervening Si iii systems that all show associated absorption from other low and high ions (e.g., H i, Si ii, Si iv, C ii, C iv). We derive a bias-corrected number density of Si iii for absorbers with column densities log Si iii, which is times the number density of strong Mg ii systems at . This number density matches the expected cross section of a Si iii absorbing CGM around the local galaxy population with a mean covering fraction of . For the majority ( percent) of the absorbers, we identify possible host galaxies within km s-1 of the absorbers and derive impact parameters kpc, demonstrating that the spatial distributions of Si iii absorbers and galaxies are highly correlated.
Conclusions. Our study indicates that the majority of Si iii-selected absorbers in our sample trace the CGM of nearby galaxies within their virial radii at a typical covering fraction of percent. We estimate that diffuse gas in the CGM around galaxies, as traced by Si iii, contains substantially more (more than twice as much) baryonic mass than their neutral interstellar medium.
1 Introduction
Galaxies at low and high redshift are surrounded by massive gaseous halos. These halos are believed to be built up and fed by large-scale gas circulation processes, such as accretion from the intergalactic medium (IGM), galactic winds, and outflows powered by star formation and active galactic nuclei, as well as minor and major mergers that result from the on-going hierarchical formation and evolution of galaxies. Such gaseous material in extended galaxy halos is nowadays often referred to as the circumgalactic medium (CGM). We here define the CGM as diffuse neutral and ionized gas that is located within the virial radius of a galaxy, but outside of its (main) stellar body.
Observational and theoretical studies imply that the CGM is a key component in the ongoing process of galaxy formation and evolution. Because the gas-consumption timescales of late-type galaxies are short compared to their lifetimes, they must gain gaseous material from outside (e.g, from the IGM and/or from merger processes) through the CGM to sustain their ongoing star formation. The manner in which the gas makes its way from the IGM/CGM to the disks of late-type spirals is not well understood, however. The classical picture of accretion (e.g., Rees & Ostriker 1977; White & Rees 1978; Birnboim & Dekel 2003) and the ”hot-” and ”cold-mode” scenarios (Kere et al. 2005) most likely are oversimplified, because the underlying physics that describe the large-scale flows of multiphase gas from the outer to the inner regions of a dynamically evolving galaxy is highly complicated (e.g, Mo & Miralda-Escude 1996; Maller & Bullock 2004). Most likely, only state-of-the art hydrodynamical simulations that cover the necessary physics and that have the necessary spatial resolution to potentially provide realistic measures for the amount of gas that is reaching the disk of late-type galaxies and for the timescales that it requires to do so (e.g., van de Voort et al. 2011).
Observations that aim at studying the properties of the CGM are thus extremely important to improve our understanding of gas-accretion processes and provide constraints for numerical models. What observations can provide is a characterization of the distribution of the different gas phases in the CGM, the total mass that it contains (under reasonable assumptions), and the connection between the properties of the CGM and the properties of their host galaxies (e.g., morphology, luminosity, star-formation rate, etc.). The gas densities in the CGM are low, however, so that emission measurements of circumgalactic gas (e.g., in the X-ray regime) typically are limited to the very inner halo regions of nearby galaxies using current instruments (Anderson & Bregman 2011; Dai et al. 2012; Bogdán et al. 2013). Fortunately, absorption-line measurements that use background active galactic nuclei (AGNs; throughout the following we use the abbreviation QSO to refer to the various classes of AGNs collectively) can access physical tracers at the relevant densities with extremely high sensitivity. For such absorption-line measurements the ultraviolet (UV) range is particularly important, as it contains a large number of diagnostic transitions from low, intermediate and high ions of heavy elements and the Lyman series of neutral hydrogen. Consequently, UV absorption-line observations with past and present space-based UV spectrographs such as the Far-Ultraviolet Spectroscopic Explorer (FUSE), the Space Telescope Imaging Spectrograph (STIS) and the Cosmic Origins Spectrograph (COS; the latter two instruments installed on the Hubble Space Telescope; HST) provide a wealth of information on the physical and chemical properties of the different gas phases in the CGM of the Milky Way and other galaxies (e.g., Wakker et al. 1999, 2001; Sembach et al. 2003; Richter et al. 2001, 2009, 2011; Tripp et al. 2003; Fox et al. 2005, 2010; Collins et al. 2009; Wakker & Savage 2009; Shull et al. 2009; Prochaska et al. 2011; Tumlinson et al. 2011; Lehner et al. 2013; Keeney et al. 2013; Werk et al. 2013; Stocke et al. 2014; Liang & Chen 2014).
In two previous papers, we have studied the amount and distribution of neutral gas (the so-called high-velocity clouds) in the halos of low redshift galaxies via optical absorption spectroscopy and their contribution to the neutral-gas accretion rate in the local Universe (Richter et al. 2011; Richter 2012). We here continue our long-term strategy to study the circumgalactic medium in the local Universe with an absorption-line survey that aims at characterizing the extent and mass of diffuse ionized gas around low-redshift galaxies using archival UV absorption-line data from HST/COS.
This paper is organized as follows. A short discussion on the importance of doubly ionized silicon as a sensitive tracer for circumgalactic gas is presented in Sect. 2. In Sect. 3 we describe the HST/COS data acquisition, the COS data reduction, the spectral analysis method, and the galaxy data origin. In Sect. 4 we discuss the observed absorber properties, such as their incident rate, their redshift distribution, the distribution of equivalent widths and column densities. In Sect. 5 we model the expected absorption cross section of circumgalactic gas using the local galaxy luminosity function. Sect. 6 deals with the observed absorber-galaxy connection in our data sample. The ionization conditions and the cosmological mass density of the Si iii absorbers are considered in Sect. 7. We discuss our results in Sect. 8 and provide a summary of our study in Sect. 9.
2 On the importance of Si iii as a tracer of circumgalactic gas
A particularly powerful transition in the UV to detect ionized interstellar, circumgalactic, and intergalactic gas in a wide range of physical conditions is that of doubly ionized silicon (Si iii) at Å (hereafter referred to as Si iii ). This is because of the very high oscillator strength of Si iii of (Morton 2003) and the relatively large cosmic abundance of silicon (log (Si/H; Asplund et al. 2009). Doubly ionized silicon is a Mg-like ion with a closed-subshell valence-electron structure. The ionization-energy boundaries of the Si iii ion are and eV (Morton 2003). As a result, detectable Si iii arises from both diffuse photoionized as well as collisionally ionized gas at moderate temperatures ( K; see Shull et al. 2009).
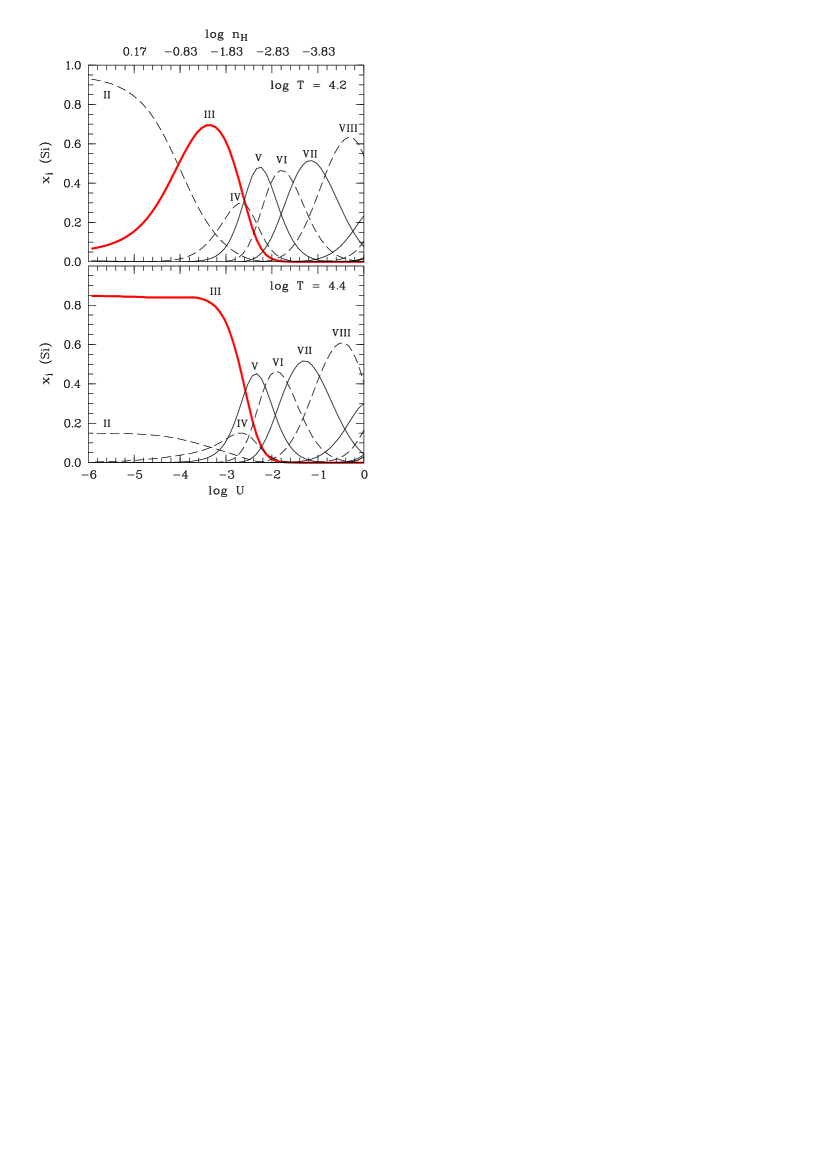
To demonstrate the diagnostic power of the Si iii transition for the study of the CGM we show in Fig. 1 the expected fractional abundance of the Si ions Si iiSi viii in gas at that is exposed to the local UV background. For the UV background we use a modified version of the model by Haardt & Madau (2012), in which we re-scale the photoionization rate to a value of log to compensate for the apparent discrepancies between the Haardt & Madau model and recent observational results (see Kollmeier et al. 2014; Wakker et al. 2015; Shull et al. 2015). The calculations (Fechner 2016, in prep.) are based on ionization models performed with the ionization code Cloudy (v13.03; Ferland et al. 2013). As can be seen, doubly ionized Si represents the dominant observable ionization state of Si at densities and temperatures (log to , K) that are typical for multiphase circumgalactic gas structures that are embedded in hot coronal gas (see Cen 2013).
In terms of quasar absorption-line systems, Si iii absorption in the low-redshift Universe is expected to be detectable (if not blended by other spectral features) in basically all damped Lyman absorbers (DLAs; log (H i), sub-damped Lyman absorbers (sub-DLAs; log (H i), Lyman-limit systems (LLS; log (H i), because these are metal-enriched, multiphase absorbers with high gas columns. The majority of Si iii-selected absorbers (throughout the following referred to simply as Si iii absorbers), however, are expected to arise in ionized metal systems at lower H i column densities (log (H i), where the minimum H i column density to detect Si iii with HST/COS in solar-metallicity gas at moderate gas densities ( cm-3) can be as low as log (H i (see Sect. 7.1).
Low ions with lines in the observable UV, such as O i, C ii, and Si ii, are only present in mostly neutral or slightly ionized gas (i.e., at high (H i)), while high ions such as C iv and O vi predominantly trace highly-ionized gas at gas densities that are typically below cm-3. A Si iii-selected absorption-line survey, such as presented in this paper, therefore is expected to be particularly sensitive to detect metal-enriched gas in the inner and outer halos of galaxies and to characterize its spatial distribution and physical properties.
3 Observations, data handling, and analysis method
3.1 COS spectra selection and data reduction
For our study we make use of archival HST/COS data that were retrieved from the HST Science Archive at the Canadian Astronomy Data Centre (CADC). Because we aim at studying intervening Si iii absorption in the IGM at together with corresponding H i Ly absorption we are primarily interested in the wavelength range between and Å. This range is covered by the COS G130M grating which operates between Å, providing a spectral resolution of (corresponding to an instrumental FWHM of km s-1, while the native pixel size is km s-1; Green et al. 2012; Debes et al. 2016). Using the CADC web interface we searched for all publicly available COS data from all types of extragalactic point sources such as the various types of AGN and galaxies that were observed with the COS G130M grating. By the end of February 2014 we found (and downloaded) G130M data sets for 552 extragalactic sightlines. Whenever G160M data (covering the range Å including the important C iv doublet at Å) were available for these sightlines, we retrieved them as well.
For the further data reduction we used the raw COS spectra of the individual science exposures. The individual exposures were processed with the CALCOS pipeline (v2.17.3) to produce the standard COS x1d fits files. For the coaddition of the individual spectra we then used a custom-written code that aligns the individual exposures in wavelength space in a fully automated fashion. The code calculates for each exposure a pixel/wavelength calibration based on the line flanks (for spectra with S/N) or line centers (for spectra with S/N) of various interstellar anchor lines that are distributed over the wavelength range of the G130M and G160M spectral ranges. The heliocentric velocity positions of the anchor lines were calibrated for each sightline using H i 21cm data from the Leiden-Argentine-Bonn (LAB) survey (Kalberla et al. 2005). The individual spectra then were uniformly rebinned and coadded pixel-by-pixel (using the count rate in each pixel), where pixels with known artifacts were flagged accordingly. Errors were calculated in the coadded spectra by weighting by inverse variance. In this way, we obtained for each sightline a calibrated, co-added G130M spectrum (and G160M spectrum, if available). For each sightline we checked the quality of the data reduction by a visual inspection of the final spectrum.
As it turns out, many of the data sets have very low signal-to-noise ratios (S/N) and/or sample background sources with very low redshifts. These spectra are thus not suited to investigating intervening metal absorption at . We selected only those spectral data that have a minimum S/N per resolution element of four in the wavelength range between and Å and for which the redshift of the background source is . This selection reduces the total sample to lines of sight (LOS). In Tables A.1-A.4 in the Appendix we present a complete list of all 303 QSO sightlines in our COS sample including QSO names and coordinates.
3.2 Redshift-path coverage, absorber identification, and spectral analysis
The next step in our analysis was to characterize the available redshift path to detect intervening Si iii+H i Ly absorption at in each spectrum. We generally exclude the velocity range between km s-1 where absorption by local disk gas and by intermediate- and high-velocity clouds in the Milky Way halo is found (see, e.g, Wakker & van Woerden 1998; Richter 2006; Shull et al. 2009; Lehner et al. 2012; Putman, Peek & Joung 2012; Herenz et al. 2013). To sort out regions that may be associated with the background AGN we further ignore the spectral range that lies within km s-1 of . Finally, we identify and flag along each sightline those spectral regions that are heavily blended by other intervening absorbers (in particular by higher-redshift LLS and DLAs). As a result, we obtain a total absorption redshift path for each sightline that is available to identify intervening Si iii+H i Ly absorption (see Tables A.1-A.4, last column).
For the determination of the Si iii number density (Sect. 4.2) we further need to consider the detection limit for Si iii absorption along each sightline, which depends on the S/N in the relevant part of the spectrum where intervening Si iii absorption is expected to occur. The minimum column density, , that can be detected at significance from an unresolved absorption line with a laboratory wavelength and an oscillator strength in a spectrum with a resolving power and a given S/N per resolution element is given by (e.g., Richter et al. 2001; Tumlinson et al. 2002):
| (1) |
For the only available Si iii transition in the UV range we have Å and (Morton 2003), so that for a S/N of per resolution element the formal detection limit for is log (Si iii. More than half of the considered COS spectra have a S/N per resolution element of , so that for these LOS log (Si iii.
For the identification of intervening Si iii absorbers at in our COS data sample we used the following strategy. In a first step, we let an automated line-finder algorithm identify absorption features whose wavelengths would correspond to combined Si iii/H i Ly absorption and created a candidate list of possible Si iii absorbers. In a second step, we inspected each individual spectrum by eye and created a different (independent) candidate list. For each of the candidates from both lists velocity plots (including all relevant low and high ions in the available wavelength range) were generated and the absorber candidates were analyzed in detail. To meet our selection criteria of a bona fide Si iii absorber, we require the significant detection of Si iii and H i together with the detection of at least one additional metal ion (C iv, C ii, Si iv, Si ii) to avoid mis-indentifications and false detections due to absorption features of other intervening absorbers at higher redshifts. Si iii traces both diffuse ionized gas (as also traced by high ions such as C iv and Si iv) as well as denser, partly neutral gas (as also traced by singly-ionized species such as Si ii and Mg ii; see Fig. 1), so that the simultaneous detection of Si iii with either one of the above listed low and high ions is expected.
We also identified a number of absorber candidates, that possibly show absorption in H i and Si iii but lack absorption from any other ion, so that a unambiguous identification cannot be given.
For each intervening Si iii absorber we checked for associated absorption in other metal ions (in particular Si ii, Si iv, C ii, C iv, N v, Fe ii). We then measured equivalent widths (and their limits) for the strongest lines of the three different ionization states of silicon (Si ii , Si iii , Si iv ), C ii , and C iv , as well as for H i Ly by a direct pixel integration. Because of the limited spectral resolution and S/N of the COS data and the resulting lack of information about the intrinsic component structure in the absorbers we refrain from performing line fits for the analysis of the metal absorption in the systems. We instead use the apparent-optical depth method (AOD method; Savage & Sembach 1991) to derive column densities for unsaturated absorption in the above-listed lines and lower limits for lines that appear to be saturated. We assume that saturation becomes important for lines that have an absorption depth at the resolution of COS. Only for a small number of absorbers do we use Voigt-profile fitting to estimate the total H i column density from the damping wings of the H i Ly absorption. The AOD method and Voigt-profile fitting are implemented in the custom-written span software package that is based on ESO-MIDAS and its data-reduction libraries (Fontana & Ballester 1995). Laboratory wavelengths and oscillator strengths for all ions were adopted from the compilation by Morton (2003).
3.3 Galaxy data
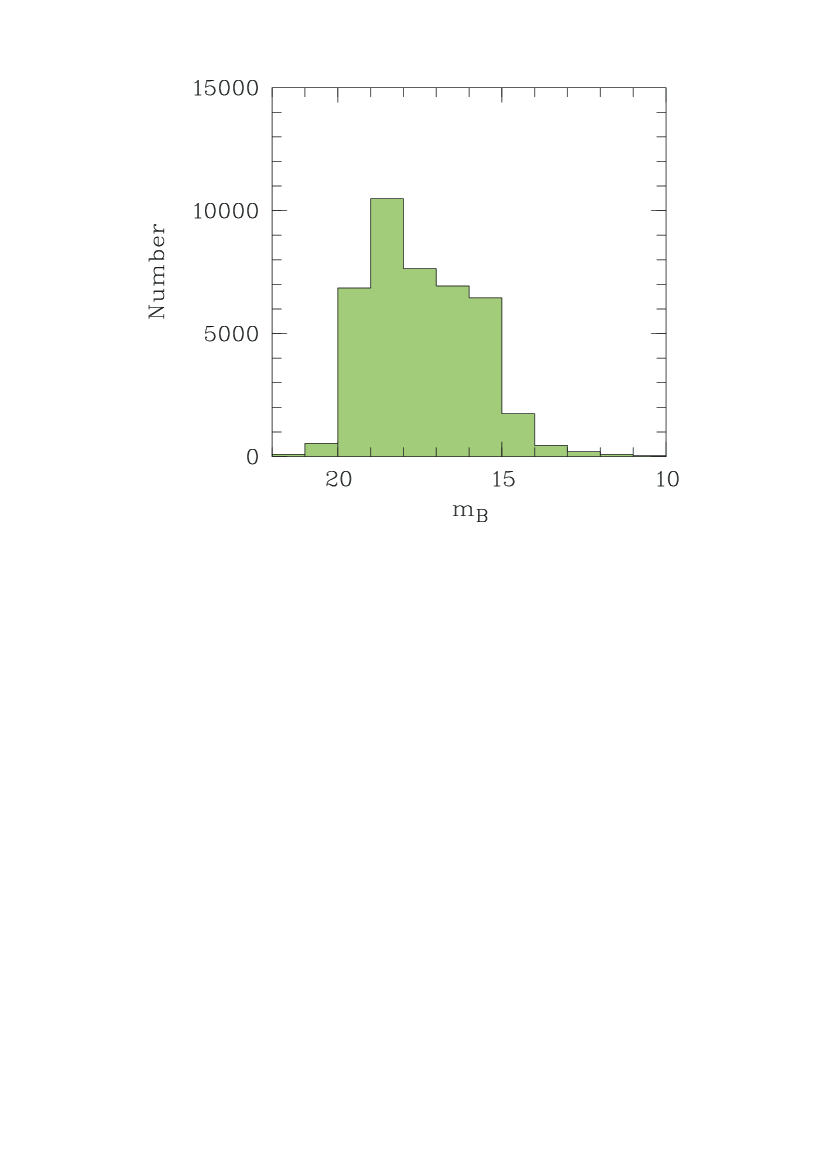
To statistically investigate the relation between Si iii absorbers and low-redshift galaxies we searched for publicly available galaxy data in the SIMBAD data archive 111http://simbad.u-strasbg.fr. Using SIMBAD we generated a list of galaxies with known redshifts located at and within of each sightline. A redshift of corresponds to a proper distance of Mpc at for a standard CDM cosmology with and km s-1 Mpc-1 (Hinshaw et al. 2013 222These values are consistent at the 2 level with the latest measured values by the Planck Collaboration (Planck Collaboration 2015. xiii).). In this way, we obtained redshifts and coordinates for galaxies distributed around the COS sightlines. For of these galaxies we have additional information on their -band magnitudes. The distribution of for these systems is shown in Fig. 3. The distribution breaks down at , with only two percent of the galaxies having . For and the above given cosmology, corresponds to an absolute magnitude of . If we consider the -band SDSS galaxy-luminosity function (Montero-Dorta & Prada 2009) as reference, this value translates into a lower luminosity cutoff of .
For each sightline, we then calculated the projected impact parameters, , of the galaxies to the LOS. There are galaxies within Mpc located in the cylindrical volume around the sightlines. This number implies a mean galaxy density of Mpc-3 in our total galaxy sample, which is about seven times the space density of galaxies in SDSS -band (Montero-Dorta & Prada 2009).
At this point it is important to mention that the galaxy catalog created in this way is highly inhomogeneous because the data stems from different galaxy surveys and pointed observations. As a result, the individual values for for each sightline vary considerably. In terms of luminosities, only a few sightlines have galaxy data that are sufficiently deep to detect faint () galaxies. In general, our galaxy data is incomplete for . This aspect needs to be carefully taken into account for the interpretation of the observed absorber/galaxy relation. For many sightlines, we are missing low-luminosity galaxies that may be close to the LOS and/or responsible for the observed metal absorption (see discussion in Sect. 6). We do not consider any other morphological parameters of the selected galaxies (Hubble type, star-formation rate, etc.), because such information is available to us only for a small fraction of the galaxies in our sample.
4 Absorber properties
4.1 Si iii detection rate, equivalent widths and column densities
Using the above outlined strategy, we identify 69 intervening Si iii absorbers along the 303 selected QSO sightlines. The statistical and physical properties of these 69 intervening absorbers are discussed in this section.
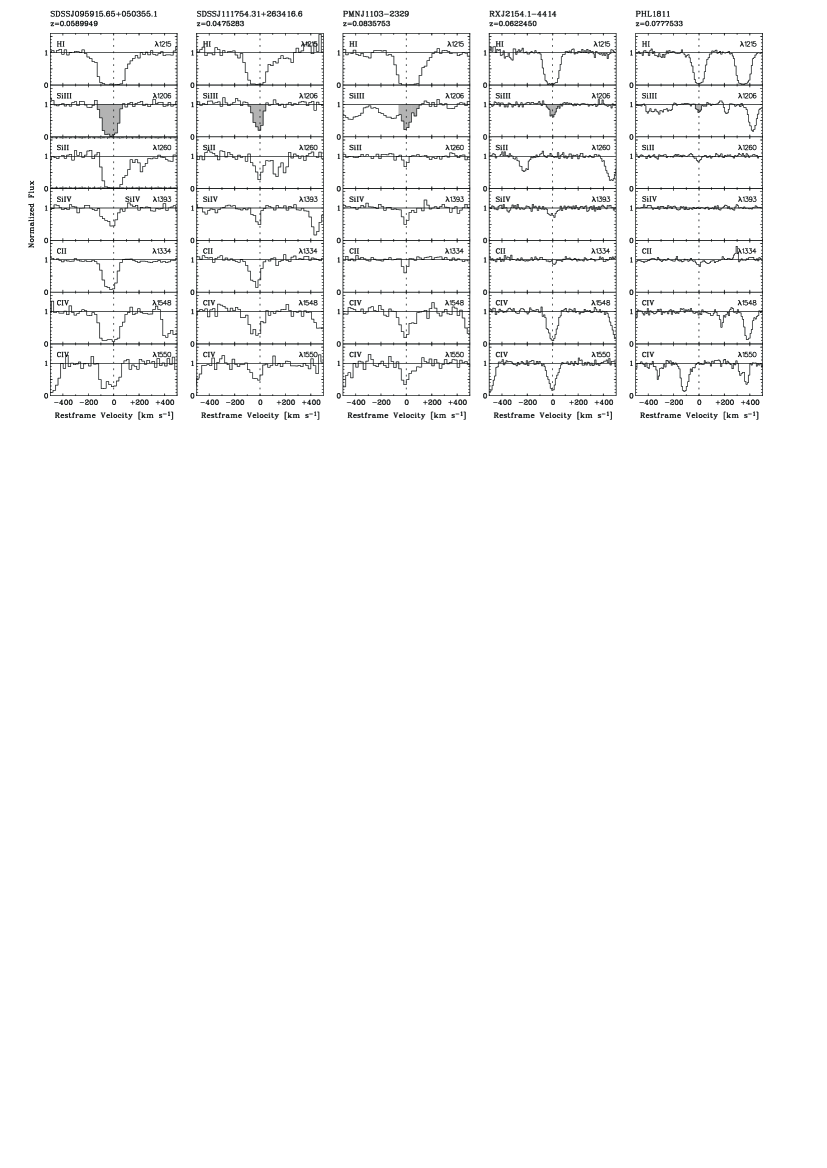
In Tables A.5-A.10 in the Appendix we list the measured equivalent widths and derived column densities for the various ions detected in these systems. These tables also contain information on two additional strong metal absorbers towards SDSSJ141542.90+163413.8 and UKS0242-724 that are detected in Si ii, Si iv, and other ions, but not in Si iii, because there are no useful data in the relevant spectral region where Si iii is expected. In Fig. 2 we show five examples for velocity profiles of intervening Si iii absorbers with different Si iii absorption strengths. The complete set of velocity profiles for all 69 confirmed Si iii absorbers is provided in Figs. A.1-A.7 in the Appendix of this paper. Following the criteria defined in the previous section we further identify 20 Si iii candidate absorbers along the 303 lines of sight. Although these candidate systems are not considered in the further analysis, we list the QSO names and (possible) absorption redshifts of these systems in Table A.11 in the Appendix.
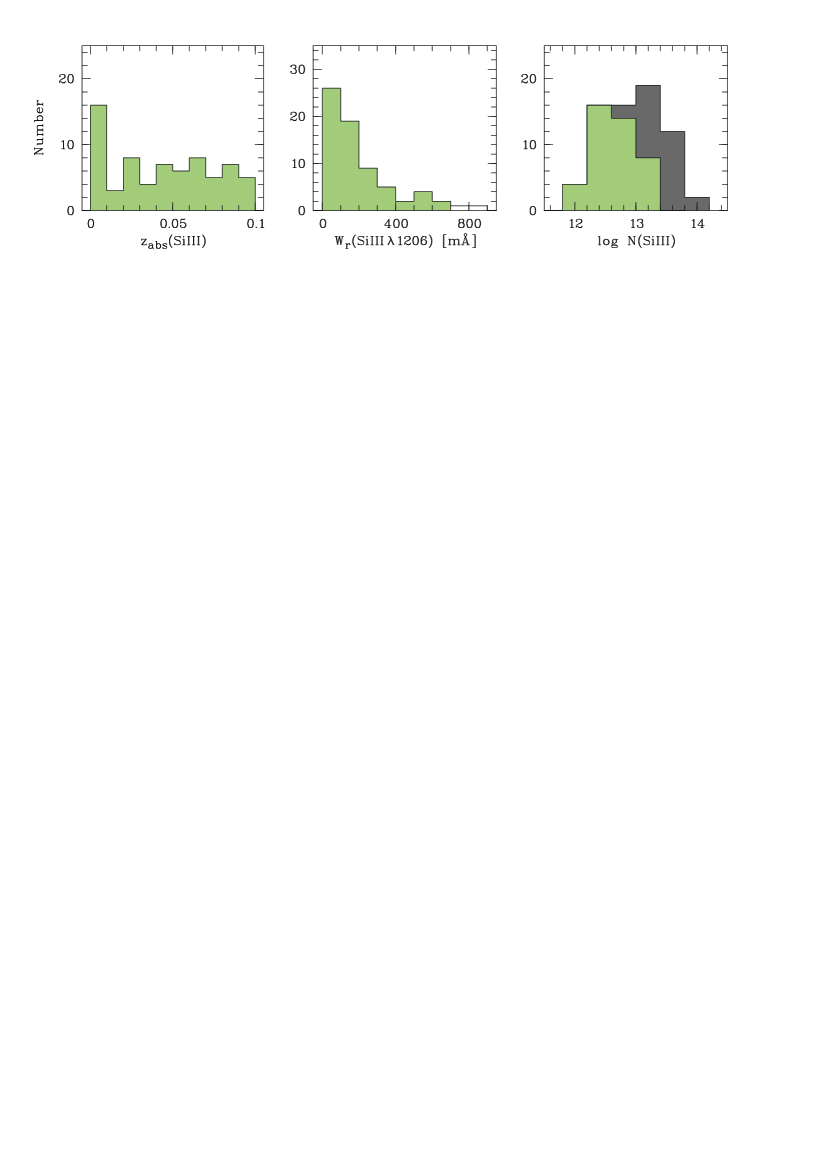
The redshift distribution of the 69 absorbers is shown in Fig. 4, left panel. The absorption redshifts lie between and . While for the absorbers are uniformly distributed over the surveyed redshift range, the distribution shows a peak in the first redshift bin at . This peak is related to an overdensity of Si iii absorbers in the broader Virgo-Cluster environment that is traced along several sightlines in our QSO sample. In the middle panel of Fig. 4 we show the distribution of Si iii equivalent widths of the 69 absorbers. The distribution peaks at relatively low equivalent widths ( mÅ); 65 percent of the absorbers have mÅ, while most of the remaining 35 percent are spread over a large range in between 200 and 700 mÅ. There are two systems that have very large equivalent widths of mÅ, belonging to strong absorption systems towards SDSSJ140732.25+550725.6 and PG 0832+251 (see Appendix).
Si iii column densities for the 69 absorbers, as derived from the AOD method (see previous section), are shown in the right panel of Fig. 4. The gray-shaded area (which adds to the green-shaded area) indicates lower limits of (Si iii) for absorbers where the Si iii line shows evidence for saturation. The decline of the observed distribution at low column densities reflects both the inhomogeneous S/N in the spectra as well as the column density distribution that is intrinsic to the absorber population. From the estimate of (Si iii) for each sightline (see equation 1) follows that more than 90 percent of all sightlines are sensitive to detect Si iii absorbers with log (Si iii, but only four such systems are found in our data (fractional abundance ). Therefore, intervening Si iii absorbers with log (Si iii are rare and may even represent a population that is distinct from the absorbers with higher column densities (as is discussed later). At the high-column density end, the distribution breaks down at log (Si iii. Even if some of the saturated absorbers (gray-shaded range) would have logarithmic Si iii column densities , their number would be small compared to absorbers with log (Si iii. Our conclusion is that the characteristic column density range for intervening Si iii absorbers is log (Si iii.
4.2 Number density of Si iii absorbers
For the determination of the number density of intervening Si iii absorbers per unit redshifz, , we need to consider in detail the completeness of our absorber survey and the selection bias in our QSO sample.
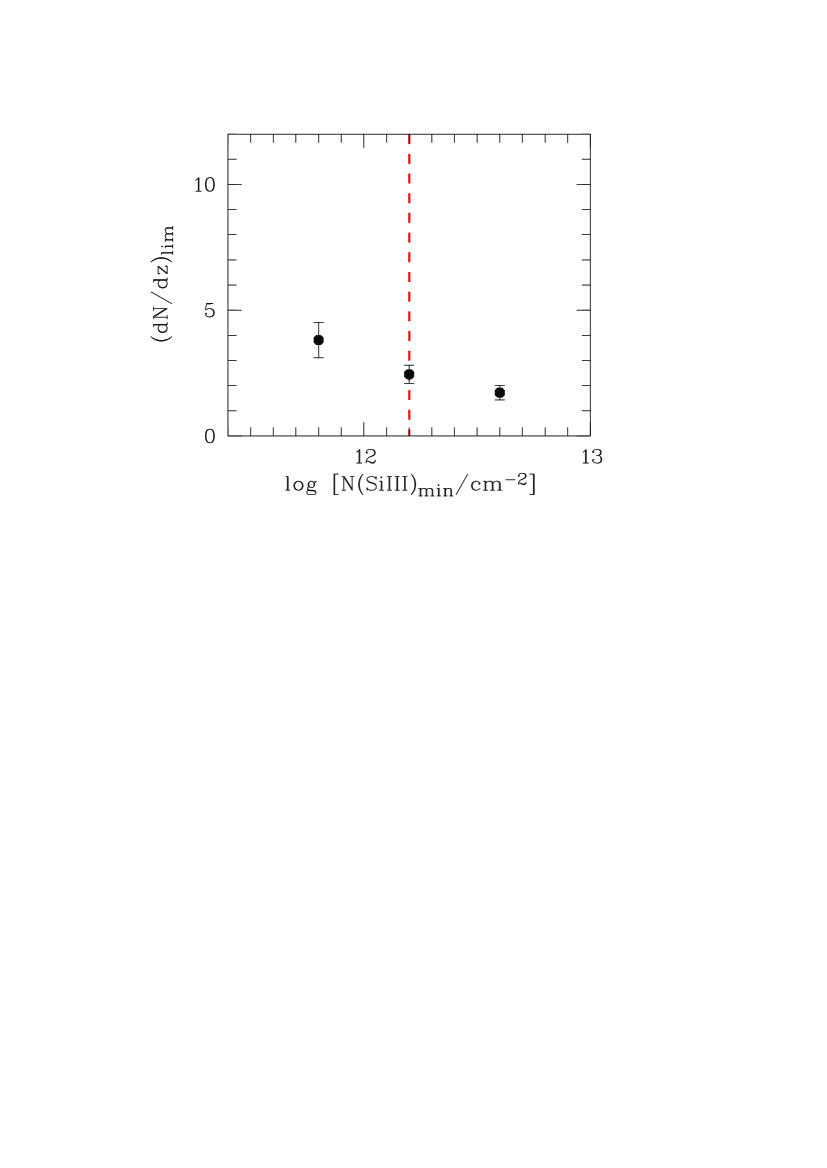
As discussed above, log (Si iii represents the column density range that is characteristic for intervening Si iii absorbers. 63 Si iii absorbers in our sample have column densities log (Si iii and 280 out of the 303 sightlines are sensitive to this level, covering a total redshift path of . The resulting number density thus is . The given errors represent statistical errors calculated from Poisson statistics. For log (Si iii we derive (31 absorbers, ), while for log (Si iii the number density is slightly smaller (, 49 absorbers, ). If we consider only low-column density absorbers with log (Si iii we obtain .
One important effect that influences the observed frequency of intervening absorption systems is the selection bias in the QSO sample that we are using. Most of the bright QSOs in our COS sample have been previously studied using instruments such as HST/STIS, FUSE, and others. While the original motivation to select these background sources certainly was their intrinsic brightness, the re-observation of these sources with COS and the chosen integration time (e.g., the achieved S/N), possibly was motivated by targeting particularly interesting intervening absorbers to perform a detailed study of these systems. Therefore, one of the reasons for limiting the absorber sample to redshifts was to avoid the inclusion of targeted observations of stronger intervening metal absorbers at that can be observed in both H i Ly as well as Ly .
We have scanned the various original COS proposals that outline the motivation for observing the LOS along which we detect intervening Si iii at . As it turns out, our QSO sample covers most of the sightlines selected for the COS-Dwarfs survey (Bordoloi et al. 2014), a targeted survey of sightlines passing through the virial radius of dwarf galaxies to study the CGM of these systems. For an un-biased estimate of (Si iii) all these sightlines need to be excluded. All in all, we identify 40 QSO sightlines in our sample that have been specifically observed to study circumgalactic gas in the vicinity of known low-redshift galaxies. By removing these sightlines from our sample we derive the following bias-corrected number densities of Si iii absorbers for the different limiting Si iii column densities: for log (Si iii, for log (Si iii, and for log (Si iii. For the range log (Si iii we again obtain .
It is evident that these numbers are not substantially different from those derived from the biased sample. This is, however, not surprising because it is known that the UV absorption cross section of the warm CGM around dwarf galaxies appears to be small when compared to the warm CGM of more massive galaxies (e.g., Bordoloi et al. 2014; Liang & Chen 2014; see also Sect. 8.3). In other words: only a few additional Si iii absorbers are (in a statistical sense) added to our absorber sample when including the pre-selected Bordoloi et al. sightlines, but because of the overall large size of our QSO sample their influence on is small.
In Fig. 5 we show the bias-corrected number density of intervening Si iii absorbers per unit redshift in our survey, , for the three different limiting Si iii column densities, log (Si iii (dashed red line), and . In the following, we refer to these values when discussing the number densities of intervening Si iii absorbers.

4.3 Associated absorption from other ions
4.3.1 H i
As outlined in the introduction, the Si iii ion is, because of its ionization potential, a very sensitive tracer for both predominantly neutral as well as predominantly ionized gas in the halos of galaxies. As a consequence, the H i column density in the Si iii absorbing gas varies over several orders of magnitudes, ranging from log (H i up to log (H i, depending on whether the sight line passes through a galaxy disk or a galaxy halo, and on the local ionization conditions. Detailed ionization models of the Si iii absorbers are presented in Sect. 7. In the left panel of Fig. 6 we show the distribution of H i Ly equivalent widths in the Si iii-selected absorbers, which similarly span an extremely large range from mÅ to Å. We generally refrain from estimating the H i column densities from the saturated H i Ly lines because of the very large uncertainties that such an estimate would be afflicted with.
It is worth noting that our absorber sample contains four damped Ly /sub-damped Ly systems (DLAs/sub-DLAs) with log (H i, as estimated from fitting the damping wings of the Ly absorption in these systems. With a total redshift path of , this absorber frequency corresponds to a number density of . Despite the low-number statistics, it is worth mentioning this value agrees well with the expected number density of sub-DLAs/DLAs as estimated from the H i mass function of galaxies (Zwaan et al. 2005).
4.3.2 Si ii
Detailed ionization models (see Sect. 7) indicate that regions with gas densities log and sufficiently large neutral hydrogen column densities are expected to show both Si iii as well as Si ii absorption. Because Si ii and Mg ii have almost identical ionization potentials (Morton 2003) and silicon and magnesium have similar solar abundances (Asplund et al. 2009), the absorber statistics for Si ii can be directly compared with the well-established statistics on intervening Mg ii absorbers. The presence of Si ii absorption without associated Si iii is basically impossible for any realistic galactic or circumgalactic gas environment (see Sect. 7), so that the fact that our absorber sample is Si iii-selected is not expected to introduce a selection bias in our Si ii statistics.
Fourty of our Si iii absorbers show associated Si ii absorption in the strongest of the available Si ii lines at Å. The equivalent-width distribution for Si ii in these absorbers is shown in the middle panel of Fig. 6. It shows that the majority (80 percent) of the detected Si ii lines have equivalent widths in the line of mÅ. To compare the observed number density of Si ii-bearing absorbers with that of the prominent strong Mg ii systems, i.e., systems that have an equivalent width of mÅ in the Mg ii line, we need to convert the observed Si ii equivalent widths into Mg ii equivalent widths. For this we use the Si ii/Mg ii conversion scheme presented in Herenz et al. (2013), after which an equivalent widths of mÅ in the Mg ii line corresponds to an equivalent width of mÅ in Si ii , assuming solar relative abundances of Mg and Si. In our absorber sample we have 22 systems that have mÅ in the Si ii line, from which we indirectly infer a number density of strong Mg ii absorbers at of . This value is in good agreement with the expectations for (Mg ii ) based on the redshift evolution of strong Mg ii absorbers in SDSS data (; Nestor, Turnshek & Rao 2005; Prochter et al. 2006; Lundgren et al. 2009; Zhu & Menard 2013).
4.3.3 Si iv
There are 38 Si iii absorbers in our sample that show associated Si iv absorption (the two available Si iv transitions are located at and Å, the former being the stronger of the two transitions; Morton 2003). The distribution of Si iv equivalent widths of the 38 absorbers detected in Si iv is shown in the right panel of Fig. 6. Similarly as for Si ii, the majority of the Si iv equivalent widths are small (82 percent have mÅ). From the observed frequency of Si iv absorption in the Si iii-selected systems we estimate (Si iv) for log (Si iv. The occurrence of Si iv absorption without associated Si iii absorption in the CGM/IGM is possible, in principle, but is relevant only for absorbers at relatively low gas densities (log ; see Sect. 7). Still, we formally can only give a lower limit for (Si iv) from our survey.
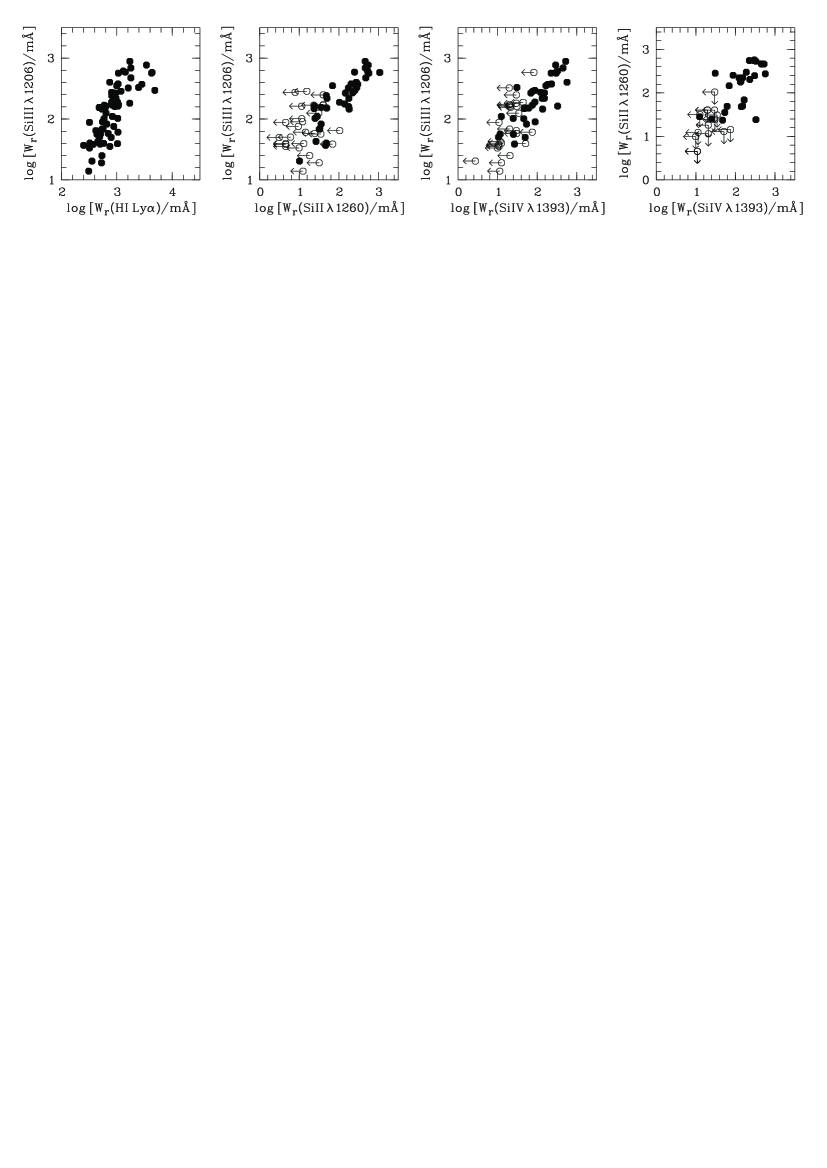
4.4 Correlation plots
In Fig. 7 we show correlations between the measured (logarithmic)
equivalent widths of Si iii , H i Ly ,
Si ii , and Si iv for absorbers
in which the absorption in these ions is aligned in velocity space
within one COS resolution element ( km s-1).
The interpretation of the observed correlations involves the possible
presence of different gas phases in the absorbers that may or may not be
co-spatial within the overall gas structures.
4.4.1 Si iii vs. H i
For log (Ly the Si iii equivalent width rises steeply with the mildly increasing equivalent width of the fully saturated H i Ly absorption (Fig. 7; left panel). This trend indicates (as expected) that Si iii and H i trace the same physical regions that span a large range in neutral (and total) gas column densities. For log (Ly the correlation turns over into a somewhat flatter regime because the Si iii absorption itself becomes saturated at such high total gas columns.
4.4.2 Si iii vs. Si ii
The equivalent widths of Si iii and Si ii clearly are correlated with each other in those absorbers, where both ions are detected (Fig. 7; second panel from left, filled circles). This demonstrates that part of the Si iii arises in the same gas phase as Si ii, i.e., in predominantly neutral and/or mildly ionized gas. Some of the systems with upper limits in (open circles/arrows) have relatively strong Si iii absorption without a Si ii counterpart, implying that these absorbers consist of predominantly ionized gas that is traced by higher ions (e.g., Si iv, see below).
4.4.3 Si iii vs. Si iv
For systems that show both Si iii as well as Si iv absorption the equivalent width of Si iii is also correlated with that of Si iv , as can be seen in the third panel of Fig. 7 (filled circles). This trend indicates that some part of the Si iii resides in a more ionized gas phase that is traced by Si iv (and other high ions such as C iv). The relation is mildly steeper than the one for Si iii/Si ii, but has as similar level of scatter.
4.4.4 Si ii vs. Si iv
In the right panel of Fig. 7 we have plotted the equivalent width of Si ii against that of Si iv for the absorbers where both ions are detected. The total number of systems that show aligned Si ii and Si iv absorption is relatively small ( percent). This implies that both ions predominantly trace complementary gas phases. For the systems detected in both ions (filled circles) the correlation between (Si ii ) and (Si iv ) is weak and shows a relatively large scatter.
4.4.5 Interpretation
We conclude that the correlation plots between the equivalent widths of Si iii , H i Ly , Si ii , and Si iv are in line with (and further support) the idea that the Si iii absorption in intervening metal-systems traces metal-enriched gas within a wide range of physical conditions including a) a denser (partly neutral) phase also traced by Si ii and other low ions, and b) a more diffuse (predominantly ionized) gas phase also traced by Si iv and other high ions. We further discuss these aspects in Sect. 7 where we model the ionization conditions in Si iii/Si iv absorbers in detail.
In a recent C iv-selected survey of absorbers at Burchett et al. (2015) find very similar relations between Si ii, Si iii, and Si iv in their absorber sample (their Figs. 15 and 16).
5 On the expected cross section of metal-enriched gas in galaxy halos
Before we investigate in detail the observed relation between Si iii absorbers and galaxies in a statistical sense, we first set up a geometrical model to estimate the expected cross section of metal-enriched gas in the extended gaseous halos of galaxies at .
Under the assumption that all intervening Si iii absorbers at low are related to metal-enriched gas situated in the extended halos of galaxies, the observed number density of Si iii absorbers can be directly linked to the space density of galaxies, , and the effective (geometrical) cross section of the absorbing gas, which is a product of the projected area covered by the gaseous halo and the mean covering fraction of the gas phase that is seen in absorption:
| (2) |
The Hubble parameter is defined as , which is appropriate for a matter-dominated flat Universe with a cosmological constant. Equation (2), and modified versions of it, have been commonly used to estimate the sizes of galaxy halos and the covering fractions of individual ions from QSO absorption-line observations (e.g., Kapzcrak et al. 2008; Richter et al. 2011; Prochaska et al. 2011).
We here take the opposite point of view and pose the following question: What would be the expected number density of intervening metal absorbers, if all galaxies at contain detectable metal-enriched gas in their halos that extends exactly to their respective virial radii?
Using equation (2) it is indeed relatively straight-forward to set up a ”toy model” for the absorption cross section of extended halo gas taking into account the observed space density and luminosity/mass distribution of galaxies at low redshift. The motivation for such a reverse approach is rather simple: if we could know the maximum contribution of metal-enriched gas that is gravitationally bound to galaxies to the number density of intervening metal absorbers, we would have an important reference value for the interpretation of the observed number densities of intervening Si iii systems and their origin in the CGM and/or IGM.
Both the galaxy density as well as the distribution of the galaxies’ virial radii at , i.e., the most important parameters to calculate via equation (4), can be obtained indirectly from the local galaxy luminosity function. We here adopt the -band SDSS luminosity function from Montero-Dorta & Prada (2009), who give Schechter parameters of and Mpc-3 for . We transform these parameters to the cosmological frame defined in Sect. 3.3. and calculate for different luminosity bins, where is the incomplete gamma function and is the characteristic luminosity that characterizes the cut-off for the power-law component in the Schechter luminosity function (Schechter 1976).
| Model | |||||||
|---|---|---|---|---|---|---|---|
| [Mpc-3] | [Mpc-3] | [Mpc-3] | |||||
| 1 | -1.00 | 0.0075 | 0.0125 | 0.0175 | 1.81 | 3.02 | 4.23 |
| 2 | -1.10 | 0.0075 | 0.0125 | 0.0175 | 2.18 | 3.64 | 5.09 |
| 3 | -1.20 | 0.0075 | 0.0125 | 0.0175 | 2.73 | 4.56 | 6.38 |
| 4 | -1.30 | 0.0075 | 0.0125 | 0.0175 | 3.58 | 5.97 | 8.35 |
a The following Schechter parameters are given: slope of the power-law component;
normalization density;
the preferred parameter combination is indicated with the
bold-face font.
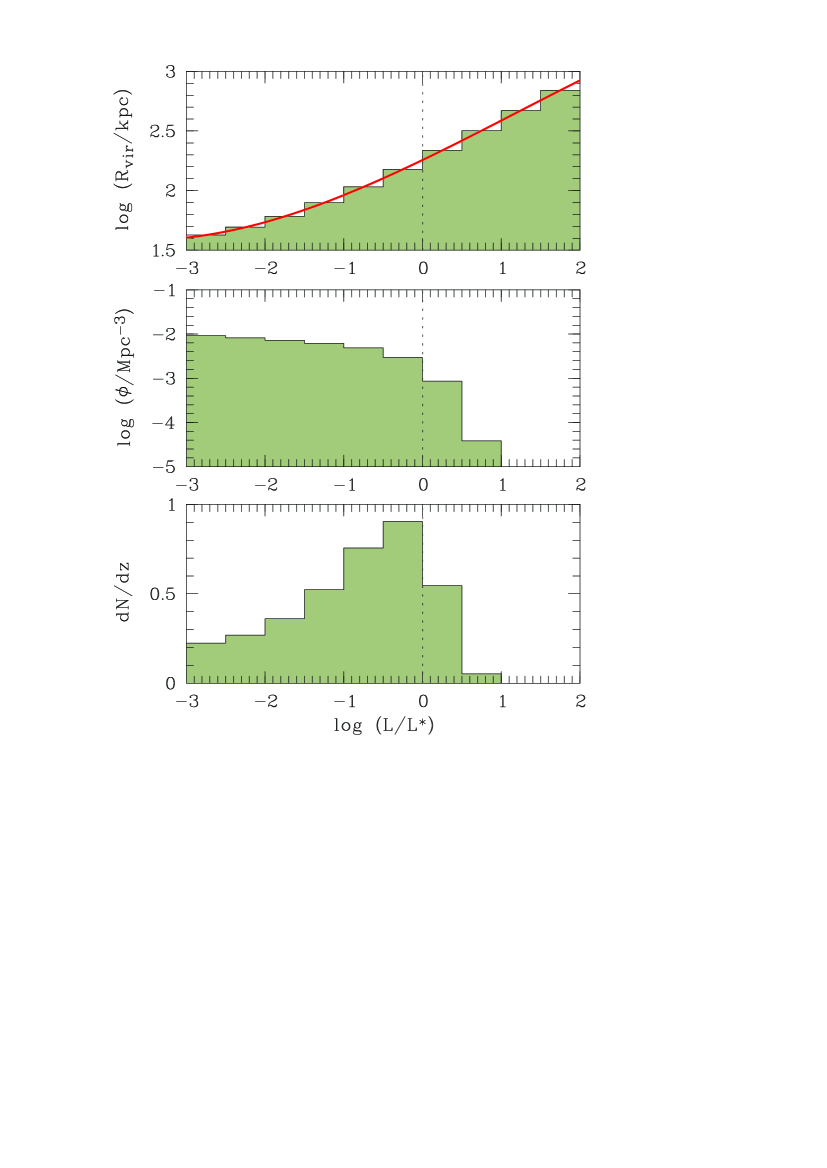
The key assumption in our toy model is that all halos of galaxies with luminosities contain metal-absorbing gas within their virial radii (). We initially assume a unity covering fraction of the absorbing gas, so that the effective absorption cross section is simply . Also the virial radius of a galaxy can be inferred indirectly from its luminosity. As recently discussed by Stocke et al. (2014), halo matching models provide a relatively well-defined relation between and that can be used to define a scaling relation between these two parameters. We define and approximate the relation between and shown in Stocke et al. (their Fig. 8) by the fit
| (3) |
Equipped with these relations we can now assign to each luminosity bin a galaxy space density and an effective absorption cross section , which is all we need to calculate the expected number density of absorbers for the same bin. Integration over all galaxy luminosity bins then provides the expected total number density of absorbers arising from the halos of these galaxies.
Fig. 8 summarizes the main results from our modeling. The red solid line in the upper panel visualizes the -relation defined by equation (3), while the green-shaded histogram indicates the same relation in bins of log . In the middle panel of Fig. 8 the logarithmic galaxy density (log is plotted against log (same binning), while in the lower panel we show the expected number density of absorbers (assuming a unity covering fraction, ) as a function of log for the same binning. By integrating over the desired luminosity range we obtain an estimate for the total number density of absorbers that arise in the gaseous halos of the galaxies in that luminosity range.
While our observational galaxy sample is restricted to relatively bright galaxies (see Sect. 3), we here consider the much larger range to evaluate the potential contribution of faint galaxies and their halos to the total cross section of intervening metal absorbers, even if they remain unseen in galaxy surveys. For and unity covering fraction we obtain a total absorber number density of . If we include the mean covering fraction as free parameter (which then represents an area-weighted mean), we can write more generally:
| (4) |
For realistic gas covering fractions in galaxy halos in the range this absorber number density is remarkably close to the observed number density of intervening Si iii absorbers, as discussed in the previous section.
| kpc | ||||||
|---|---|---|---|---|---|---|
| 200 | 1.00 | 0.18 | 0.27 | 0.48 | 1.00 | |
| 400 | 1.00 | 0.04 | 0.07 | 0.12 | 0.31 | |
| 1000 | 1.00 | 0.01 | 0.01 | 0.02 | 0.05 | |
| 200 | 0.75 | 0.13 | 0.20 | 0.36 | 0.96 | |
| 400 | 0.75 | 0.03 | 0.05 | 0.09 | 0.23 | |
| 1000 | 0.75 | 0.01 | 0.01 | 0.01 | 0.04 | |
| 200 | 0.50 | 0.09 | 0.14 | 0.24 | 0.62 | |
| 400 | 0.50 | 0.02 | 0.03 | 0.06 | 0.16 | |
| 1000 | 0.50 | 0.00 | 0.01 | 0.01 | 0.02 | |
One serious concern about the relevance of the above given estimate is, how strongly the derived absorber number density depends on the input parameters from the adopted galaxy luminosity function. To explore this dependence we have calculated for a whole set of (realistic) Schechter parameters, as presented in Table 1. For this, we vary for a given slope in each row the normalization density from over to (where Mpc-3 represents our preferred normalization; see above) and calculate the expected absorber number densities , , . For Schechter parameters in the range and the expected number densities vary between and . It is therefore valid to claim that the expected contribution of the metal-enriched CGM to the cross section of intervening metal absorbers is (this conclusion holds for any metal ion that can be observed via QSO absorption spectroscopy).
One may argue that the values for estimated in this manner over-estimate the true absorption-cross section of gaseous halos because galaxy halos can overlap with each other (in particular satellite galaxies and their hosts), so that the effective halos cross section of a galaxy ensemble would be smaller than the sum of for all individual galaxies in that ensemble. This effect is commonly investigated in studies that aim at characterizing the relationship between the stellar masses of galaxies and their superordinate dark matter (DM) halos, e.g., by using statistical methods such as the Halo Occupation Distribution (HOD) formalism and others (e.g., Peacock & Smith 2000; Moster et al. 2010). From these models follows that, on average, only the most massive halos (with DM halo masses , corresponding to ) are occupied by more than one galaxy. These halos are rare, however, and their contribution to is small (see Fig. 8), so that a small change in the absorption cross section of such massive halos basically would have no influence on the estimate of the integrated number density of intervening absorbers.
A comparison between the estimated gas cross section of galaxy halos from our model with the observed number density of intervening Si iii absorbers allows us to draw some very interesting conclusions. The first important conclusion is that, because Si iiimodel) for log (Si iii, the entire population of these Si iii systems can be explained by metal-enriched gas that is gravitationally bound to galaxies, i.e., there is no need for an intergalactic gas component that hosts Si iii absorbers at this strength. Turning this argument around, our model also predicts that intervening metal absorbers with number densities (e.g., O vi absorbers with ; Tripp et al. 2008) must partially arise from gas outside of the virial radius of galaxies. This aspect is further discussed in Sect. 8. A second conclusion is that for our preferred model with and Mpc-3 (Montero-Dorta & Prada 2009) the mean covering fraction of Si iii within is expected to be , a value that is similar to the covering fraction of Si iii in the halo of the Milky Way, as recently derived from QSO absorption-line observations (Herenz et al. 2013; Lehner et al. 2012). In Sect. 6 we further investigate, whether the observed distribution of galaxies around Si iii absorbers is in line with these conclusions.
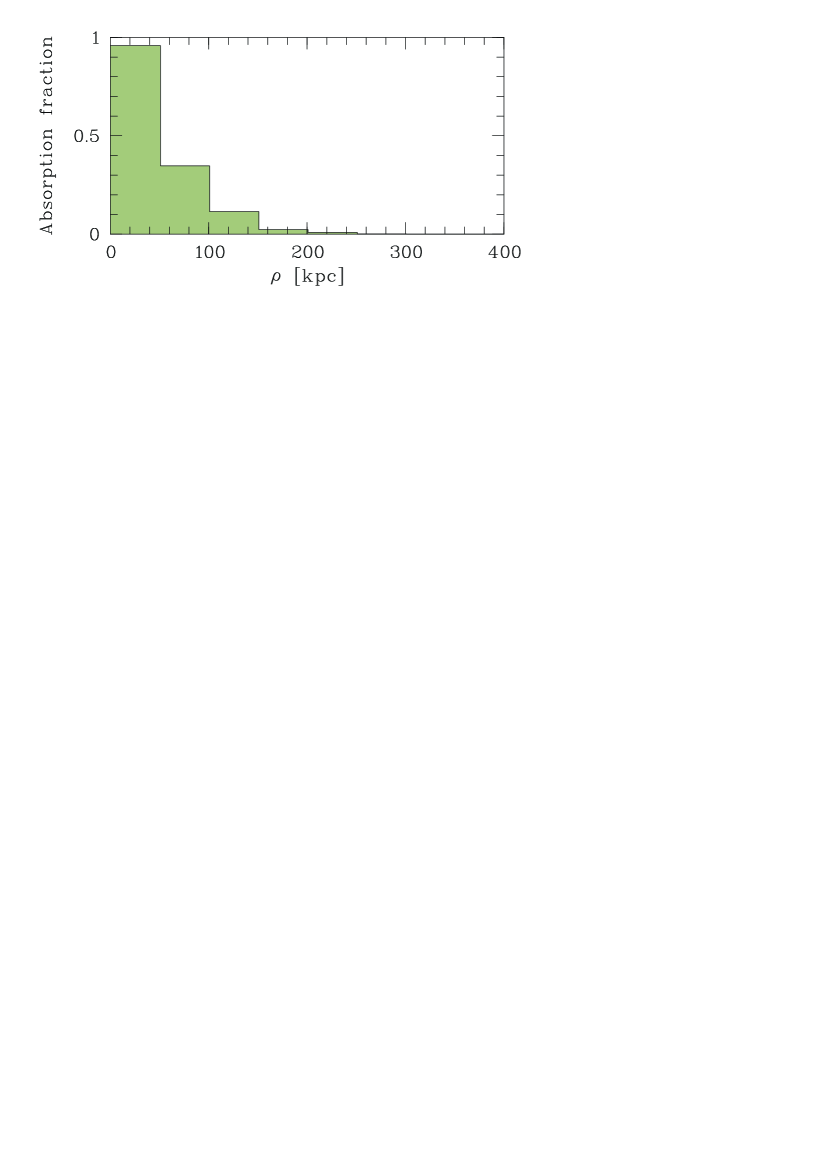
Our model further allows us to predict the mean absorption fraction around galaxies as a function of impact parameter . We here define the mean absorption fraction as the detection rate of intervening absorption from CGM gas for a given impact parameter for a population of galaxies with different virial radii. Only the most luminous galaxies with large are expected to contribute to the mean absorption at kpc, while for small impact parameters kpc both luminous as well as faint galaxies do contribute. Consequently, the mean absorption fraction around galaxies is expected to decline in a way that is determined by the distribution of (and thus by the shape of the galaxy luminosity function).
In Fig. 9 we show the mean absorption fraction plotted against (in bins of 50 kpc), as derived from our preferred model with Schechter parameters and Mpc-3. As expected, the absorption rate decreases rapidly with increasing impact parameter because the fraction of sightlines that pass galaxies at increases. Fig. 9 can be directly compared to the observed absorption rate around low-redshift galaxies, as is presented in Sect. 6.
Another important piece of information that can be extracted from our model concerns the expected covering fraction of circumgalactic gas around a population of galaxies in a given luminosity range. It is useful to transform the absorption rate into an effective covering fraction, , that is normalized to a fixed radius (instead of being normalized to , which depends on the galaxy’s mass and luminosity). To carry out this transformation we need to take into account that the covering fraction describes the detection rate per unit area. Since the area of each ring with thickness and radius is , the absorption rates need to be weighted with and integrated from to to obtain . In this way, it is possible to predict from our model the effective covering fractions for different values of for a population of galaxies in a given luminosity range. In Table 2 we list the predicted effective CGM covering fractions for different values of , , and different luminosity ranges based on the preferred parameters for the galaxy luminosity function (see Table 1). We would like to emphasize again that in this approach describes the average CGM covering fraction of a population of galaxies within an annulus with a fixed radius, while describes the mean covering fraction of the galaxies’ CGM within .
6 Observed absorber-galaxy connection
6.1 Individual galaxies associated with Si iii absorbers
To characterize the true absorber-galaxy connection at we have calculated the geometrical impact parameters between the sightlines that exhibit Si iii absorbers at in our COS data and nearby galaxies in our galaxy catalog (see Sect. 3.3).
Ideally, one would study the relation between absorbers and galaxies using the absorber-galaxy cross-correlation function together with a well-defined galaxy completeness function. Our galaxy sample, that is based on many different galaxy surveys and individual observations, is highly inhomogeneous with respect to the completeness limit at the faint end of the band magnitude distribution, however, and therefore a statistically meaningful galaxy completeness function cannot be obtained. We would like to point out, however, that the motivation for including these galaxy data in our study is not to provide a statistically complete sample of absorber/galaxy pairs, but to qualitatively check the plausibility of our hypothesis, in which most Si iii absorbers at arise in the extended gaseous halos of luminous low-redshift galaxies, for which the present galaxy data sample is sufficient in depth.
Because of the above mentioned limitations we cannot simply combine the impact-parameter distributions of the individual sightlines to statistically investigate the overall absorber-galaxy connection, but instead have to evaluate the connection between absorbers and galaxies along each sightline individually before combining the results. In the following, we further specify our strategy how to do this.
For each sightline that contains an intervening Si iii absorber we first selected all galaxies that have recession velocities within km s-1 of the absorber (hereafter referred to as ”LOS absorber sample”) and identified the galaxy with the smallest impact parameter to the sightline. For the same line of sight we then created a set of nine galaxy control samples covering the adjacent velocity range km s-1, where each LOS control sample spans a velocity range of km s-1, similar as for the LOS absorber sample. We again marked the galaxies that are nearest to the LOS. The galaxy samples constructed in this way have the same magnitude completeness for each sightline.
If intervening absorbers would trace the CGM of galaxies that are close to the sightlines (as we suspect), one would expect for a large-enough absorber/galaxy sample (as provided here) that the impact parameters of the nearest galaxy to the LOS in the absorber samples are, on average, substantially smaller than in the control samples. Such a trend is indeed seen in our data: for 76 percent of the LOS that exhibit an intervening Si iii absorber, the galaxy with the smallest impact parameter is located within km s-1 of the absorption redshift.
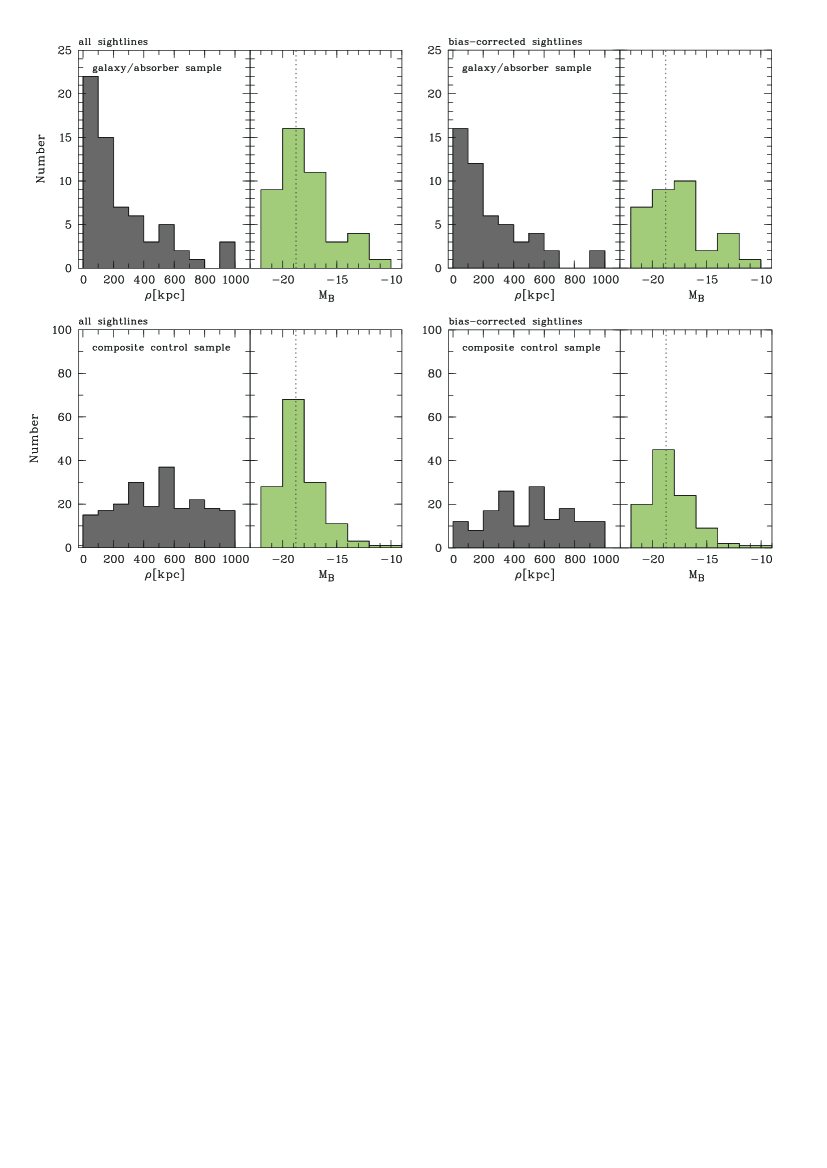
In the upper panels of Fig. 10 (gray-shaded histograms) we show the distribution of for the nearest galaxies in the LOS absorber samples (”galaxy/absorber sample”) for all sightlines with Si iii absorbers (left column) and for the bias-corrected set of sightlines with Si iii absorbers (right column). Obviously, galaxies cluster around sightlines if an Si iii absorber is present. This trend is evident in both galaxy/absorber samples (total sample and bias-corrected sample), but in the (biased) total sample there are more data points in the lowest -bin, as is expected from the design of the Bordoloi et al. (2014) COS-Dwarfs survey (see Sect. 4.2).
Still, in the bias-corrected galaxy/absorber sample, percent of the galaxies are located at impact parameters kpc and for the same percentage the velocity difference between the galaxy and the absorber is km s-1. From our model we would expect that the maximum impact parameter in an idealized galaxy sample is kpc, as this length scale corresponds to the virial radius of the most luminous galaxies that are expected to significantly contribute to the number density of Si iii absorbers before the galaxy-density distribution breaks down for higher luminosities (Fig. 8, middle panel). However, since our galaxy sample is incomplete and highly inhomogeneous along the different LOS with respect to galaxies at the faint end of the luminosity function, the observed distribution of extends much further out. With the green-shaded histogram we show in Fig. 10 the absolute -band magnitudes for the galaxies in the galaxy/absorber samples, as calculated from their cosmological distance. The dotted line indicates the absolute magnitude of an galaxy (adopted from Montero-Dorta & Prada 2009).
To check the statistical significance of this clustering trend we analyzed the galaxies in the respective control samples in a similar manner. We find that the galaxies do not cluster around the sightlines in any of the control samples, but their impact parameters are more or less evenly distributed. To demonstrate this, we show in the lower left and right panels of Fig. 10 the impact-parameter distributions in the control samples, i.e., for galaxies that have no absorption systems within km s-1. For this, we combined for each of the two data sets (total sample/bias-corrected sample) the nine individual control samples to one ”composite control sample”, respectively, which contains all galaxies within the velocity window km s-1 with respect to the absorber redshift (see above).
The distributions of absolute -band magnitudes in the composite control samples (Fig. 10, lower left panel, green-shaded areas) are similar to those in the galaxy/absorber samples, proving that the different galaxy samples have the same completeness in .
In summary, the observed absorber-galaxy relation strongly suggests that the galaxies ”know” about the presence of nearby Si iii absorption systems. This is exactly what would be expected if the absorption were (predominantly) caused by metal-enriched gas in the extended halos and the superordinate cosmological environment of these galaxies.
For our bias-corrected galaxy/absorber sample we calculate effective covering fractions of for kpc and for kpc. These effective covering fractions are comparable to those expected for a population of galaxies that are surrounded by a CGM that reaches out to with (Table 2).
6.2 Absorption strength vs. impact parameter
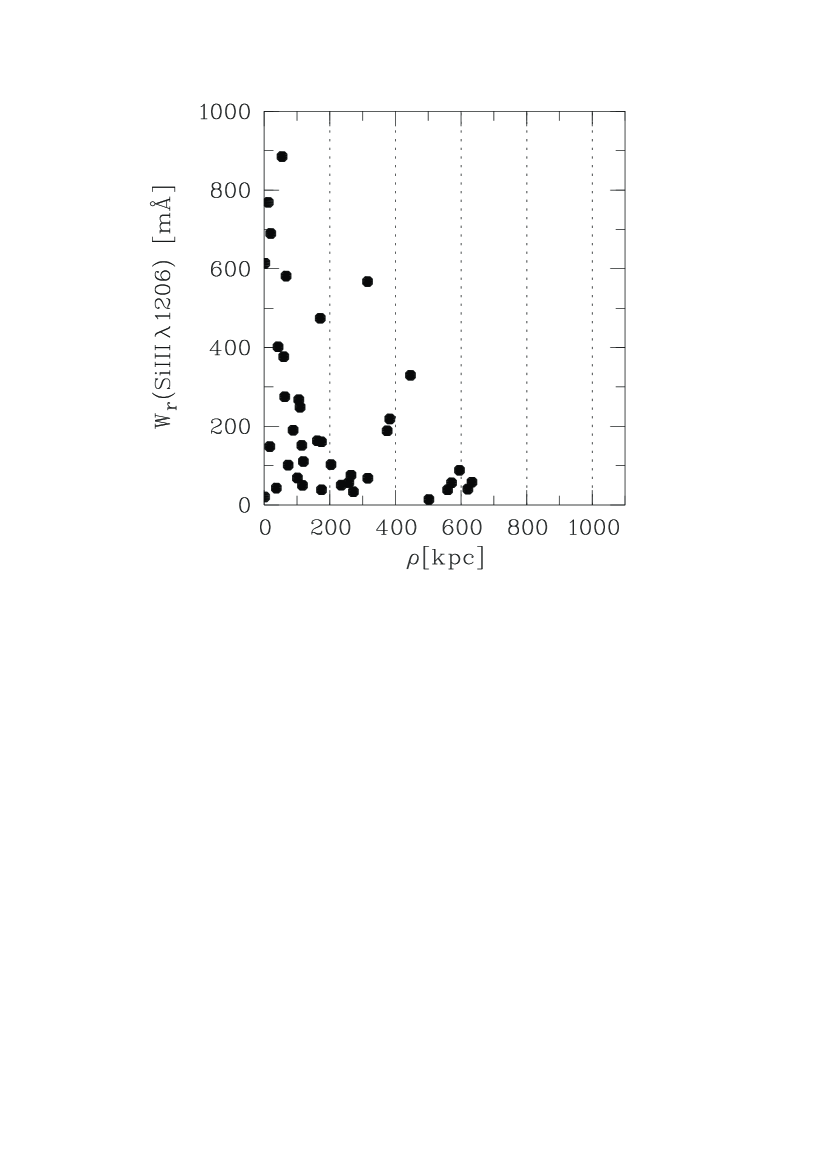
In Fig. 11 we plot the restframe equivalent widths of Si iii versus the impact parameters of the galaxies nearest to the absorbers. For kpc the equivalent width scatters strongly in the range mÅ. For increasing impact parameters the maximum value for (hereafter referred to as ) is decreasing to values mÅ for kpc.
The interpretation of this plot is not as simple as it may look like: because of the incompleteness of the galaxy sample, the largest values for (which are far beyond the virial radii of the most massive galaxies) do not represent true impact parameters to the nearest galaxies, but rather indicate the impact parameters to the nearest luminous galaxies. From observations of strong Mg ii absorbers it is known that the mean Mg ii equivalent width in the CGM of luminous galaxies is larger than for low-luminosity galaxies (e.g., Nielsen et al. 2013). Assuming that a similar trend holds for Si iii, the large scatter for (Si iii ) at kpc can be interpreted by the large range in luminosities of the galaxies whose circumgalactic gas causes the absorption, where is is determined by the most luminous galaxies. The decline of for increasing then simply reflects the decreasing likelihood to miss luminous galaxies around the absorbers that are responsible for for the strongest absorbers. For large values of , only absorbers with small values remain, as they belong to low-luminosity galaxies that are too faint to be covered in our galaxy sample.
6.3 QSO sightlines associated with individual galaxies
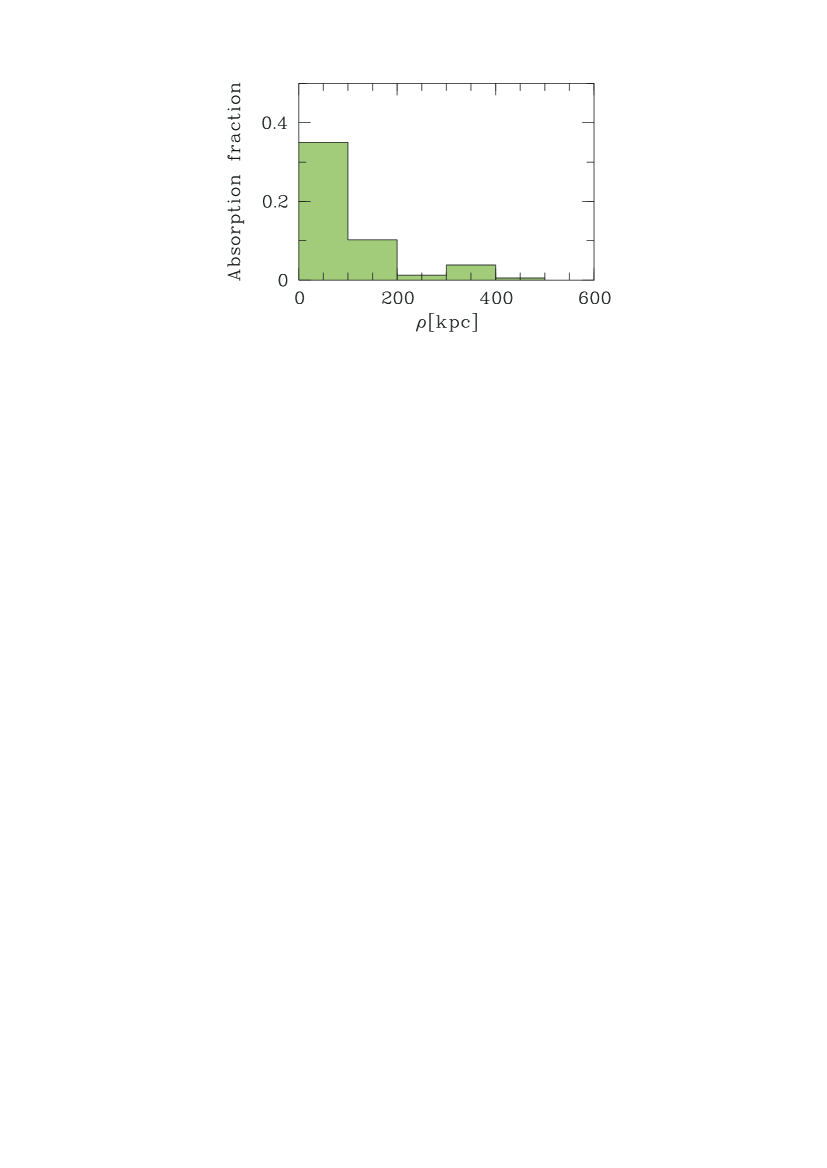
We now investigate the absorber/galaxy-connection from the perspective of the galaxies. For each galaxy in our sample we first identified QSO sightlines that pass the galaxies at impact parameters kpc. We then further selected only galaxies in redshift ranges that are covered by each relevant COS spectrum at a S/N that is high enough to detect Si iii absorption at column densities log (Si iii. Finally, we calculated for each kpc wide impact-parameter bin the absorption fraction (i.e., the fraction of galaxies having a Si iii absorber above this column density limit in this impact-parameter range). The result from this analysis is shown in Fig. 12. As can be seen, the observed absorption fraction is substantially smaller than the one derived from the idealized halo model (Fig. 9), but extends to much larger impact parameters even beyond the expected virial radii of massive galaxies. We again interpret this behavior as a sign for the incompleteness in our galaxy data, i.e., we suspect that sightlines that have apparent galaxy impact parameters in the range kpc are arising from halo gas within the virial radii of unseen galaxies.
7 Ionization conditions
7.1 Model setup
To gain insight into the physical properties of the intervening Si iii absorbers and to estimate the total gas mass that they trace we studied the ionization conditions in the absorbers using the ionization code Cloudy (v13.03; Ferland et al. 2013). The absorbers are modelled as plane-parallel slabs with fixed neutral gas column densities; they are exposed to the UV background radiation with log (see Sect. 2 for more details on the used UV background field) and are assumed to be optically thin in H i.
In Sect. 4 we have suggested that Si iii traces at least two characteristic gas phases, a more ionized, diffuse phase that is also traced by Si iv, and a more dense (partly neutral) phase that is also detected in Si ii. For our Cloudy modeling we therefore have focused on the relation between the column densities of H i, Si ii, Si iii, and Si iv as a function of the ionization parameter , the ratio between ionizing photon density and total particle density (i.e., ). For an assumed ionizing radiation field one can calculate and thus can relate U with the gas density .
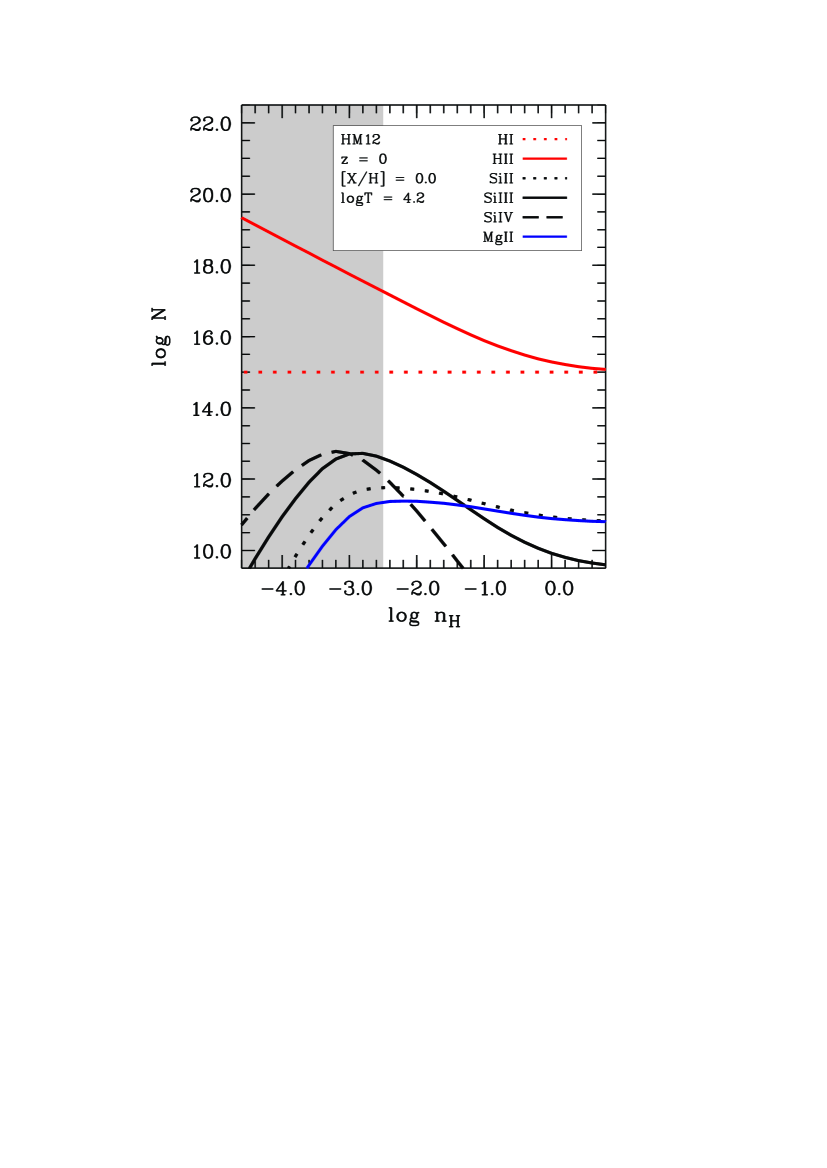
In Fig. 13 we have plotted (as an example) the expected H ii, Si ii, Si iii, and Si iv column densities against log for a (typical) H i column density of log (H i, based on a set of Cloudy models assuming solar abundances of all heavy elements (Asplund et al. 2009). We also show the expected trend for Mg ii, which follows Si ii very closely over the entire density range. This similarity justifies our previous approach to estimate the number density of strong Mg ii using Si ii as a proxy (Sect. 4.3.2). We have set up a grid of Cloudy models in which we have varied the H i column density in the range log (H i to provide column-density predictions for the above listed ions.
The most important conclusion from this modeling is that the shapes of the column-density curves for H ii, Si ii, Si iii, Si iv, and Mg ii (and their positions relative to each other) basically do not depend on log (H i), implying that the observed column density ratios of the Si ions can be used to constrain in optically thin H i/Si iii absorbers even without knowing (H i).
Fig. 13 further indicates that Si iv becomes the dominant ion of Si only for relatively low gas densities (log ), while Si iii dominates in the density range log . Si ii is dominant at log , thus at densities that are expected to be relevant only for DLAs and sub-DLAs in the neutral gas disks and in predominantly neutral gas structures in the inner halos of galaxies (e.g, in high-velocity clouds).
7.2 Single-phase model
One may assume that the simultaneous absorption of Si ii, Si iii, and Si iv at similar radial velocities, such as observed in some systems, stems from a single gas phase in the absorbers. For that case, our Cloudy models provide some firm predictions for the allowed column-density ranges for these three ions that can be summarized by the following parametrization of the expected column-density ratios Si iii/Si iv and Si iii/Si ii in a single gas phase:
| (5) |
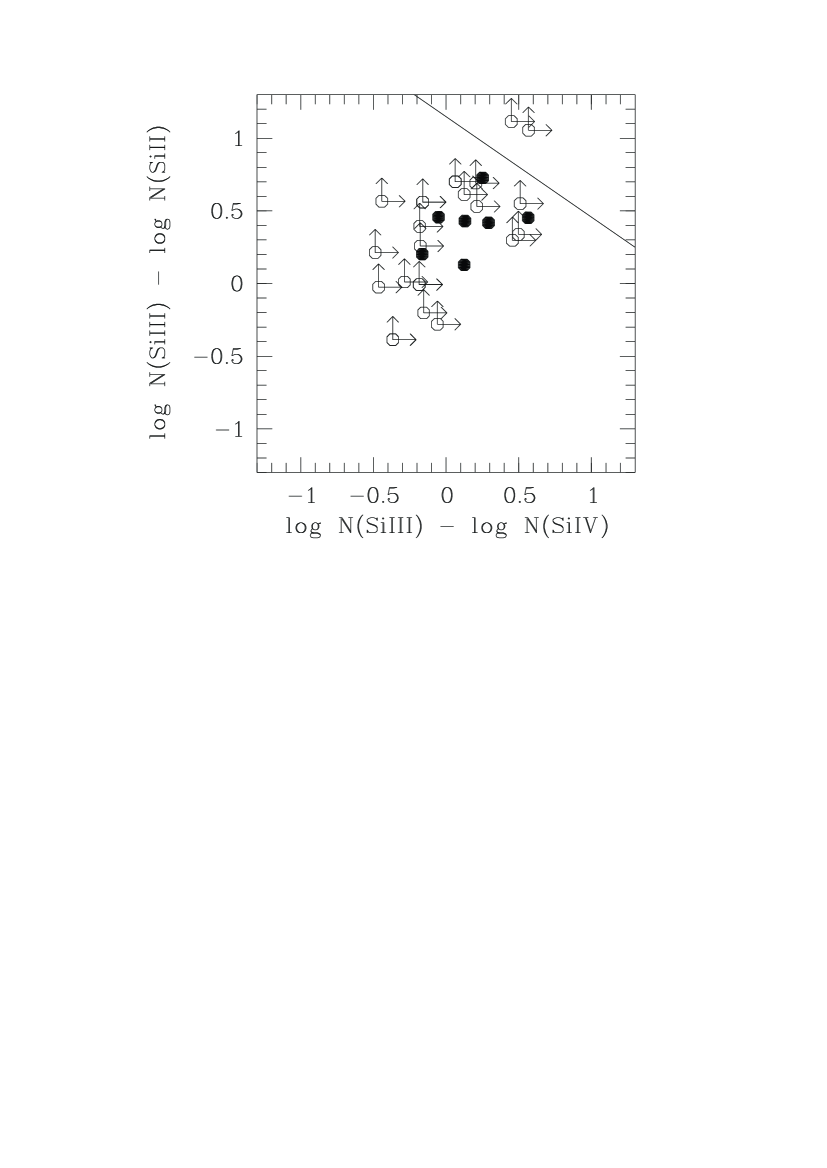
In Fig. 14 we have plotted the observed column-density ratios of these ions (and relevant limits) together with predictions from the Cloudy model as given in equation (5) (the model is indicated in Fig. 14 by the black solid line). For none of the systems that have measured column densities for Si ii, Si iii, and Si iv (Fig. 14 filled circles) do the data points lie on the expected relation for the single-phase model. For all systems for which we have measured values in these three ions the Si ii and/or Si iv column densities are too high for the observed Si iii column density to match the single-phase model. While we cannot exclude that at least some of the sytems for which only lower limits for Si iii/Si iv and Si iii/Si ii are available are in accordance with the single-phase model, the observations clearly do not favor such a scenario, but rather point towards a more complex multiphase nature of gas, as considered below.
7.3 Multi-phase model
The alternative (and probably more realistic) model for the absorbers is that of a multiphase gas, where Si ii and Si iv predominantly trace different gas phases (and different physical regions) that coexist within the same overall absorbing gas structures. In the Milky Way halo, the existence of multiphase halo gas as traced be various low, intermediate, and high ions is well established (e.g., Sembach et al. 2003; Fox et al. 2006; Collins et al. 2009; Shull et al. 2009; Richter et al. 2009; Herenz et al. 2013).
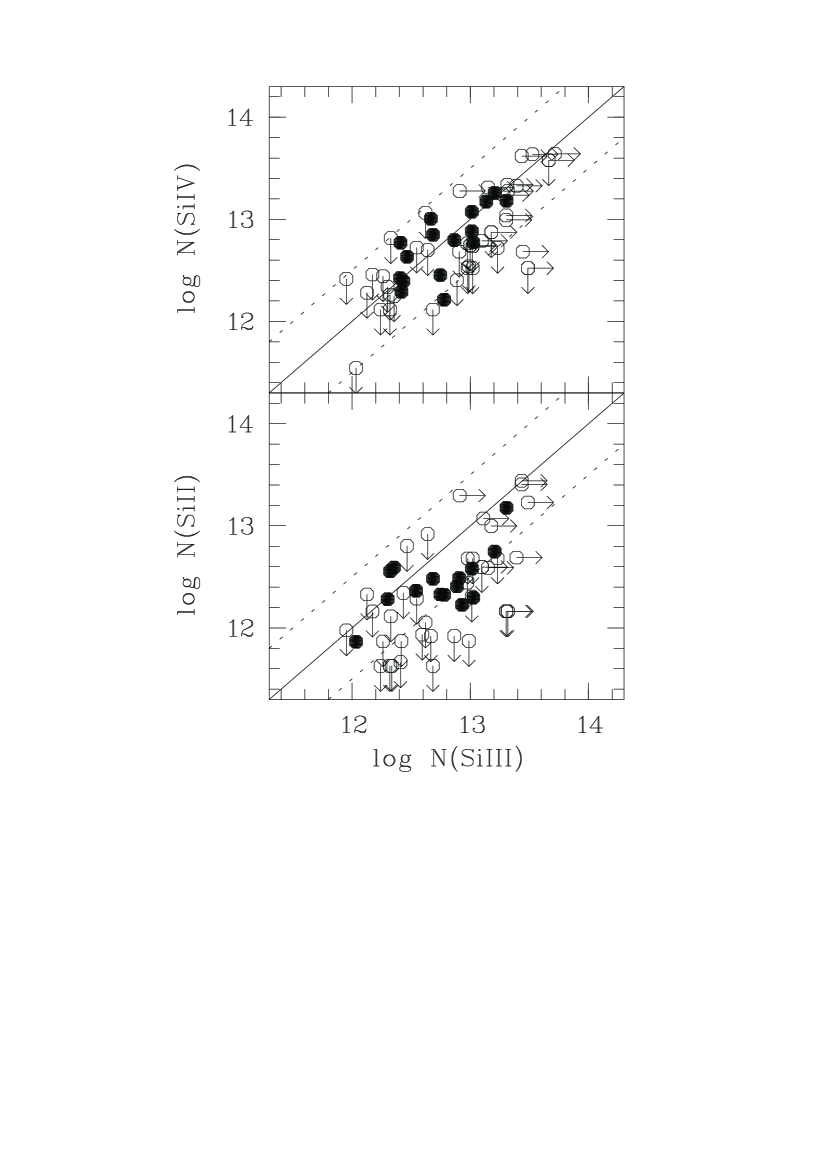
For the following we assume that Si iii absorption arises in both a diffuse ionized gas phase traced by Si iv/Si iii as well as a somewhat denser (partly neutral) gas phase traced by Si ii/Si iii. To further investigate the characteristic densities of these two phases we have plotted in Fig. 15 the column densities log (Si iii) vs. log (Si iv) (upper panel) and log (Si iii) vs. log (Si ii) (lower panel). Data points from measured column density limits in these ions are plotted with open circles. Because both gas phases defined above may be present in an absorber, the plotted values of log (Si iii) have to be regarded as an upper limit for the Si iii column in each phase.
For the absorbers that are detected simultaneously in Si iii and Si iv (upper panel of Fig. 15, filled circles) the data points scatter within dex around the (Si iii(Si iv) line. For the absorbers that are detected simultaneously in Si iii and Si ii (lower panel of Fig. 15, filled circles) the measured Si ii column densities are typically lower than that of Si iii, but (again) note that a considerable fraction of the Si iii column may arise in the Si iv phase, so that log [(Si ii)/(Si iii)] could be much higher locally.
Because of the unknown intrinsic structure of each absorber it is challenging to provide firm predictions for the gas density for each individual system that has measured Si ii/Si iii/Si iv column densities. From the exploration of the parameter space the Cloudy models deliver, however, a characteristic gas density that separates the Si iv/Si iii from the Si ii/Si iii phase in the absorbers (see also Fig. 13). We find that the Si iv/Si iii phase traces gas with densities log (in Fig. 13 indicated with the gray-shaded area), while the Si ii/Si iii phase has higher densities in the range .
7.4 Total gas mass and baryon budget
Our observations and Cloudy models imply that Si iii traces diffuse (predominantly ionized) gas in the extended gaseous halos (i.e., in the circumgalactic medium) of galaxies. An interesting question is, how much mass is contained in such gas and what is the overall baryon budget of intervening Si iii absorbers and the metal-enriched CGM. To derive the total gas mass of the Si iii systems in our sample we need to calculate the amount of ionized hydrogen in each absorber. Because of the much higher ionization fraction in the Si iv/Si iii systems compared to the Si ii/Si iii phase we here concentrate on the estimate of (H ii) in low-density Si iii absorbers that are associated with Si iv.
For the range log (H i our Cloudy model grids imply a relatively simple relation between the minimum H ii column density and the Si iii column density in each absorber:
| (6) |
where the parameter , that solely depends on the gas density, needs to be determined from the observed Si iv/Si iii ion ratios (Fig. 13). Since we do not know what fraction of the Si iii column density can be assigned to the Si iv phase, we can only place a lower limit to (see above). Similarly, because of the unknown metallicity of the CGM, we have to assume an upper limit for the silicon abundance (Si/H) in the gas. Equation (6) allows us to derive a lower limit for (H ii) in each Si iv/Si iii absorber, from which the integrated (=total) column density, (H ii, can then be determined.
The cosmological mass density of the Si iv/Si iii absorbers in terms of the current critical density, , can be estimated by
| (7) |
with , kg, km s-1 Mpc-1 (Hinshaw et al. 2013), and . The comoving path length available for the detection of Si iv/Si iii absorbers along each sightline is given by:
| (8) |
The integration over all sightlines then delivers . For our bias-corrected Si iv/Si iii absorber sample with log (Si iii we have (H ii cm-2 and . The cosmological mass density can then be written as (Si iii, where is the Si abundance in the gas relative to the solar value, log (Si/H) (Asplund et al. 2009). Thus, if the CGM traced by Si iii would have a solar Si abundance, it would contain roughly as much mass as the neutral ISM within galaxies at ((H i; Zwaan et al. 2005).
On the one hand, (Si iii could be much higher, if the mean metallicity of the gas was substantally lower than solar. This appears plausible if most of the gas originates in the IGM, e.g., as material stemming from accretion flows. Lehner et al. (2013) studied the metallicity distribution of LLS at and found two distinct populations of absorbers with mean metallicities of solar (population I) and solar (population II). They suggest that population I absorbers represent metal-poor circumgalactic gas from accretion streams, while population II systems trace metal-enriched halo material from galaxy outflows and winds. In view of these results, we assume a value of as a conservative upper limit for the metallicity of the Si iii absorbers in our survey. This value leads to (Si iii, roughly twice the value of the neutral ISM within galaxies.
Earlier theoretical and observational studies that addressed the outflow of gaseous material from galaxies and the enrichment of the IGM suggested, on the other hand, that the metals produced within galaxies escape in the form of metal-rich (super-solar, eventually) gas pockets (Mac Low & Ferrara 1999; Rauch et al. 2001; Schaye, Carswell & Kim 2007). Such gas pockets could mimic the absorption properties of intervening metal absorbers, but they would carry only very little mass. While it cannot be excluded that some of the Si iii absorbers presented in this study belong to such metal patches with above-solar metallicities, the large overall cross section of circumgalactic Si iii together with the expected cosmological metal-mass density at (e.g., Calura & Mateucci 2004) excludes that a dominating fraction of the circumgalactic Si iii absorbers have metallicites above solar.
From the above considersations we conclude that the Si iv/Si iii bearing gas phase in the CGM of low redshift galaxies contains (possibly substantially) more baryonic matter than their neutral ISM. This conclusion is supported by previous estimates of the baryon content of the cool, photoionized CGM in the local Universe from the COS-Halos survey (Werk et al. 2014).
8 Discussion
8.1 On the origin of intervening Si iii absorbers
Our study indicates a tight spatial correlation between intervening Si iii absorbers at and the local galaxy population at impact parameters kpc, suggesting that the majority of these absorption systems arise in the extended gaseous halos of these galaxies. This interpretation is supported by recent HST/STIS and HST/COS observations of Si iii absorption in the CGM of the Milky Way (Shull et al. 2009; Collins et al. 2009; Richter et al. 2009; Lehner et al. 2012; Herenz et al. 2013; Richter et al. 2016, in prep.), who show that doubly-ionized Si has the largest absorption cross section of all low, intermediate and high ions with a sky covering fraction of . While the distances and the space distribution of Si iii absorbers in the Milky Way halo still are unclear (owing to our internal vantage point), Lehner et al. (2015) demonstrated that M31 also exhibits an extended, metal-enriched gaseous halo that gives rise to Si iii absorption out to kpc. Finally, other groups that have studied the absorption properties of the CGM for individual galaxies (e.g., Keeney et al. 2013), or pre-selected galaxy samples such as the COS-Halos survey (e.g., Tumlinson et al. 2011, 2013; Werk et al. 2013; Peeples et al. 2013) demonstrate that Si iii is ubiquitous in the extended CGM of low-redshift galaxies. The existence of such discrete Si iii bearing gas complexes with temperatures K (thus below the virial temperature of their DM host halos) in the extended circumgalactic environment of galaxies can be understood in terms of the steady circulation of hot and cold gas through the CGM (”circumgalactic fountain”) as part of the ongoing galaxy evolution. In this scenario, star formation in galaxies drives out large amounts of (hot) metal-enriched gas. Even if this material leaves the potential well of an individual galaxy, it is trapped by the superordinate cosmological structure. From there, the gas may (slowly) fall back onto the galaxy of its origin in the form of discrete gas structures, as the gas never reaches hydrostatic equilibrium during such a circulation cycle (Ford et al. 2014). Alternatively, the gas may be accreted by a different galaxy nearby, or heated up to the virial temperature of the superordinate DM halo, in which case it may remain extragalactic forever.
While the observed frequency of Si iii absorbers with log (Si iii and the derived impact parameter distribution are in line with a scenario, in which all Si iii absorbers are located within the virial radius of intervening galaxies and thus are gravitationally bound to them, it cannot be excluded that there exists a population of intervening Si iii absorbers that traces gas at larger distances. This is actually expected, since in many cases large, gas-rich spiral galaxies like the Milky Way do not represent isolated systems, but are part of a galaxy group, which binds metal-enriched diffuse gas within its own virial radius in the form of an intragroup medium.
Stocke et al. (2014) recently have studied a class of ”warm” H i/O vi absorbers using COS spectra. They suggested that these systems trace an extended (Mpc scale) K intragroup medium in spiral-rich galaxy groups. If such warm gas was typical for group environments, it appears plausible that one would find cooler ( K) gas patches embedded in such a medium that could give rise to intervening Si iii/Si iv absorption. Some of the galaxy/absorber pairs that have apparent impact parameters in the range kpc may belong to such group absorbers. The Cloudy modeling predicts that Si iii/Si iv absorbers trace gas down to thermal pressures of cm-3 K. For gas that is gravitationally bound to individual galaxies, such low gas pressures would be expected only in the outermost regions of galaxies near their virial radius (see also discussion in Shull 2014). However, such a value for also would be in agreement with the expected range of gas pressures in galaxy groups (Stocke et al. 2013).
Our survey suggests that the number density distribution of Si iii absorbers breaks down for column densities log (Si iii (Fig. 4, right panel), which is not a completeness effect in our data (see Sect. 4.1). These low-column density systems may represent the prime candidates for metal-enriched cloudlets that arise in regions with low gas densities (and pressures), such as in group environments and in the IGM. As pointed out by Stocke et al. (2013), the expected number density of galaxy groups is ten times less than the space density of galaxies (Berlind et al. 2006). Interestingly, the number density of Si iii absorbers with log (Si iii is also times less than the number density of absorbers with log (Si iii, supporting a scenario in which high-column density Si iii systems trace the CGM of galaxies, while low-column density Si iii systems arise in the intragroup gas of galaxy groups.
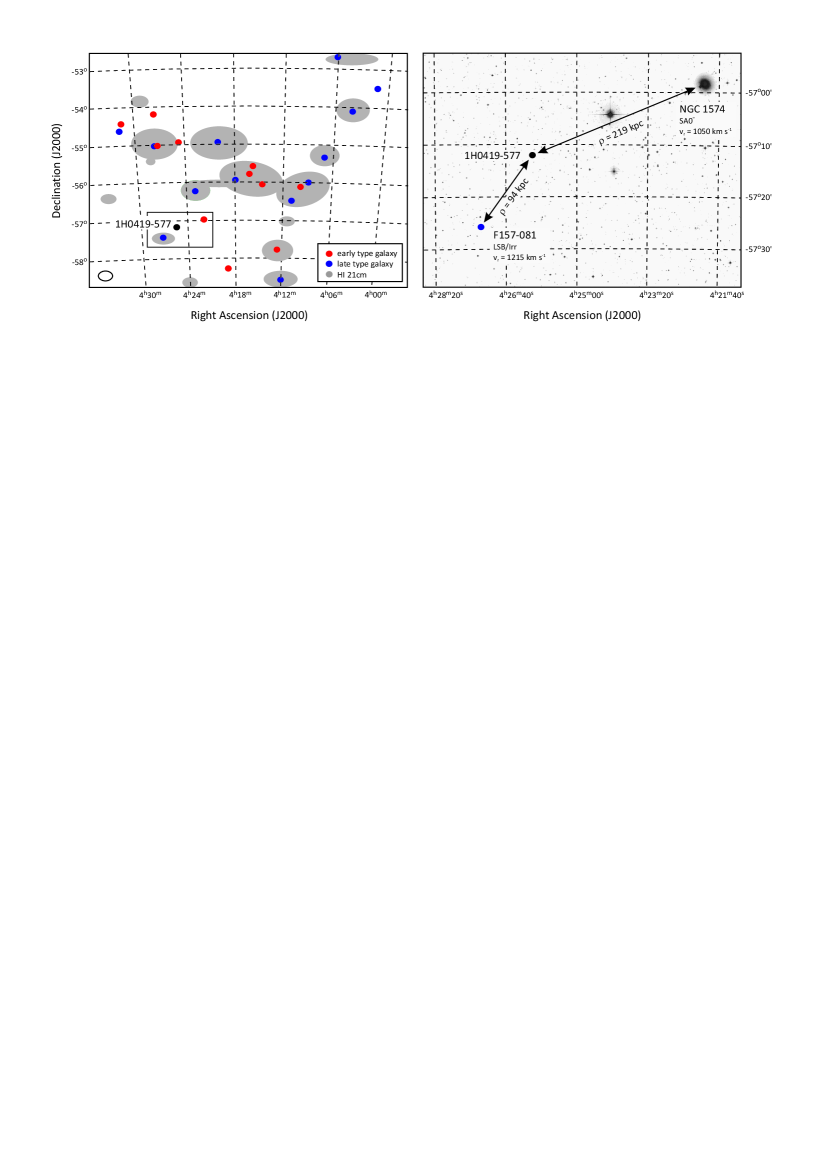
With the occurrence of several galaxies at impact parameters kpc to the QSO sightlines and with radial velocities close to the observed absorber velocities (such as expected for group environments), the interpretation of the observed absorption with respect to origin and nature of the gas in its galaxy environment generally is tricky. While a more systematic investigation between intervening Si iii absorbers and galaxy group environments clearly is beyond the scope of this paper, we show in Fig. 16 as a prominent example the galaxy group environment of the Si iii absorber towards the QSO 1H0419577 (IRAS F042505718). This sightline passes two galaxies in the Dorado galaxy group (Kilborn et al. 2005; Maia, Da Costa & Latham 1989) at impact parameters kpc. In principle, the observed Si iii absorption at km s-1 could be associated with either of these two galaxies, which have radial velocities of and km s-1 (Kilborn et al. 2005). The observed gas may be infalling or outflowing gaseous material; the metallicity of the absorber lies in the range between solar (as derived from the fit of the H i Ly absorption together with the Cloudy model of the Si iii/Si iv absorption), thus in line with both scenarios. However, the absorber could also be located outside the virial radii of these two galaxies and may belong to a faint (unseen) dwarf galaxy in the same group or may represent a metal-rich gas patch embedded in the intragroup medium of the Dorado group. The interpretation of individual absorber/galaxy pairs thus remains inconclusive with magnitude-limited galaxy data. The statistical connection between galaxies and intervening Si iii systems, as studied here, yet demonstrates that both class of objects trace the same Mpc-scale environment within the cosmic web.
8.2 Comparison with previous Si iii absorption-line studies
We are not aware of any other systematic studies in the literature that focus explicitly on Si iii-selected intervening absorption systems and their relation to galaxies. There are, however, several absorption-line surveys at low redshift (using various UV spectrographs) that provide information on the number density of Si iii and other intermediate ions (e.g., C iii) and the distribution of equivalent widths/column densities of these ions.
Tilton et al. (2012) compiled UV absorption-line data from HST/STIS and FUSE and prepared a catalog of UV absorbers for redshifts . From their data sample they derive a number density of intervening Si iii absorbers of for log (Si iii for this redshift range, based on a total redshift path of . This value is more than twice the value derived in this study. The same authors recently published another absorption-line catalog of intervening absorption systems at , this time based on HST/COS data of 75 QSOs (Danforth et al. 2016). In this new survey, the authors derive a number density of for log (Si iii and . Moreover, their study suggests an increase for (Si iii) for decreasing redshift in the local Universe (their Fig. 15). Their new value again is substantially higher than the value derived by us. To investigate the origin for this discrepancy we have carefully compared their absorber list with ours, as our COS data sample includes all of the 75 QSOs presented in Danforth et al. (2016). We suspect that the higher value for (Si iii) derived by Danforth et al. (2016) stems from the less stringent selection criteria for identifying metal absorbers and defining the relevant absorption path lengths along their sightlines. Also, a possibly existing selection bias in their QSO sample may be the reason for the higher value of (Si iii).
We identify three Si iii systems in their absorber list, whose identifications are based on absorption features that (in our opinion) most likely have different origins. We also have identified one candidate Si iii absorber that is not listed in the Danforth et al. (2016) paper. In Table A.12 in the Appendix we list these discrepant absorption systems together with a short description of the absorption characteristics.
As we discuss in one the following sections, state-of-the art hydrodynamical simulations of metal-enriched gas in the local Universe do not support values of for Si iii absorbers for log (Si iii, but favour Si iii number densities of for .
8.3 Comparison with other CGM studies
As mentioned above, Si iii is frequently detected in the CGM of individual galaxies (Keeney et al. 2013; Lehner et al. 2015) and in the CGM of pre-selected galaxy samples (e.g., COS-Halos; Tumlinson et al. 2013; Werk et al. 2013; Liang & Chen 2014). Our study, which represents a statistical rather than a targeted study of the CGM in the local Universe, complements most of the previous observational CGM studies. Many of the COS sightlines that have been used by previous, targeted CGM studies are included in our sample. Because of the statistical nature of our survey, we refrain from comparing our results for individual galaxy/absorber pairs with results from other studies.
From an archival study of CGM absorption around 195 galaxies at Liang & Chen (2014) find a mean Si iii covering fraction of within and for the range , but no significant Si iii absorption beyond. These covering fractions are lower than our estimate of . This is not surprising, however, since their study considers only strong Si iii systems with mÅ (log (Si iii), while our estimate is based on a more sensitive search including weak and strong absorbers with log (Si iii. If we adopt our measured value of (Si iii for (Si iii for our estimate of using equation (4), we obtain a value of within , thus in good agreement with the Liang & Chen (2014) estimate. Also Werk et al. (2013) consider only strong Si iii absorbers around absorbers with mÅ and find for their total galaxy with little dependence on the galaxy mass or star-formation rate (their Table 6). Within the given error bars, these estimates for (based on different methods) agree very well with each other.
In contrast, Bordoloi et al. (2014) studied the CGM around dwarf galaxies at and found no metal absorption beyond . Their study suggests that the filling factor of warm circumgalactic gas is substantially smaller for dwarfs than for galaxies. As described in Sect. 4.2, our full data set includes most of the sightlines from the Bordoloi et al. sample, so that we can analyze the Si iii absorption fraction in the CGM of these dwarf galaxies directly. We find that only 17 out of the according 40 sightlines show detectable Si iii with log (Si iii at the redshifts of the dwarf galaxies (), demonstrating that the absorption fraction of the warm CGM traced by Si iii around dwarf galaxies is only percent of that seen in galaxies with higher luminosities. The small CGM absorption fraction around dwarf galaxies is the reason for the almost identical number densities of intervening Si iii in our original data sample and in the bias-corrected sample (Sect. 2.4).
Turning to high-ionization species, Wakker & Savage (2009) have studied the relation between O vi and nearby galaxies at based on UV and FUV data along 76 extragalactic sightlines, demonstrating that a substantial fraction of the O vi systems arise from gas within of these galaxies (see also Prochaska et al. 2011; Tumlinson et al. 2011; Stocke et al. 2013). However, in contrast to Si iii, O vi is also present beyond the virial radius of these galaxies, tracing hot metal-enriched gas (at higher gas temperatures and lower densities than Si iii) that presumably has been ejected by galactic winds and outflows in past epochs of active star formation. In fact, in view of our CGM modeling results presented in Sect. 5, the measured O vi number density at low redshifts of (O vi (Tripp et al. 2008) indicates a very large absorption cross section of O vi that is clearly beyond the expected cross section of the CGM in the local Universe, even if non-standard Schechter parameters in the luminosity function are considered (Table 1, fourth row). The Milky Way possibly also contains a massive, extended O vi envelope that reaches deep into the Local Group potential well (Sembach et al. 2003 and Wakker et al. 2003).
Interestingly, the detailed analysis of the COS-Halos sample suggests that the absorption properties of low and intermediate ions (such as Si iii) in star-forming galaxies does not significantly differ from those in passive galaxies, while O vi predominantly arises in the halo of active galaxies (Thom et al. 2012; Werk et al. 2013; Tumlinson et al. 2011). From their study, Liang & Chen (2014) conclude that the CGM becomes progressively more ionized from small to large radii. A similar conclusion was drawn by us from modeling the radial decline of the neutral gas fraction in the CGM in the Local Group (Richter 2012).
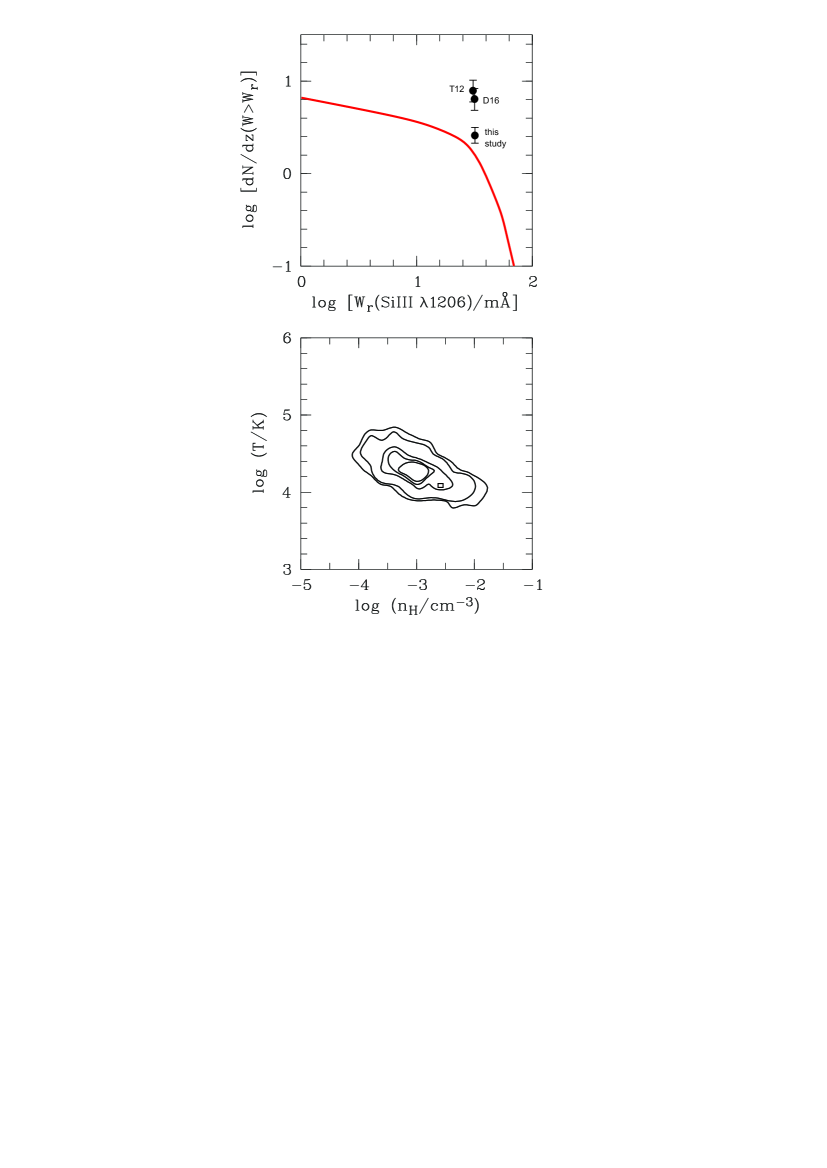
8.4 Comparison with hydrodynamical simulations
Cosmological, hydrodynamical simulations have recently become a powerful tool for studying intergalactic and circumgalactic gas at low and high redshifts (e.g., Oppenheimer & Davé 2006; Crain et al. 2013; Nuza et al. 2014). The line statistics from synthetic absorption spectra generated from such simulations can be directly compared to QSO absorption-line studies to investigate the different gas phases in the IGM and CGM and their redshift evolution (Fang & Bryan 2001; Richter et al. 2006; Fangano, Ferrara & Richter 2007; Tepper-García et al. 2011; 2012; 2013; Oppenheimer et al. 2012; Smith et al. 2011; Churchill et al. 2015).
While most of these studies have focused on the properties of high-ion absorbers, such as O vi and Ne viii, to study the shock-heated warm-hot intergalactic medium or shock-heated gas in the CGM, intermediate ions such as Si iii and C iii so far have not been considered for a detailed comparison study of absorption-line statistics in simulations and observational data. From the simulations of Smith et al. (2011), Danforth et al. (2016) extracted the cumulative line density of intervening metal absorbers for a comparison with their COS absorption-line survey. While their own value for (Si iii) of for log (Si iii (see Sect. 8.2) lies far above the value predicted by Smith et al. for this column-density limit ((Si iii), the Si iii number density derived by us is in very good agreement with the results by Smith et al.
We here re-use synthetic spectra generated along random LOS from a simulation run (Model AGN) of the OverWhelmingly Large Simulations (OWLS; Schaye et al. 2010) to further investigate the frequency and physical conditions in Si iii absorbers at low redshift (). Similar simulations have been used by us previously to study absorption signatures of warm-hot gas in the local Universe (Tepper-García et al. 2011, 2012, 2013). The OWLS simulations were set up using the smoothed particle hydrodynamics (SPH) code GADGET III (a modified version of GADGET II; Springel 2005) and were carried in a cubic box of comoving Mpc on a side, containing 5123 dark matter (DM) and 5123 baryonic particles. The initial mass resolution is (DM) and (baryonic), while the gravitational softening is set to comoving kpc and is fixed at proper kpc below . The cosmological simulations from the OWLS project are characterized by a particularly careful implementation of important physical processes that have been largely ignored in earlier studies (e.g., the influence of the photoionization on the cooling function of the gas). Details on the sub-grid physics used in OWLS can be found in Wiersma et al. (2009a; radiative cooling), Schaye & Dalla Vecchia (2008; star formation), Dalla Vecchia & Schaye (2008; stellar feedback), and Booth & Schaye (2009; AGN feedback). The strategy, how the synthetic absorption-line spectra from OWLS were set up and analyzed is presented in Tepper-García et al. (2011,2012,2013). In Fig. 17, upper panel, we show the cumulative number density of intervening Si iii absorbers as a function of the limiting equivalent width predicted by OWLS (Model AGN). The redshift in the simulation run is higher than the maximum redshift of our data. This is, however, not an issue since we do not expect the gas producing the observed absorption to evolve strongly from to . The measured value from this study and from Tilton et al. (2012; T12) and Danforth et al. (2016; D16) are indicated with filled circles. The predicted number density is for log (Si iii (log [/mÅ, thus only slightly below the observed value of from our COS data set.
It is worth noting that differences between the predicted and observed line-number densities may be alleviated considering that the stellar yields used in the simulations to model the chemical evolution of the gas are uncertain by factors of a few (see Wiersma et al. 2009b). Thus, some modification of the abundances in post-processing would be justified, which would bring the predicted into better agreement with our measured value. However, we refrain from doing so because this could break the self-consistency of the simulation if it were to change the cooling rates significantly.
In the lower panel of Fig. 17 we show the phase-space distribution in the temperature-density plane of the Si iii-absorbing gas in the AGN run at from OWLS. The typical Si iii absorber in the simulation has a temperature of K and a density of cm-3, in very good agreement with the values estimated with Cloudy from the Si ii/Si iii/Si iv column-density ratios in our COS absorber sample. The resulting range for the expected thermal gas pressure is cm-3 K, thus in a range that is typical for the CGM (Cen 2013).
In conclusion, the AGN model from OWLS and the simulations from Smith et al. (2011) predict absorber properties that are compatible with our observations and in line with the idea, that the majority of the Si iii absorbers at arise in the extended halos of low-redshift galaxies. For the future, we are planning to further explore the relation between intermediate-ion absorbers and galaxies at low using higher-resolution simulations from the EAGLE (Evolution and Assembly of GaLaxies and their Environments) project (Schaye et al. 2015).
9 Summary and Conclusions
In this paper, we present a systematic study of intervening
Si iii absorbers and their relation to galaxies
in the redshift range along 303 QSO sightlines
using archival UV spectra obtained with HST/COS.
The main results are summarized as follows:
(1) We detect 69 intervening Si iii absorbers in the range
along a total
redshift path of . The restframe equivalent widths in the
Si iii line lie in the range mÅ,
corresponding to Si iii column densities log (S iii.
We derive a bias-corrected number density of intervening Si iii systems
of for absorbers with log (Si iii,
suggesting that Si iii-selected absorbers outnumber strong
Mg ii at by a factor of . Weak absorbers in the range
log (Si iii turn out to be rare ();
they possibly represent an absorber population that is distinct from the one with
larger Si iii column densities.
(2) The observed Si iii absorption is typically accompanied by absorption
from other low and/or high ions. The positive correlations between
the equivalent widths of Si iii and Si iv and between
Si iii and Si ii indicates that doubly ionized silicon
traces gas in a range of physical conditions. This
conclusion is supported by Cloudy ionization models of the
absorbers, which indicate that Si iii arises either in diffuse, ionized
low-density (log , typically) gas that is also observed in
Si iv absorption, or in somewhat denser (log , typically),
more neutral environments that are also traced by Si ii.
(3) We geometrically model the absorption cross section of diffuse gas within the
virial radii () of galaxies at for galaxies in the luminosity
range using the SDSS galaxy luminosity function for
and scaling relations between and .
Our modeling implies that circumgalactic gas within the virial radius of
galaxies contributes with to the total number density
of intervening absorbers, even if a unity covering fraction
of the absorbing gas is assumed. If we adopt the SDSS -band luminosity
function as reference (Montero-Dortas et al. 2009), we obtain
as expected number density for CGM absorbers from galaxies.
In light of this result, the measured value
of (Si iii is in line with the idea, that the
majority of the intervening Si iii absorbers with
log (Si iii at trace the
circumgalactic medium at of nearby galaxies with an
average covering fraction of ,
a value that is in excellent agreement with results from other
studies (Liang & Chen 2014; Werk et al. 2013).
Our model further predicts that intervening metal absorbers with
number densities (e.g., O vi absorbers)
must partially arise from gas outside of the virial radius of galaxies.
(4) We compare the Si iii absorber redshifts and positions with that of
galaxies at using archival galaxy-survey data.
For percent of the absorbers we find possible host galaxies
with
within km s-1 of the absorbers and at impact parameters
kpc, indicating that the spatial distributions of
Si iii absorbers and galaxies are highly correlated. We verify
the significance of this result by studying the distribution of galaxies
around the same sightlines in velocity ranges without Si iii absorption
and find no clustering of the galaxies, as expected.
The observed Si iii absorption fraction around the galaxies scales
differently with impact parameter than predicted by our model. We assign
this behavior to the incompleteness in our galaxy sample to identify
faint galaxies that are associated with Si iii
absorbers.
(5) We estimate the baryon content of the Si iii-absorbing gas phase
in the CGM at low using Cloudy ionization models. Assuming that
the metallicity of the gas is solar, the cosmological mass density
of the gas in Si iii absorbers is
(Si iii.
This lower limit is roughly twice the value derived for the H i mass
density at , indicating that the diffuse CGM around galaxies, as traced by
doubly-ionized Si, contains substantially more baryonic matter than
their neutral ISM.
(6) We discuss the origin of intervening Si iii absorption in the CGM of galaxies
and in galaxy groups and compare our results with previous absorption-line
catalogs and CGM studies at low redshift. We suggest that the majority of
the strong Si iii absorbers with log (Si iii
typically arise within the extended halos of galaxies within ,
while weak systems with log (Si iii possibly also
trace gas at larger distances (e.g., group environments or the IGM).
The comparison of our measurements with predictions from
cosmological hydrodynamical simulations from the OWLS project and other simulations
shows a fair agreement for the absorber number density and the estimated
temperature-density range of intervening Si iii absorbers.
Acknowledgements.
This research used the facilities of the Canadian Astronomy Data Centre operated by the National Research Council of Canada with the support of the Canadian Space Agency. This research also has made use of the SIMBAD database, operated at CDS, Strasbourg, France. We thank Joop Schaye and an anonymous referee for helpful comments and suggestions.References
Anderson, M.E., & Bregman, J.N. 2011, ApJ, 737, 22
Asplund, M., Grevesse, N., Sauval, A.J., & Scott, P. 2009, ARA&A, 47, 481
Berlind, A.A., Frieman, J., Weinberg, D.H. 2006, ApJS, 167, 2006, ApJS 167, 1
Birnboim, Y.& Dekel, A. 2003, MNRAS, 345, 349
Bogdán, Á, Forman, W.R., Kraft, R.P., & Jones, C. 2013, ApJ, 772, 98
Burchett, J.N., Tripp, T.M., Werk, J.K., et al. 2015, ApJ, 815, 91
Calura, F. & Mateucci, F. 2004, MNRAS, 350, 351
Cen, R. 2013, ApJ, 770, 139
Churchill, C.W., Van der Vliet, J.R., Trujillo-Gomez, S., Kacprzak, G.G., & Klypin, A. 2015, ApJ, 802, 10
Collins, J.A., Shull, J.M., & Giroux, M.L. 2009, ApJ, 705, 962
Crain, R.A., McCarthy, I.G., Schaye, J., Theuns, T., & Frenk, C.S. 2013, MNRAS, 432, 3005
Dai, X., Anderson, M.E., Bregman, J.N., & Miller, J.M. 2012, ApJ, 755, 107
Danforth, C.W., Tilton, E.M., Shull, J.M. et al. 2016, ApJ, 817, 111
Debes, J., et al. 2016, Cosmic Origins Spectrograph Instrument Handbook,
Version 8.0 (Baltimore, MD: STScI)
Fang, T., & Bryan, G.L. 2001, ApJ, 561, 31
Fangano, A.P.M., Ferrara, A., & Richter, P. 2007, MNRAS, 381, 469
Ferland, G.J., Korista, K.T., Verner, D.A., Fergueson, J.W.,
Kingdon, J.B., & Verner, E.M. 1998, PASP, 110, 761
Fontana, A., & Ballester, P. 1995, ESO Messenger, 80, 37
Ford, A. B., Davé, R., Oppenheimer, B. D., et al. 2014, MNRAS, 444, 1260
Fox, A.J., Wakker, B.P.; Savage, B.D., et al. 2005, ApJ, 630, 332
Fox, A.J., Savage, B.D., & Wakker, B.P. 2006, ApJS, 165, 229
Fox, A.J., Wakker, B.P., Smoker, J.V., et al. 2010, ApJ, 718, 1046
Green, J.C., Froning, C.S., Osterman, S., et al. 2012, ApJ, 744, 60
Haardt, F., & Madau, P. 2012, ApJ, 746, 125
Herenz, P., Richter, P., Charlton, J.C., & Masiero, J.R. 2013, A&A, 550, A87
Hinshaw, G., Larson, D., Komatsu, E., et al. 2013, ApJS, 208, 19
Kacprzak, G.G., Churchill, C.W., Steidel, C.C., & Murphy, M.T. 2008, ApJ, 135, 922
Kalberla, P.M.W., Burton, W.B., Hartmann, D., et al. 2005, A&A, 440, 775
Keeney, B.A., Stocke, J.T., Rosenberg, J.L., et al. 2013, ApJ, 765, 27
Kere, D., Katz, N., Weinberg, D.H., & Davé, R. 2005, MNRAS, 363, 2
Kilborn, V.A., Koribalski, B., Forbes, D.A., Barnes,D.G., & Musgrave, R.C. 2005, MNRAS, 356, 77
Lehner, N., Howk, J.C., Thom, C., et al. 2012, MNRAS, 424, 2896
Lehner, N., Howk, J.C., Tripp, T.M., et al. 2013, ApJ, 770, 138
Lehner, N., Howk, J.C., & Wakker, B.P. 2015, ApJ, 804, 79
Liang, C.J., & Chen, H.-W. 2014, MNRAS, 445, 2061
Lundgren, B.F., Brunner, R.J., York, D.G., et al. 2009, ApJ, 698, 819
Mac Low, M.M., & Ferrara, A. 1999, ApJ, 513, 142
Maia, M.A.G., Da Costa, L.N., & Latham, D.W. 1989, ApJS, 69, 809
Maller, A.H., & Bullock, J.S. 2004, MNRAS, 355, 694
Mo, H.J., & Miralda-Escude, J. 1996, ApJ, 469, 589
Montero-Dorta, A.D., & Prada, F. 2009, 399, 1106
Morton, D.C. 2003, ApJS, 149, 205
Moster, B.P., Somerville, R.S., Maulbetsch, C., et al. 2010, ApJ, 710, 903
Nestor, D.B., Turnshek, D.A., & Rao 2005, ApJ, 628, 637
Nielsen, N.M., Churchill, C.W., & Kacprzak, G.G. 2013, ApJ, 776, 115
Nuza, S.E., Parisi, F., & Scannapieco, C.2014, MNRAS, 441, 2593
Oppenheimer, B., & Davé, R. 2006, MNRAS, 373, 1265
Oppenheimer, B., Davé, R., Katz, N., Kollmeier, J.A., & Weinberg, D.H. 2012, MNRAS, 420, 829
Peacock, J.A., & Smith, R.E. 2000, MNRAS, 318, 1144
Peeples, M.S., Werk, J.K., Tumlinson, J., et al. 2014, ApJ, 786, 54
Planck; Fermi Collaborations, et al. 2015, arXiv: 1502.01589
Prochaska, J.X., Weiner, B., Chen, H.-W., Mulchaey, J., & Cooksey, K.
2011, ApJ, 740, 91
Prochter, G.E., Prochaska, J.X., Chen, H.-W., et al. 2006, ApJ, 639, 766
Putman, M.E., Peek, J.E.G., & Joung, M.R. 2012, ARA&A, 50, 491
Rauch, M., Sargent, W.L.W., Barlow, T.A., & Carswell, R.F. 2001, ApJ, 562, 76
Rees, M.J., Ostriker, J.P., 1977, MNRAS, 179, 541
Richter, P., Savage, B.D., Wakker, B.P., Sembach, K.R., Kalberla, P.M.W.
2001, ApJ, 549, 281
Richter, P., Fang, T., & Bryan, G. L. 2006, A&A, 451, 767
Richter, P. 2006, Reviews in Modern Astronomy 19, 31
Richter, P., Charlton, J.C., Fangano, A.P.M., Ben Bekhti, N.,
& Masiero, J.R. 2009, ApJ, 695, 1631
Richter, P., Krause, F., Fechner, C., Charlton, J.C.,
& Murphy, M.T. 2011, A&A, 528, A12
Savage, B.D., & Sembach, K.R. 1991, ApJ, 379, 245
Schaye, J. Carswell, R.F., & Kim, T.-S. 2007, MNRAS, 379, 1169
Schaye, J., Dalla Vecchia, C., Booth, C.M., et al. 2010, MNRAS, 402, 1536
Schaye, J., Crain, R.A., Bower, R.G., et al. 2015, MNRAS, 446, 521
Schechter, P. 1976, ApJ, 203, 297
Sembach, K.R., Wakker, B.P., Savage, B.D., Richter, P. et al. 2003, ApJS, 146, 165
Shull, J.M., Jones, J.R., Danforth, C.W., & Collins, J.A. 2009, 699, 754
Shull, J.M. 2014, ApJ, 784, 142
Smith, B.D., Hallman, E.J., Shull, J.M., O’Shea, B.W. 2011, ApJ, 731, 6
Stocke, J.T., Keeney, B.A., Danforth, C.W., et al. 2013, ApJ, 763, 148
Stocke, J.T., Keeney, B.A., Danforth, C.W., et al. 2014, ApJ, 791, 128
Tepper-García, T., Richter, P., Schaye, J., et al. 2011, MNRAS, 413, 190
Tepper-García, T., Richter, P., Schaye, J., et al. 2012, MNRAS, 425, 1640
Tepper-García, T., Richter, P., Schaye, J., et al. 2013, MNRAS, 436, 2063
Thom, C., Tumlinson, J.,Werk, J., Prochaska, J.X., & Tripp, T. 2012, ApJ, 758, 41
Tilton, E.M., Danforth, C.W., Shull, J.M., & Ross, T.L. 2012, ApJ, 759, 112
Tripp, T.M., Wakker, B.P., Jenkins, E.B., et al. 2003, AJ, 125, 3122
Tripp, T.M., Sembach, K.R., Bowen, D.V., et al. 2008, ApJS, 177, 39
Tumlinson, J., Shull, J.M., Rachford, B.L., et al. 2002, ApJ, 566, 857
Tumlinson, J., Thom, C., Werk, J.K., et al. 2011, Sci, 334, 948
Tumlinson, J., Thom, C., Werk, J.K., et al. 2013, ApJ, 777, 59
van de Voort, F., Schaye, J., Booth, C.M., & Dalla Vecchia, C. 2011, MNRAS, 414, 2458
Wakker, B.P. & van Woerden, H. 1998, ARA&A, 35, 217
Wakker, B.P., Howk, J.C., Savage, B.D. 1999, Nature, 402, 388
Wakker, B.P. 2001, ApJS, 136, 463
Wakker, B.P., & Savage, B.D. 2009, ApJS, 182, 378
Werk, J.K., Prochaska, J.X., Thom, C., et al. 2013, ApJS, 204, 17
Werk, J.K., Prochaska, J.X., Tumlinson, J., et al. 2014, ApJ, 792, 8
White, S.D.M. & Rees, M.J. 1978, MNRAS, 183, 341
Wiersma, R.P.C., Schaye, J., & Smith, B.D. 2009a, MNRAS, 393, 99
Wiersma, R.P.C., Schaye, J., Theuns, T., Dalla Vecchia, C., & Tornatore, L. 2009b, MNRAS, 399, 574
Zwaan, M.A., van der Hulst, J.M., Briggs, F.H., Verheijen, M.A.W., &
Ryan-Weber, E.V. 2005, MNRAS, 364, 1467
Zhu,G. & M’enard, B. 2013, ApJ, 770, 130
Appendix A Supplementrary Tables and Figures
[Note: all velocity plots are available in the full version at http://tucana.astro.physik.uni-potsdam.de/ prichter/si3cgm.pdf.]
| No. | QSO (COS name) | QSO (NED name) | ||||
|---|---|---|---|---|---|---|
| 1 | 1ES1028+511 | 2MASX J10311847+5053358 | 157.83 | 50.89 | 0.360 | 0.095 |
| 2 | 1ES1553+113 | [HB89] 1553+113 | 238.93 | 11.19 | 0.360 | 0.098 |
| 3 | 1H-2129-624 | 2MASX J21362313-6224008 | 324.10 | -62.40 | 0.059 | 0.041 |
| 4 | 1SAXJ1032.3+5051 | 2MASSi J1032161+505120 | 158.07 | 50.86 | 0.173 | 0.098 |
| 5 | 2DFGRSS393Z082 | GALEXASC J024500.80-300722.3 | 41.25 | -30.12 | 0.339 | 0.098 |
| 6 | 2DFGRSS394Z150a | GALEXASC J024613.27-302942.2 | 41.56 | -30.50 | 0.131 | 0.075 |
| 7 | 2E-1058.1+1102 | [HB89] 1058+110 | 165.20 | 10.77 | 0.423 | 0.098 |
| 8 | 2MASS-J09311671+2628474 | SDSS J093116.70+262847.4 | 142.82 | 26.48 | 0.781 | 0.088 |
| 9 | 2MASS-J09512393+3542490 | 2MASSi J0951239+354248 | 147.85 | 35.71 | 0.399 | 0 |
| 10 | 2MASS-J09591486+3203573 | SDSS J095914.84+320357.2 | 149.81 | 32.07 | 0.565 | 0.098 |
| 11 | 2MASS-J10131797+0500342 | SDSS J101317.98+050034.0 | 153.32 | 5.01 | 0.266 | 0.096 |
| 12 | 2MASS-J10512569+1247462 | SDSS J105125.72+124746.3 | 162.86 | 12.80 | 1.283 | 0.048 |
| 13 | 2MASS-J11321056+1335091 | SDSS J113210.55+133509.2 | 173.04 | 13.59 | 0.201 | 0.098 |
| 14 | 2MASS-J13250381+2717189 | SDSS J132503.79+271718.7 | 201.27 | 27.29 | 0.522 | 0.085 |
| 15 | 2MASS-J13482237+2456498 | SDSS J134822.31+245650.1 | 207.09 | 24.95 | 0.293 | 0.098 |
| 16 | 2MASS-J14042827+3353426 | SDSS J140428.28+335342.6 | 211.12 | 33.90 | 0.550 | 0.093 |
| 17 | 2MASS-J14294076+0321257 | SDSS J142940.73+032125.8 | 217.42 | 3.36 | 0.253 | 0.098 |
| 18 | 2MASS-J14312586+2442203 | FBQS J143125.8+244220 | 217.86 | 24.71 | 0.407 | 0.098 |
| 19 | 2MASS-J15412146+2817063 | SDSS J154121.48+281706.3 | 235.34 | 28.29 | 0.375 | 0.095 |
| 20 | 2MASX-J01013113+4229356 | 2MASX J01013113+4229356 | 15.38 | 42.49 | 0.190 | 0.088 |
| 21 | 2MASX-J15442722+2743237 | 2MASX J15442722+2743237 | 236.11 | 27.72 | 0.163 | 0.094 |
| 22 | 3C066A | 3C 066A | 35.67 | 43.04 | 0.444 | 0.098 |
| 23 | 3C263 | 3C 263 | 174.99 | 65.80 | 0.646 | 0.098 |
| 24 | 3C273 | 3C 273 | 187.28 | 2.05 | 0.158 | 0.098 |
| 25 | 3C57 | 3C 057 | 30.49 | -11.54 | 0.671 | 0.095 |
| 26 | 4C–01.61 | [HB89] 2349-014 | 357.98 | -1.15 | 0.174 | 0.098 |
| 27 | 4C-13.41 | PG 1004+130 | 151.86 | 12.82 | 0.241 | 0.098 |
| 28 | 4C63.22 | 4C +63.22 | 230.94 | 63.66 | 0.204 | 0.098 |
| 29 | 87GB-142519.5+264555 | [HB89] 1425+267 | 216.90 | 26.54 | 0.364 | 0.085 |
| 30 | AKN-564 | UGC 12163 | 340.66 | 29.73 | 0.025 | 0.006 |
| 31 | B0117-2837 | 2MASSi J0119356-282131 | 19.90 | -28.36 | 0.349 | 0.095 |
| 32 | BZBJ1001+2911 | 2MASS J10011021+2911376 | 150.29 | 29.19 | 0.558 | 0.095 |
| 33 | CAL-F-COPY | 2MASX J05030396-6633456 | 75.77 | -66.56 | 0.064 | 0.046 |
| 34 | CSO712 | SBS 1459+554 | 225.13 | 55.29 | 0.405 | 0.097 |
| 35 | ESO-031–G-008 | ESO 031- G 008 | 46.90 | -72.83 | 0.028 | 0.008 |
| 36 | ESO-141-55 | ESO 141- G 055 | 290.31 | -58.67 | 0.037 | 0.019 |
| 37 | ESO267-013 | ESO 267- G 013 | 181.22 | -43.73 | 0.015 | 0 |
| 38 | FBQS-0751+2919 | FBQS J0751+2919 | 117.80 | 29.33 | 0.916 | 0.098 |
| 39 | FBQSJ1010+3003 | FBQS J1010+3003 | 152.50 | 30.06 | 0.256 | 0.098 |
| 40 | FBS1526+659 | SDSS J152728.65+654810.4 | 231.87 | 65.80 | 0.345 | 0.098 |
| 41 | FIRST-J020930.7-043826 | FBQS J0209-0438 | 32.38 | -4.64 | 1.128 | 0.052 |
| 42 | H1821+643 | [HB89] 1821+643 | 275.49 | 64.34 | 0.297 | 0.098 |
| 43 | HB89-0107-025-NED05 | [HB89] 0107-025 NED05 | 17.57 | -2.31 | 0.956 | 0.098 |
| 44 | HB89-0202-765 | [HB89] 0202-765 | 30.56 | -76.33 | 0.389 | 0.098 |
| 45 | HB89-0232-042 | [HB89] 0232-042 | 38.78 | -4.03 | 1.437 | 0.090 |
| 46 | HE0056-3622 | [HB89] 0056-363 | 14.66 | -36.10 | 0.164 | 0.088 |
| 47 | HE0153-4520 | 6dF J0155132-450612 | 28.81 | -45.10 | 0.451 | 0.098 |
| 48 | HE0226-4110 | IRAS 02262-4110 | 37.06 | -40.95 | 0.493 | 0.095 |
| 49 | HE0238-1904 | 2MASSi J0240325-185151 | 40.14 | -18.86 | 0.631 | 0.098 |
| 50 | HE0435-5304 | HE 0435-5304 | 69.21 | -52.98 | 1.231 | 0.098 |
| 51 | HE0439-5254 | HE 0439-5254 | 70.05 | -52.81 | 1.053 | 0.095 |
| 52 | HE1159-1338 | CTS 0308 | 180.49 | -13.92 | 0.506 | 0.098 |
| 53 | HE2347-4342 | CTS 0498 | 357.64 | -43.43 | 2.885 | 0.095 |
| 54 | HS-0033+4300 | HS 0033+4300 | 9.10 | 43.28 | 0.120 | 0.088 |
| 55 | HS1102+3441 | TON 1329 | 166.42 | 34.43 | 0.508 | 0.098 |
| 56 | HS1831+5338 | HS 1831+5338 | 278.21 | 53.67 | 0.039 | 0.020 |
| 57 | IO-AND | IO And | 12.08 | 39.69 | 0.134 | 0.093 |
| 58 | IRAS-F04250-5718 | IRAS F04250-5718 | 66.50 | -57.20 | 0.104 | 0.086 |
| 59 | IRAS-F22456-5125 | 2MASX J22484165-5109338 | 342.17 | -51.16 | 0.100 | 0.082 |
| 60 | IRAS-L06229-6434 | 2MASX J06230765-6436211 | 95.78 | -64.61 | 0.129 | 0.088 |
| 61 | IRAS01003-2238 | IRAS 01003-2238 | 15.71 | -22.37 | 0.118 | 0.093 |
| 62 | IRAS08339+6517 | 2MASX J08382309+6507160 | 129.60 | 65.12 | 0.019 | 0.001 |
| 63 | IRAS10257-4339 | NGC 3256 | 156.96 | -43.90 | 0.009 | 0 |
| 64 | IRAS11598-0112 | 2MASX J12022678-0129155 | 180.61 | -1.49 | 0.151 | 0.093 |
| 65 | IRAS16104+5235 | NGC 6090 | 242.92 | 52.46 | 0.029 | 0 |
| 66 | IRAS23133-4251 | NGC 7552 | 349.05 | -42.58 | 0.005 | 0 |
| 67 | IZW18-OBJECT-1 | UGCA 166 | 143.51 | 55.24 | 0.003 | 0 |
| 68 | J102548.47+362258.4 | SDSS J102548.38+362258.4 | 156.45 | 36.38 | 0.126 | 0.088 |
| 69 | J111244.15+550347.1 | SDSS J111244.05+550347.0 | 168.18 | 55.06 | 0.132 | 0.076 |
| 70 | J141612.96+122340.5 | SDSS J141612.87+122340.4 | 214.05 | 12.39 | 0.123 | 0.074 |
| 71 | J142947.03+064334.9 | SDSS J142947.00+064334.9 | 217.45 | 6.73 | 0.174 | 0.085 |
| 72 | KISSR1578 | MRK 0259 | 202.18 | 43.93 | 0.028 | 0.010 |
| 73 | KISSR242 | TON 0151 | 199.02 | 29.38 | 0.038 | 0.017 |
| 74 | LBQS-0107-0235 | LBQS 0107-0235 | 17.55 | -2.33 | 0.957 | 0.098 |
| 75 | LBQS-1435-0134 | LBQS 1435-0134 | 219.45 | -1.79 | 1.311 | 0.096 |
| 76 | MARK509 | MRK 0509 | 311.04 | -10.72 | 0.034 | 0.011 |
a Spectrum shows no QSO characteristics; possibly wrong source (white dwarf) observed; not considered in study.
a Used transitions: H i , Si ii , Si iii , Si iv , C ii , and C iv .
a detected only in Si iii and H i Ly , but not confirmed in other metal lines.
| QSO (COS name) | Comment | |
| Danforth detections without Richter counterpart | ||
| 3C57 | 0.077417 | many line blends |
| 3C57 | 0.089742 | candidate metal lines are offset from Ly |
| MR2251-178 | 0.010725 | candidate metal lines are offset from Ly |
| RXJ1230.8+0115 | 0.071728 | no evidence for metal absorption |
| Richter candidate system without Danforth counterpart | ||
| RXJ0439.6-5311 | 0.057400 | possible Si iii absorber present, but blend with intrinsic Ly |