Long-slit spectral observations and stellar mass-to-light ratio of spiral galaxy UGC11919
Abstract
We performed the long-slit observations of spiral galaxy UGC11919 with the Russian 6-m telescope to study its kinematics and stellar population. The previous studies gave basis to suspect that this galaxy possesses a peculiarly low mass-to-light ratio of stellar population which could indicate the presence of bottom-light stellar initial mass function (IMF). The ratio estimated for different evolutionary models of stellar population using both the broad-band magnitudes and the detailed spectral data confirms this peculiarity if the disc inclination angle , as it was obtained earlier from the optical photometry, in a good agreement with the Hi data cube modelling. However the re-processing of Hi data cube we carried out showed that it is compatible with much lower value corresponding to the ”normal” ratio , which does not need any peculiar stellar IMF. Stellar velocity dispersion measured at one disc radial scalelength from the center also better agrees with the low disc inclination. However in this case we should admit that the disc possesses a non-axisymmetric shape even after taking into account a two-armed spiral structure.
The derived stellar kinematic profiles reveal a signature of kinematically decoupled nuclear disc in the galaxy. Using different evolution models of stellar population we estimated the stellar metallicity [Z/H] (-0.4, -0.5 and -0.3 dex) and the mean luminosity-weighted (for the luminosity in the spectral range Å) stellar age (4.2, 2.6 and 2.3 Gyr) for the bulge, disc and nuclear disc of this galaxy respectively.
keywords:
galaxies: kinematics and dynamics, galaxies: individual: UGC 11919, galaxies: evolution, galaxies: spiral1 Introduction
One of the key problem of formation and evolution of galaxies is the stellar initial mass function (IMF). At the present time the question of the universality of IMF still remains open (see f.e. the discussion in Kroupa 2002; Gilmore 2001; Bastian et al. 2010; Gunawardhana et al. 2011).
It cannot be excluded that in some discy galaxies IMF may differ significantly from that usually accepted as ”typical” or ”normal” IMF observed in our Galaxy or in the neighbor galaxies. In the current article, we define as the ”normal” IMF the scaled Salpeter (Salpeter 1955, Bell & de Jong 2001) or Kroupa (Kroupa 2001) IMFs which we used in the spectral fitting.
In Saburova et al. (2009) we attempted to identify galaxies with presumably non-typical IMF by choosing the objects where the rough estimate of the dynamical mass-to-light ratios , where is the velocity of rotation and is the optical radius, strongly disagrees with ratios of stellar populations found from the color indices. The most interesting cases are where galaxies possess a dynamical mass that is too low for their luminosity and color, because the presence of a dark halo in these galaxies may only increase the discrepancy between the dynamic and photometric mass estimates. In many cases this discrepancy is the result of errors, connected mostly with the estimation of dynamical masses, hence every case should be verified using the additional data. It is not surprising that the analysis of measurement errors has significantly reduced the final list of potential candidates for galaxies with peculiar mass-to-luminosity ratios. In Saburova et al. (2013) (hereafter Paper I) we performed a detailed study of two objects from this list. It was concluded that for one of them – UGC11919 – the peculiarly low dynamical mass-to-light ratio concords with new optical and Hi observations.
UGC11919 is SABb galaxy with apparent magnitude corrected for Galactic extinction mag. Its cosmological velocity (5576 km s-1) corresponds to the distance 74 Mpc and luminosity mag. The galaxy possesses the bar, two prominent symmetric spiral arms, and, as our Hi observations showed, a giant hydrogen ring of low intensity, surrounding the optical galaxy. According to Paper I, the best fit dynamical mass-to-light ratios of stellar disc and bulge (, ) are correspondingly 3 and 5 times lower, than it is expected from the model -color relations for the scaled Salpeter IMF proposed by Bell & de Jong (2001).
However, the inclination angle estimate is quite uncertain for this galaxy. It leaves the question of mass estimates of UGC11919 open. Indeed, Hyperleda database gives the inclination angle obtained from the outer isophotes axes ratio. More elaborate 2D-photomerty carried out in Paper I gave i = , leading to the peculiarly low . After masking the prominent spiral arms the flattening of optical isophotes () for admits the inclination . Thus the photometric estimations of do not solve the problem of low dynamical mass of stellar population.
The Hi data analysis partially softened the discrepancy, giving the lower value for the model taking into account the velocity and density perturbations due to two-armed spiral structure. In Paper I we also considered the warped disc model where the inclination and the position angle varied with radius, representing the symmetric S-shaped warp. However in this model the inclination changes only moderately remaining between 45 and 35 degrees. So both models give the range of that does not eliminate the disagreement with the ratio expected from the color indices of the galaxy.
To reconcile the dynamic and photometric mass estimates the inclination should be about . As we show below this value is not in conflict with the observational data.
In this paper we re-processed the Hi data cube of UGC11919 and attracted the data of spectral observations we carried out at 6m telescope BTA to clarify the dynamic properties of this galaxy and to study the properties of its stellar population.
2 The inclination angle: re-processing of Hi data

Observations of UGC11919 in the Hi line mentioned above were carried out earlier in the Westerbork Synthesis Radio Telescope (WSRT). The data processing and the results were described earlier in Paper I. In the current work we applied the same program TiRiFiC111http://www.astron.nl/ jozsa/tirific/ to reprocess the Hi data cube obtained in order to check the compatibility of kinematical model with low inclination angle. TiRiFiC is a software allowing for a direct fit of modified tilted-ring models to data cubes (Józsa et al., 2007). We used the model similar to the bisymmetrical model described in Paper I for a thin disc, which takes into account the presence of the ordered non-circular motions in addition to morphological deviations from axial symmetry from two arm spiral structure. This time we changed the initial guesses of the parameters significantly in order to get as low inclination as possible which remains compatible with the Hi data cube and obtained a model with the inclination in a good agreement with the value needed to eliminate the discrepancy between the dynamical and photometrical mass estimates.
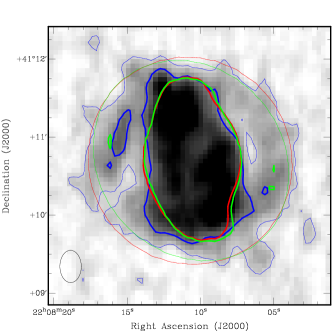
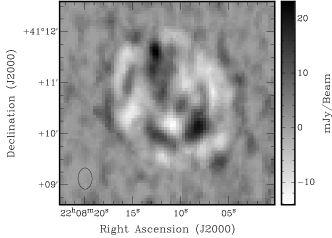
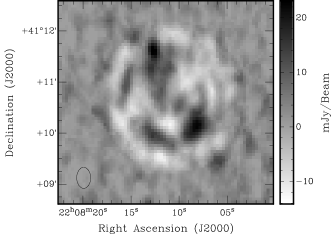
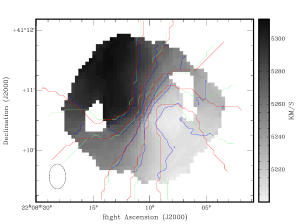
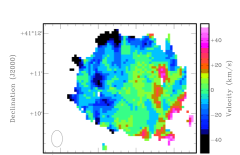
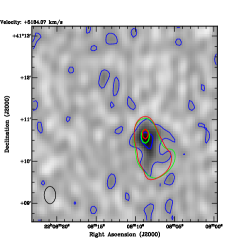
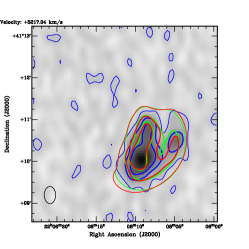
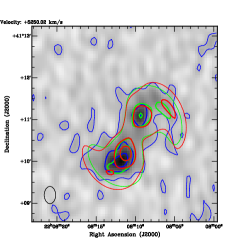
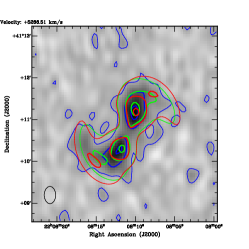
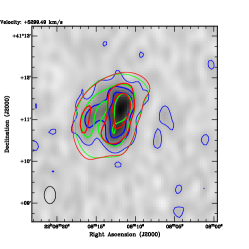
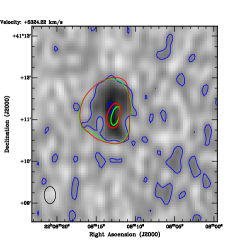
In Figs. 1, 2 we show the observed Hi total intensity map with the overplotted observed isodensities, the model contours and the residuals (observed minus model maps) for high and low inclination ( and ). In Fig. 3 we also compare the observed and model first moment Hi maps. The contours in Fig. 3 correspond to the velocities 0, 20, 40 of the observed (blue) and model maps for (red) and (green). In Fig. 4 we demonstrate the residues of the models from the observed first moment map. One may see that model with low inclination slightly overpredicts the rotational amplitude and the surface density of the gas in the peripheral regions, although it can’t be rejected. A similar conclusion may be done from the comparison of the model and the observed data cubes (see Fig. 5). Hence the Hi data do not contradict to the low inclination and to the non-peculiar IMF.
We checked the compatibility of the given inclination angles with the position of the galaxy in the Tully-Fisher diagrams. In Fig.6 we plotted UGC11919 assuming two values of inclination ( and ) on the three kinds of Tully-Fisher (TF) diagrams: a classical one, where the rotational velocity is compared to the B-band luminosity (Fig.6, left), baryonic (Fig.6, centre) and stellar (Fig.6, right) masses of galaxies. The parallel lines in these figures mark the sequences found by McGaugh (2005) and McGaugh & Schombert (2015) for the samples of disc galaxies and their uncertainties. The luminosity and masses of UGC11919 are taken from Paper I and Sect. 4.5 of current paper (for ). As could be seen from Fig.6 the low inclination case nicely agrees with the relations followed by spiral galaxies.
We came to conclusion that the disc of UGC11919 either is really too light for its luminosity, or the galaxy is seen nearly face-on. In the latter case the isophotes flatness reflects a large-scale non-axisymmetry of the disc. The oblate form of the optical disc (the internal axial ratio of or lower) is needed to explain the difference between the optically observed inclination and the inclination corresponding to the ”normal” ratio. In both cases the galaxy appears to be interesting for further studying. The aim of current article is to test the results of dynamical modeling obtained in Paper I and to explore the properties of stellar population of the galaxy using the long-slit data.
In current paper we give more preferences to the inclination obtained from the Hi data cube modeling and corresponding to the ”normal” IMF since it is in good agreement with the stellar velocity dispersion data (see below). However one should keep in mind that the higher inclination cannot be fully excluded.


3 Spectral observations and data reduction
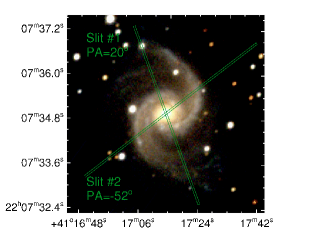
We carried out observations of UGC11919 in the primary focus of the 6-m telescope of the Special Astrophysical Observatory (SAO RAS) in August 2013 using the SCORPIO focal reducer (Afanasiev & Moiseev, 2005) in the long-slit mode. Observations were conducted for two position angles which is by less than the major axis found in Paper I from the Hi data cube modeling, however it is close to the derived from the analysis of optical isophotes, and which is close to minor axis. We used the two spectral cuts to study the dynamics of the disc and the spectral properties of stellar population. Unfortunately we failed to get a reliable estimates of the orientation angles of the disc from these data. We give preference to the value of found from the Hi data.
The exposure times and atmospheric conditions are given in Table 1. We utilized the slit-width of 1. The positions of the slit are shown in Fig. 7. We used VPHG2300G grism with the spectral range of 4800-5570 Å and reciprocal dispersion 0.38 Å. The spectral resolution is . The scale along the slit is .
The data reduction was performed as it is described below. First we subtracted the averaged bias frame and truncated the overscan regions. The traces of cosmic ray particles were removed and after that all frames were divided by normalized flat field frames. Then to calibrate the spectra we constructed two-dimensional dispersion equation using the spectrum of a He-Ne-Ar calibration lamp, which gave the mean error 0.05 Å. The spectra were linearized and summed. Then we subtracted the spectrum of the night sky taking into account the instrumental profile variations along the slit (for more details of sky subtraction see Katkov & Chilingarian 2011). After that we performed the flux calibration using the spectrum of spectrophotometric stellar standards GD248 and GRW70D.
To estimate the variation of the parameters of the spectrograph instrumental profile we analyzed the twilight sky spectrum observed in the same observational run. To do this, we splitted the frame of the twilight sky spectrum into the sections and co-added the spectra to achieve a high signal-to-noise ratio. After that we fitted the every section by the high- resolution solar spectrum, taken from the ELODIE3.1 stellar spectral library (Prugniel et al. 2007). During the fitting we parameterized the twilight sky spectrum by the Gauss-Hermite series of orthogonal functions (van der Marel & Franx 1993). It allowed us to obtain the instrumental profile parameters for different spectral ranges and along the slit. The resulting variation of the instrumental profile was taken into consideration during the spectral fitting by convolving it with the grid of stellar population models.
The parameters of stellar population of galaxy were obtained by fitting high-resolution PEGASE.HR simple stellar population models (Le Borgne et al., 2004) (hereafter SSP models) in which all stars are formed in one instantaneous burst of starformation. The NBursts full spectral fitting technique (Chilingarian et al., 2007) we used allows to fit the observed spectrum in the pixel space against the population model convolved with a parametric line-of-sight velocity distribution. In this method the parameters of the stellar populations are derived by nonlinear minimization of the quadratic difference chi-square between the observed and model spectra. As the result of modelling we obtained the radial profiles of the velocity, velocity dispersion, age of stellar population and its metallicity. A subtraction of the model of stellar spectrum from the observed one gave us a pure emission spectrum. We fitted the emission lines by Gaussian distribution which allowed to obtain the velocity and velocity dispersion of the ionized gas.
In order to increase the signal to noise ratio for the peripheral regions of the galaxy we used the adaptive binning procedure to achieve the signal-to-noise ratio for every bin.
As far as the mass-to-light ratio of different components of UGC11919 is of crucial interest for us we have also performed a more elaborate analysis to obtain the integrated properties of stellar population of the main stellar components of the galaxy. In contrast to the estimation of radial distribution of the parameters of stellar population described above we utilized the NBursts+phot technique presented by Chilingarian & Katkov (2012). This technique uses not only the spectral data but also the broad- band spectral energy distribution (SED). This method was earlier successfully applied to the giant low surface brightness galaxy Malin 2 (see Kasparova et al. 2014). We used the photometric broad-band optical data from Paper I parallel with the archive SDSS and GALEX images in NUV, FUV, u, g, r, i, z, B, V photometric bands. The photometric data were reduced in a standard way using the MIDAS software package222 MIDAS is developed and maintained by the European Southern Observatory. software package. The archive data were calibrated according to the information available at the FITS file headers.. After that we modelled the spectra and SEDs separately for the disc, bulge and nuclear disc regions assigning the equal weight to the wide-band magnitudes and the detailed spectrum fitting. In contrast to the estimation of radial distribution of the parameters of stellar population described above here we used the integrated spectrum for each component of the galaxy. To do it we summed the spectra in the following three regions: ″(nuclear disc), ″(bulge), ″(the main disc). To fit both the spectra and SED we used not only the SSP model as for the radial variation of the parameters, but also the models with the exponentially declined star formation (exp-SFH). Both SSP and exp-SFH models are computed with the PEGASE.HR code based on the ELODIE.3.1 empirical stellar library. The SSP stellar population models are characterized by metallicity [Z/H] and age , the exp- SFH models — by metallicity [Z/H] and the exponential decay time scale . The epoch of start of star formation in the exp-SFH model is fixed at Gyr (note that the results are not sensitive to the choice of yr). We used two IMFs in the models: the Salpeter IMF (SSP model) and the Kroupa IMF (exp-SFH model).
| Exposure time, s | Seeing, | |
| 20 | 8100 | 1.4 |
| -52 | 9600 | 1.4 |
4 Results
4.1 Kinematics
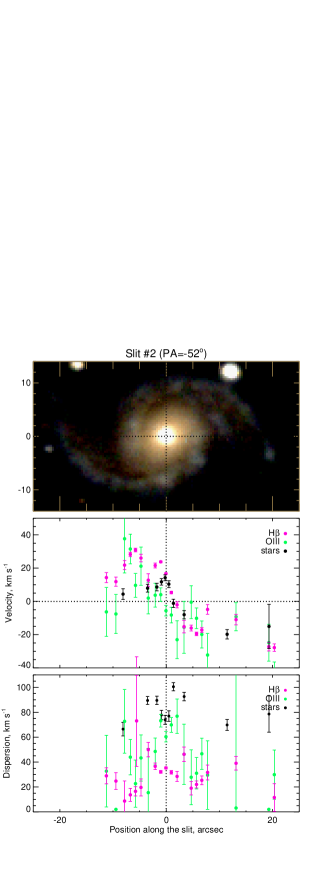
In Figs. 8,9 we show kinematical profiles of line-of-sight velocities and velocity dispersions of stars and ionized gas obtained from the long- slit spectra oriented at and . We also give the reference composite SDSS images in gri- bands in the top panels.
Line-of-sight velocity distribution along clearly reveals the rotation with a steep velocity gradient within galactocentric distance ″.

Velocity dispersion of stars is high in the central 5-7″, where the light of bulge prevails. From Figs. 8,9 it follows that there is a central depression of stellar velocity dispersion for both slit positions, within (corresponding to ) which can indicate a nuclear, kinematically decoupled, stellar disc. This effect could also be the result of the orbital anisotropy related to the bar, however in this case we would expect it to be different for nearly orthogonal positions of the slit.
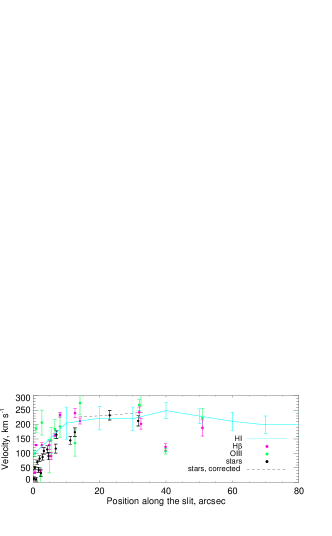
In Fig. 10 we show the rotation curve of stars and gas assuming (the long-slit data are taken along ). We take into account that the slit orientation differs by the angle from the position of major axis, using the geometric relationships for axisymmetric disc:
| (1) |
| (2) |
Here is the radius in the plane of projection, is the line-of-sight velocity corrected for the systemic velocity.
In Fig. 10 we also show by black dashed line the rotation velocity of stars corrected for asymmetric drift in epicyclical approximation for exponential stellar disc following Binney & Tremaine (2008):
| (3) |
Here is the circular velocity, is the observed rotation velocity of stars, is radial velocity dispersion of stars, is the exponential scalelength of disc.
As could be seen from Fig. 10 the optical rotation velocities agree well with the Hi kinematic data, with the exception of the central part of the disc where the resolution of Hi is not good enough. The low intensity of emission lines cannot reproduce the reliable shape of rotation curve in the outer regions of the disc. By this reason we’ll use below the rotation curve found from Hi measurements, which allow to trace it much further from the centre.
4.2 The properties of stellar population
Parallel with kinematic estimates, we also obtained the radial profiles of luminosity-weighted values of stellar age and metallicity [Z/H]. The radial profiles of the resulting parameters are shown in Figs. 11, 12 for and respectively. We also give the reference SDSS images in order to link the data with the image of the galaxy. As could be seen from Figs. 11, 12 the age and metallicity do not remain constant along the slits. We mark by thin dotted lines the positions of regions with sharp gradients of the age of stellar population. The central depression of the age noticeable in the profiles for both slit positions most probably corresponds to the nuclear disc with the long lasted star formation which reduces the mean stellar age. The increase of the age at ″seen in Figs. 11, 12 is the manifestation of the old stellar bulge, which dominates the luminosity in this region. We also see in Fig. 11 two minima at the positions close to the spiral arms, evidently indicating the presence of the current star formation in the spiral arms.


The mean (luminosity-weighted) stellar age obtained for the central region of UGC11919 is about 1.5 Gyr. Stellar metallicity of this region is about -0.2 dex, that is a factor 1.5 lower than the solar metallicity. This underabundance is typical for a galaxy of a given luminosity. Further from the centre where the disc contribution dominates we obtained the mean values: , Gyr corresponding to which practically coincides with that found by Paper I from the observed color index and -color relation given by Bell & de Jong (2001) (). This ratio is about 3 times higher than that based on the mass-modeling for and is in good agreement with the rotation curve for (see Sect. 4.5).
4.3 SED and the detailed spectrum modelling
To obtain the integrated properties of stellar population of each component of the galaxy we performed modeling of both spectrum and broad-band SED (for more details on the method see Sect. 3).
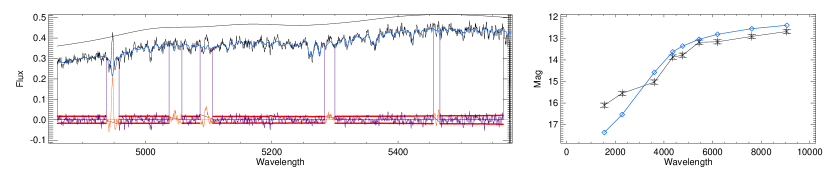
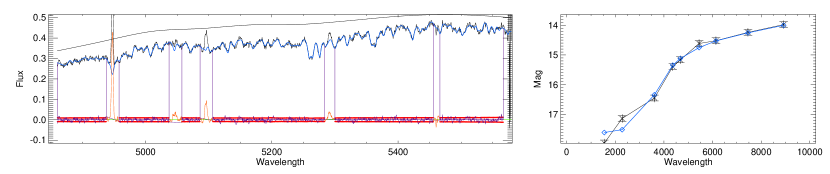
As could be seen from Fig. 13, SSP models failed to reproduce the high fluxes in UV. However the GALEX images of UGC11919 are characterized by low S/N ratio. By that reason we decided to consider the SSP models neglecting UV fluxes. In Figs. 14, 15 and 16 we show the observed and model spectra (SSP model and SED model) for the disc, bulge and nuclear disc correspondingly without using the UV data. Blue and black lines and the symbols correspond to the model and observed data respectively. The resulting values of stellar population age, metallicity, and ratios for the SSP modeling of the spectra obtained for both slits are given in Table 2. The obtained mass-to-light ratio (see Table 2) is 1.4 times higher and 1.1 times lower than that found in Paper I from color indices for a bulge and a disc correspondingly. All these values of ratios remain significantly higher than those obtained in mass- modeling for °. However for the discrepancy disappears. It indicates that either the IMF of UGC11919 is bottom-light with a deficit of low massive stars, or the inclination angle is much lower than the photometry gives.
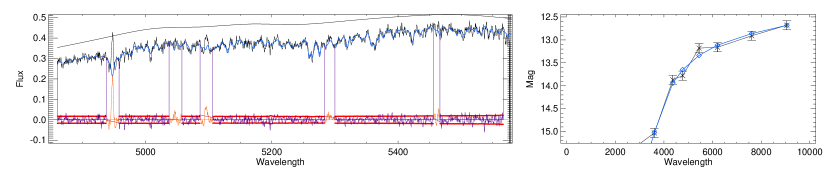
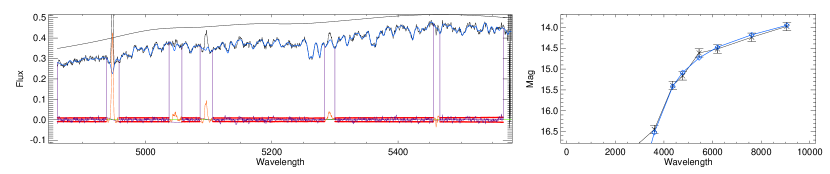
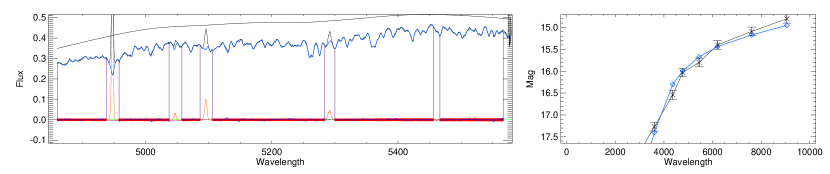
Figs. 17 and 18 show the observed and exp-SFH model spectra and SED for disc and bulge. The model with exponential star formation history failed to reproduce the spectrum and SED of the nuclear disc. It means that a history of its star formation should be more complex. Lines and symbols correspond to the model (blue) and observed (black) data. The resulting parameters , and for the spectra obtained at both slit positions using exp-SFH model are given in Table 2.
As could be seen from Table 2, there is a reasonable agreement between the parameters obtained for the spectra of both slits. The variation of the age and metallicity for different s are quite expectable because the slits cross the regions with different properties of stellar population. From Table 2 it follows that the youngest stellar component of the galaxy is the nuclear disc, at the same time it possesses the relatively low metallicity. One may propose that this component could be formed by the accretion of the low mass satellite galaxy by UGC11919 followed by the star formation. The stellar population of bulge possesses the largest age, its metallicity is higher than that of the younger stellar main disc reflecting the negative radial metallicity gradient usually observed for spiral galaxies.
4.4 On the disc thickness and its gravitational stability
The measurement of stellar velocity dispersion within one disc radial scalelength kpc where the contribution of bulge is negligible may give the additional information about the disc dynamical condition for the different accepted disc inclination.
In both cases - for or the main component of stellar velocity dispersion is the vertical component perpendicular to the disc plane. It allows to use its value ( 48 km ) for the rough estimate of the equilibrium scaleheight of stellar disc:
| (4) |
where is the surface density of the disc at the galactocentric distance r. Mass decomposition of the galaxy presented in Paper I gives for the density for (disc with peculiarly low ratio). For the inclination , expected for the normal stellar IMF . The corresponding values of are 4.9 kpc and 1.5 kpc or and . It is evident that in the first case the disc half-thickness is unacceptably big, which gives the additional evidence in favor of the lower inclination and the normal density stellar disc.
The estimates of stellar velocity dispersion may also be used to put constraint on the disc surface density using the condition of gravitational stability of the disc. It is worth noting that the comparison of the masses of galactic discs of spiral galaxies found under assumption of their marginal stability and those found from photometric models shows that they usually agree, which gives evidences that the stellar discs are close to marginally stable condition at least at 1-2 radial scalelengths (see e.g. Zasov et al. 2004, Zasov et al. 2011, Saburova & Zasov 2012). For the one-component isothermal disc the stable state is locally reached when the radial stellar velocity dispersion at a given galactocentric distance r exceeds the critical value :
| (5) |
where is the epicyclic frequency, and is the Toomre’ stability parameter which is equal to unit for pure radial perturbations of a thin disc. Numerical simulations show that for the marginal stability of exponential discs with finite thickness the parameter 1.2 - 3 is slowly growing to the disc periphery (see f.e. Khoperskov et al. 2003). In general case, one have to take into account the presence of the additional dynamically cold component of the galaxy (gas) which makes the disc more unstable (see for example Romeo & Wiegert 2011). However in our case the local values of do not exceed 9 (see Paper I), whereas the density obtained from the rotation curve for is at least one order of magnitudes higher. It means that the presence of a gas component with a typical velocity dispersion 10 does not change the stability condition significantly especially if to take into account the approximate nature of our estimates. We choose again a representing galactocentric distance (one radial scalelength), where in addition to the velocity of rotation we also have the estimates of stellar velocity dispersion.
The marginal velocity dispersion depends on the assumed disc inclination. Indeed, the reducing of will increase both the value of the surface density found from the rotation curve decomposition, and , that is the numerator and denominator in the equation above. However at a given is proportional to the velocity of rotation which, in turn, is proportional to , whereas . It enables to compare the models with different inclination angles .
We estimated radial velocity dispersion from the observed line-of-sight stellar velocity dispersion at , taking into account the expected links between the dispersion along the radial, azimuthal and vertical directions:
where is the angle between the direction of the slit and the major axis.
To solve the equation we need two additional conditions: ( Lindblad formula for the epicyclic approximation) and , where , , are the dispersion along the vertical, azimuthal and radial directions, projected on the plane of the galaxy. The coefficient was taken to be 0.6 in accordance with direct measurements, which show that it could lie in the range 0.5–0.8 (see e.g. Shapiro et al. 2003). The epicyclic frequency was calculated from the Hi rotation curve for a given inclination angle: . For the accepted we obtained . The gravitational stability criterion gives the upper limit of the surface density of stable disc at the radial distance of one scalelength as which is times higher than it follows from the decomposition of rotation curve constructed for (see Paper I). However this density is comparable with the photometrically determined density at , obtained in Paper I for the usually accepted stellar IMF (). If we take a more probable value , the velocity of rotation will become about two times higher, and the marginal surface density at would be about . This value exceeds both the photometrical density estimate and the maximum density of the disc compatible with the observed rotation curve. We conclude that the disc at this distance is stable and moderately overheated. This overheating may be a result of tidal interaction or minor merging which looks quite possible because there are several faint galaxies observed in the close vicinity from UGC11919, revealing themselves in the Hi map (see Paper I).

| PA=20 | PA=-52 | |||||||||||
| Model | / , Gyr | [Z/H], dex | / , Gyr | [Z/H], dex | ||||||||
| SSP | exp SFH | SSP | exp SFH | SSP | exp SFH | SSP | exp SFH | SSP | exp SFH | SSP | exp SFH | |
| inner disc | 2.05 | - | -0.29 | - | 1.56 | - | 2.48 | - | -0.31 | - | 1.87 | - |
| bulge | 4 | 5.22 | -0.44 | -0.36 | 2.73 | 2.07 | 4.44 | 5.14 | -0.45 | -0.37 | 2.95 | 2.09 |
| disc | 2.55 | 7.75 | -0.64 | -0.54 | 1.48 | 1.42 | 2.65 | 7.83 | -0.50 | -0.37 | 1.69 | 1.56 |
4.5 Mass modeling
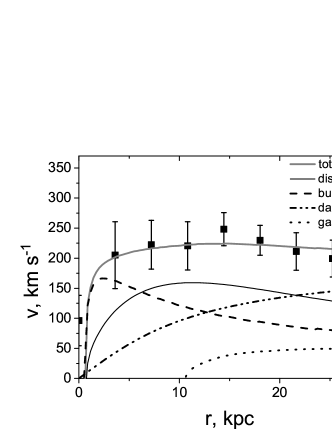
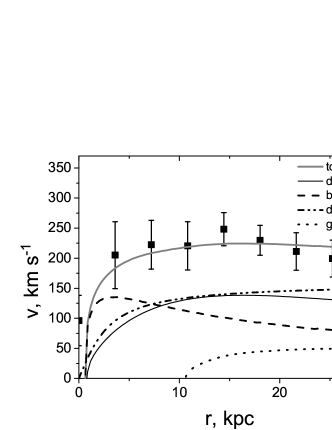
We performed the decomposition of the rotation curve obtained from the reprocessing of the Hi data into Sersic bulge, exponential stellar disc, gaseous disc and pseudo-isothermal dark halo. The density profile of the Hi disc is taken from the observations and scaled by 1.3 to include the helium. The radial profiles of surface density of stellar disc and bulge are proportional to the distribution of their surface brightness (from Paper I). Two models were considered. In Model 1 the mass-to-light ratios of disc and bulge are calculated using the -color model relations for scaled Salpeter IMF of Bell & de Jong (2001). They are varying with radius according to the change of the color index of bulge and disc obtained in Paper I. In the Model 2 we use the constant mass-to-light ratios of stellar components derived from the spectra and SED modeling in Sect.4.3. As long as the surface densities of visible components are fixed the parameters of the dark matter halo (radial scale and asymptotic velocity) were scaled to achieve the minimal deviation of the resulting model rotation curve from the observed curve. Both best fit models of the rotation curve are shown in Fig. 19. As could be seen from Fig. 19 both models give a good fit to the obtained rotation curve. In Table 3 we give the masses of the components and the total mass () within the radius for the two models. The dark halo contains more than a half of the total mass within the last measured radius of the rotation curve for both models.
| , kpc | , | , | , | , | , | |
|---|---|---|---|---|---|---|
| Model 1 | 29 | 7.8 | 15 | 3.7 | 0.9 | 27.4 |
| Model 2 | 29 | 7.6 | 15 | 3.8 | 0.9 | 27.3 |
5 Conclusions
We performed the long-slit observations of spiral galaxy UGC11919 which was suspected in the previous study (see Paper I) as a galaxy possessing a peculiarly low dynamical disc and bulge mass-to-light ratios. The main results are given below.
-
•
We estimated the radial profiles of line-of-sight velocities and the velocity dispersion for stars and gas. Spectral slices of UGC11919 allow to propose that the galaxy possesses a nuclear disc, where the stellar velocity dispersion is lower than in the bulge.
-
•
The analysis of long-slit data together with SED with scaled Salpeter and Kroupa IMFs confirms the previous conclusion that the mass-to-light ratios of stellar population are several times higher than it follows from the dynamic modeling of the rotation curve if the disc inclination angle corresponds to the photometrically defined values . However the re-processing of Hi data showed that the lower inclination i = cannot be excluded from dynamical data, which may eliminate the contradiction between the dynamical and photometrical estimations of disc mass. In addition, the stellar velocity dispersion at the radial scalelength better agrees with the ”heavy” disc (i = ) – the ”light” disc corresponds to the unrealistically large thickness of the disc . The lower inclination also is in a good agreement with the position of the galaxy at the Tully-Fisher diagrams. It allows to conclude that the disc inclination of UGC11919 is significantly lower than it follows from the photometry which may evidence the non-round shape of the disc even after the correction for two-armed spiral structure.
-
•
Applying the sophisticated models of stellar population with “normal” (Salpeter and Kroupa) stellar IMFs to the spectra and the broad-band SED we obtained the mean age (4.2, 2.6 and 2.3 Gyr) and metallicity [Z/H] (-0.4, -0.5 and -0.3 dex) for the bulge, disc and nuclear disc of UGC11919 correspondingly. It reveals the long lasting star formation in all three components.
-
•
We decomposed the rotation curve and estimated the masses of bulge, disc and halo assuming photometry based of stellar components.
-
•
We found that the main disc of the galaxy is dynamically overheated. In principle, this could be the result of gravitation interaction with the companions, some of which are observed only in Hi (see Paper I).
Acknowledgments We thank the anonymous referee for the important remarks which allowed us to improve the paper. The observations at the 6-meter BTA telescope were carried out with the financial support of the Ministry of Education and Science of the Russian Federation (agreement No. 14.619.21.0004, project ID RFMEFI61914X0004). The analysis and interpretation of the long-slit observational data was supported by the Russian Science Foundation grant no. 14-22-00041. The reprocessing of the 21 cm data is made with the support of the RFBR, research project No. 15-32-21062 a.
We are grateful to Gyula Józsa for providing the TiRiFiC software and for the fruitful discussion. We acknowledge the usage of the HyperLeda database (http://leda.univ-lyon1.fr). The funding for the SDSS has been provided by the Alfred P. Sloan Foundation, the Participating Institutions, the National Science Foundation, the United States Department of Energy, the National Aeronautics and Space Administration, the Japanese Monbukagakusho, the Max Planck Society and the Higher Education Funding Council for England.
References
- Afanasiev & Moiseev (2005) Afanasiev V. L., Moiseev A. V., 2005, Astronomy Letters, 31, 194
- Bastian et al. (2010) Bastian N., Covey K. R., Meyer M. R., 2010, ARA&A, 48, 339
- Bell & de Jong (2001) Bell E. F., de Jong R. S., 2001, ApJ, 550, 212
- Binney & Tremaine (2008) Binney J., Tremaine S., 2008, Galactic Dynamics: Second Edition. Princeton University Press
- Chilingarian & Katkov (2012) Chilingarian I. V., Katkov I. Y., 2012, in Tuffs R. J., Popescu C. C., eds, IAU Symposium Vol. 284 of IAU Symposium, NBursts+phot: parametric recovery of galaxy star formation histories from the simultaneous fitting of spectra and broad-band spectral energy distributions. pp 26–28
- Chilingarian et al. (2007) Chilingarian I. V., Prugniel P., Sil’Chenko O. K., Afanasiev V. L., 2007, MNRAS, 376, 1033
- Gilmore (2001) Gilmore G., 2001, in Tacconi L., Lutz D., eds, Starburst Galaxies: Near and Far Evidence Supporting the Universality of the IMF. p. 34
- Gunawardhana et al. (2011) Gunawardhana M. L. P., Hopkins A. M., Sharp R. G., Brough S., Taylor E., Bland-Hawthorn J., Maraston C. e. a., 2011, MNRAS, 415, 1647
- Józsa et al. (2007) Józsa G. I. G., Kenn F., Klein U., Oosterloo T. A., 2007, A&A, 468, 731
- Kasparova et al. (2014) Kasparova A. V., Saburova A. S., Katkov I. Y., Chilingarian I. V., Bizyaev D. V., 2014, MNRAS, 437, 3072
- Katkov & Chilingarian (2011) Katkov I. Y., Chilingarian I. V., 2011, in Evans I. N., Accomazzi A., Mink D. J., Rots A. H., eds, Astronomical Data Analysis Software and Systems XX Vol. 442 of Astronomical Society of the Pacific Conference Series, A New Sky Subtraction Technique for Low Surface Brightness Data. p. 143
- Khoperskov et al. (2003) Khoperskov A. V., Zasov A. V., Tyurina N. V., 2003, Astronomy Reports, 47, 357
- Kroupa (2001) Kroupa E., 2001, MNRAS, 322, 231
- Kroupa (2002) Kroupa P., 2002, Science, 295, 82
- Le Borgne et al. (2004) Le Borgne D., Rocca-Volmerange B., Prugniel P., Lançon A., Fioc M., Soubiran C., 2004, A&A, 425, 881
- McGaugh (2005) McGaugh S. S., 2005, ApJ, 632, 859
- McGaugh & Schombert (2015) McGaugh S. S., Schombert J. M., 2015, ApJ, 802, 18
- Prugniel et al. (2007) Prugniel P., Soubiran C., Koleva M., Le Borgne D., 2007, ArXiv Astrophysics e-prints
- Romeo & Wiegert (2011) Romeo A. B., Wiegert J., 2011, MNRAS, 416, 1191
- Saburova et al. (2013) Saburova A. S., Józsa G. I. G., Zasov A. V., Bizyaev D. V., 2013, A&A, 554, A128
- Saburova et al. (2009) Saburova A. S., Shaldenkova E. S., Zasov A. V., 2009, Astronomy Reports, 53, 801
- Saburova & Zasov (2012) Saburova A. S., Zasov A. V., 2012, Astronomy Letters, 38, 139
- Salpeter (1955) Salpeter E., 1955, ApJ, 121, 161
- Shapiro et al. (2003) Shapiro K. L., Gerssen J., van der Marel R. P., 2003, AJ, 126, 2707
- van der Marel & Franx (1993) van der Marel R. P., Franx M., 1993, ApJ, 407, 525
- Zasov et al. (2011) Zasov A. V., Khoperskov A. V., Saburova A. S., 2011, Astronomy Letters, 37, 374
- Zasov et al. (2004) Zasov A. V., Khoperskov A. V., Tyurina N. V., 2004, Astronomy Letters, 30, 593