Evidence for the decay
Abstract
Existing data on the cross section at the center-of-mass energy above 2.6 GeV are fitted with a sum of resonant and continuum contributions. Two solutions for the resonance production cross section are found with a significance of 3.2. Data on the cross section are used to resolve the ambiguity and for further constraining the values of the cross section and the interference phase. They are found to be pb and , respectively. The same fitting procedure for the resonance leads to the upper limit on the cross section pb at 90% confidence level.
pacs:
13.25.Gv,13.66.Bc,14.40.PqI Introduction
The meson is the lowest-mass state laying above the open-charm threshold and therefore is expected to decay predominantly into pairs. A simple estimation based on the assumption that the decay probability for -meson into light hadrons is proportional to , where is the meson wave function at the origin, leads to the relation between and branching fractions:
| (1) | |||||
The total branching fraction of the into light hadrons is expected to be about . This prediction strongly contradicts the BES Collaboration observation that the total branching fraction for non- decays is nonDD . The CLEO measurement of the same value is at 90% confidence level (CL) nonDD1 . The BES measurement has triggered an intensive search for decays into light hadrons. About 90 final states were studied pdg , but only two decays, to phieta and ppbar , were observed. The measured branching fractions significantly exceed above prediction, by more than an order of magnitude for and by four orders for decay. The mechanism explaining relatively large values of branching fractions is production of light hadrons via intermediate loops (see Refs. ddloop ; th2 and references therein). The predicted in Ref. ddloop branching fraction for the decay , studied in this work, is ; it is larger than the prediction of Eq. (1) by about three orders of magnitude.
For branching fractions of , the cross section for the resonant process is usually less than the nonresonant cross section. Therefore, the decay will reveal itself as an interference pattern in the energy dependence of the cross section. The first experimental study of the interference near the resonance was performed for the process in the BESIII experiment ppbar . In this work existing data on the and cross sections are used to study the interference near the and resonances and measure the cross sections for the resonant processes .
II Fit to the cross section
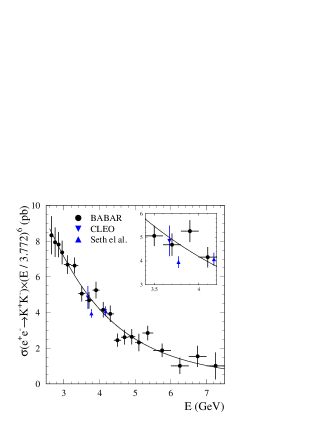

For the process, we use the BABAR measurements in the center-of-mass energy region GeV obtained using the initial-state radiation (ISR) method BABAR , and direct measurements CLEO ; NU at , 3.772 4.17 based on data collected in the CLEO experiment. The measured energy dependence of the cross section above 2.6 GeV is shown in Fig. 1. The curve is the result of the fit to the cross-section data with the function proposed in Ref. BABAR :
| (2) |
where is the fine-structure constant, , is the charged kaon mass, , , and are fitted parameters. The measurements from Ref. NU performed near the maxima of the and resonances, are not included in the fit.
As seen in the inset, the point at 4.17 GeV is consistent with the approximation of the nonresonant cross section, whereas the point at 3.772 GeV lies about three standard deviations below. The deviation may be a result of interference between the resonant and nonresonant amplitudes of the reaction.
The cross section near the resonance is described by the following formula:
| (3) |
where is the cross section for the process in the resonance maximum, is the relative phase between resonant and nonresonant amplitudes, , and and are the mass and width, respectively.
Data from Refs. BABAR ; CLEO and the measurement at GeV from Ref. NU are fitted by the formula (3). The measurements in Ref. BABAR were made using the ISR method. Therefore, they are compared with the average cross-section values over the corresponding energy intervals. For the energy intervals near the resonance, 3.6–3.8 and 3.8–4.0 GeV, where the cross section changes rapidly due to interference of resonant and nonresonant amplitudes, the invariant mass spectrum for the ISR process BABAR is used instead of the cross section. The mass spectrum is described as follows
| (4) | |||||
| (5) |
where and are the true and measured invariant masses, respectively, is a function describing detector mass resolution BABAR , is the ISR luminosity (see, for example Ref. BABAR ), is the detection efficiency, is the mass spectrum of background events. The mass dependence of the ISR luminosity, detection efficiency and are obtained by interpolation between the values given in Ref. BABAR for mass intervals shown in Fig. 1. The experimental mass spectrum contains also events from the decay . The contribution is added to the fit with a shape described by convolution of a Breit-Wigner resonance line-shape with the resolution function. The measured cross and the mass spectrum are fitted simultaneously.
The systematic uncertainty of the cross section measured in Ref. BABAR is separated into two parts. The first includes systematic errors of statistical origin, mainly due to background subtraction. This uncertainty is added in quadrature to the statistical error of the cross section. The second part includes correlated uncertainties due to the data-MC simulation difference in the detection efficiency and luminosity determination. This uncertainty () is practically independent of energy and is equal to 2.4%. In the fit, it is taken into account by multiplying the theoretical cross section [Eq. (3)] for the BABAR measurements by a free parameter , and by adding to the logarithmic likelihood function the term , which allows all theoretical values for the BABAR measurements to be shifted simultaneously inside . For the measurements of Refs. CLEO ; NU at and 3.772 GeV, the statistical and systematic uncertainties are added in quadrature.
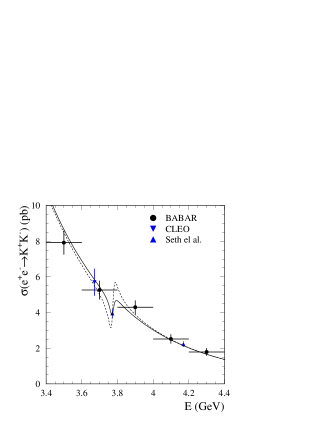
The fitted parameters are , , the value of the nonresonant cross section at GeV, and from Eq. (2), the number of events from the decay, and . The result of the fit is shown in Fig. 2 by dashed curves. The statistical significance of the decay is calculated from the differences of the likelihood function values for the fits with free and and is found to be .
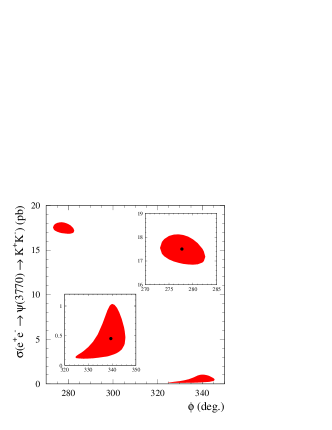
The fit yields two solutions. They correspond to the same values of the factors and in Eq. (3), but different values of and . The contours for these solutions are shown in Fig. 3.
To determine the branching fraction the fitted cross section is divided by the cross section, which is calculated as . Unfortunately, the experimental situation with electronic width is somewhat uncertain. The Particle Data Group pdg value keV corresponds to nb, which is significantly higher than the value of the cross section nb measured by the CLEO Collaboration in the maximum of the resonance ddbar . Interference between resonant and nonresonant amplitudes in the reaction, which was ignored in most measurements, is a source of additional uncertainty. The analysis performed by the KEDR collaboration KEDR shows that taking into account the interference decreases by about 40% compared with the value obtained ignoring the interference. In this paper we will estimate the branching fraction using the value nb obtained by CLEO gee . The close value was used previously in the measurements of phieta and kskl .
The two obtained solutions correspond to the branching fractions of about and . The latter significantly, more than by an order of magnitude, exceeds theoretical predictions ddloop .
III Constraints from measurements
Additional constraints on the value can be obtained from data on the process. The branching fractions of and may be different only due to single-photon contributions, which are related to the values of the nonresonant and cross sections. The cross section for the single-photon transition is calculated as gatto
| (6) |
and is about pb. The corresponding branching fraction is about . For the final state, the single-photon branching fraction is expected to be at least an order of magnitude smaller (see discussion below). Taking into account interference between electromagnetic and strong decay amplitudes, we conclude that for higher than the single-photon contribution is negligible. Therefore, we expect that is good approximation.
For the process, there is an upper limit on the cross section at 3.773 GeV kskl , pb at 90% CL. In Ref. kskl this value was used to obtain the upper limit on . This approach, however, does not take into account interference between resonant and nonresonant amplitudes of the process. Data on the nonresonant cross section in the energy region of interest are practically absent. There are two measurements dm1 ; KSKLbabar near 2 GeV. Comparing these measurements with data on the cross section KKbabar we estimate that at GeV. At higher energy, there is only one measurement of this ratio at 4.17 GeV KSKLNU , which may be distorted by resonance contributions from the decays. The theoretical prediction for this ratio obtained using leading-order leading-twist QCD calculation of the kaon electromagnetic form factors, is chernyak in the energy region 3–4 GeV.
To take into account the data, we include in the fit, described in the previous section, two additional measurements: , which corresponds to the upper limit pb at 90% CL, and , obtained from a linear approximation between the values at and 4.17 GeV. The energy dependence of the cross section near resonance is described by Eq. (3) with the replacement of by . It is expected that in the energy region under study the nonresonant and amplitudes have the same sign of the real parts and similar ratios of imaginary to real parts chernyak_sign . Therefore, we assume that the phase is the same for and .
The fit with the data yields a single solution:
| (7) | |||||
| (8) |
The and values obtained with the constraints are shifted from unconstrained values obtained in the previous section by about . The statistical significant of the result is the same, . The fitted energy dependence of the cross section and the fitted mass spectrum are shown in Fig. 2 by the solid curves.
The fitted value of the nonresonant cross section at is pb. The expected energy dependence of the cross section near the resonance is shown in Fig. 4 by the solid curve. To study dependence of the result on the value of , the fit is performed with the values obtained at 2 GeV and 4.17 GeV, and , respectively, taken with a 100% uncertainty. The results for and are changed insignificantly, while the value of the nonresonant cross section decreases to pb. The energy dependence of the cross section obtained with modified is shown in Fig. 4 by the dashed curve.

IV Upper limit on the decay
The fitting procedure described above is used in the energy region of resonance. The BABAR BABAR and CLEO CLEO nonresonant data, and the measurement of the cross section at GeV NU (see Fig. 1) are fitted together with the the cross section measurement, pb at GeV KSKLNU . To estimate the nonresonant cross section, the value of is used in the fit. The fitted value of the cross section in the resonance maximum is found to be . The corresponding upper limit is
| (9) |
The cross section in the resonance maximum calculated from pdg is equal to nb. Taking into account the uncertainty of the production cross section we estimate that at 90% CL.
V Summary
Due to the relatively large continuum cross section for the process, the and decays reveal themselves as interference patterns in the cross section energy dependence near the resonances. In this work, existing data on the and cross sections BABAR ; CLEO ; NU ; kskl ; dm1 ; KSKLbabar ; KKbabar ; KSKLNU have been analyzed to obtain the interference parameters. For decay, the cross section in the resonance maximum and the interference phase are found to be
| (10) | |||||
| (11) |
with a statistical significance of 3.2. For the decay, the upper limit on the cross section in the resonance maximum has been obtained:
| (12) |
VI Acknowledgments
The author thanks the BABAR Collaboration for providing data on the invariant mass spectrum and the detector mass resolution near the resonance. This work is supported by the Ministry of Education and Science of the Russian Federation.
References
- (1) M. Ablikim et al. (BES Collaboration), Phys. Lett. B 641, 145 (2006).
- (2) D. Besson et al. [CLEO Collaboration], Phys. Rev. Lett. 96, 092002 (2006) [Phys. Rev. Lett. 104, 159901 (2010)].
- (3) K. A. Olive et al. (Particle Data Group), Chin. Phys. C 38, 090001 (2014).
- (4) G. S. Adams et al. (CLEO Collaboration), Phys. Rev. D 73, 012002 (2006).
- (5) M. Ablikim et al. (BESIII Collaboration), Phys. Lett. B 735, 101 (2014).
- (6) N. N. Achasov and A. A. Kozhevnikov, Phys. Atom. Nucl. 69, 988 (2006).
- (7) G. Li, X.-H. Liu, Q. Wang, and Q. Zhao Phys. Rev. D 88, 014010 (2013)
- (8) J. P. Lees et al. (BABAR Collaboration), arXiv:1507.04638 [hep-ex].
- (9) T. K. Pedlar et al. (CLEO Collaboration), Phys. Rev. Lett. 95, 261803 (2005).
- (10) K. K. Seth et al., Phys. Rev. Lett. 110, 022002 (2013).
- (11) S. Dobbs et al. (CLEO Collaboration), Phys. Rev. D 76, 112001 (2007).
- (12) V. V. Anashin et al. (KEDR Collaboration), Phys. Lett. B 711, 292 (2012).
- (13) D. Besson et al. (CLEO Collaboration), Phys. Rev. Lett. 96, 092002 (2006) [Phys. Rev. Lett. 104, 159901 (2010)].
- (14) D. Cronin-Hennessy et al. (CLEO Collaboration), Phys. Rev. D 74, 012005 (2006).
- (15) R. Gatto, Nuovo Cimento 28, 658 (1963).
- (16) B. Delcourt et al. (DM1 Collaboration), Phys. Lett. B 99, 257 (1981); F. Man et al. (DM1 Collaboration), Phys. Lett. B 99, 261 (1981).
- (17) J. P. Lees et al. (BABAR Collaboration), Phys. Rev. D 89, 092002 (2014).
- (18) J. P. Lees et al. (BABAR Collaboration), Phys. Rev. D 88, 032013 (2013).
- (19) K. K. Seth, S. Dobbs, A. Tomaradze, T. Xiao and G. Bonvicini, Phys. Lett. B 730, 332 (2014).
- (20) V. L. Chernyak and A. R. Zhitnitsky, Phys. Rept. 112, 173 (1984).
- (21) V. L. Chernyak, private communication.