The Observed Distribution of Spectroscopic Binaries from the Anglo-Australian Planet Search
Abstract
We report the detection of sixteen binary systems from the Anglo-Australian Planet Search. Solutions to the radial velocity data indicate that the stars have companions orbiting with a wide range of masses, eccentricities and periods. Three of the systems potentially contain brown-dwarf companions while another two have eccentricities that place them in the extreme upper tail of the eccentricity distribution for binaries with periods less than 1000 d. For periods up to 12 years, the distribution of our stellar companion masses is fairly flat, mirroring that seen in other radial velocity surveys, and contrasts sharply with the current distribution of candidate planetary masses, which rises strongly below 10 MJ. When looking at a larger sample of binaries that have FGK star primaries as a function of the primary star metallicity, we find that the distribution maintains a binary fraction of 434% between -1.0 to +0.6 dex in metallicity. This is in stark contrast to the giant exoplanet distribution. This result is in good agreement with binary formation models that invoke fragmentation of a collapsing giant molecular cloud, suggesting this is the dominant formation mechanism for close binaries and not fragmentation of the primary star’s remnant proto-planetary disk.
keywords:
brown dwarfs - stars: binaries: spectroscopic - stars: fundamental parameters - stars: solar-type - catalogs - radial velocities1 Introduction
Binary systems, in their various guises, yield vital measures for a range of fundamental parameters - mass, radius, luminosity - for the component stars. Studies of the binary population distribution, correlation of orbital elements, and the frequencies of the various forms of multiplicity, can be used to shed light on star-formation processes and evolutionary mechanisms. Systems comprising two or more stars are common. Surveys suggest the incidence of multiplicity is around 45% (Raghavan et al., 2010), perhaps higher than 70% among the more massive stars (Abt et al., 1990; Mason et al., 1998; Preibisch et al., 1999), and somewhat lower (30-40%) for M dwarfs (Fischer & Marcy, 1992).
Doppler searches for extrasolar planets have refined the art of single-lined spectroscopic binary analysis to the point where relative radial velocities (RVs) of the primaries can be measured with precisions at the 1 m s-1 level using both the absorption cell and spectrograph stablisation methods (e.g. Vogt et al., 2010; Jenkins et al., 2013a; Jenkins & Tuomi, 2014; Wittenmyer et al., 2014; Anglada-Escudé et al., 2014). RV measurements that are not tied to an absolute zero point can achieve high internal precision by explicitly removing the need to quantify such effects as convective blue-shift and stellar gravitational red-shift; a clear account of these and other effects is given in Nidever et al. (2002). The target stars for such planetary searches are generally solar-type and are selected to be chromospherically ‘quiet’ in order to minimise the potential for ‘noise’ in any velocity measurement due to starspot activity (see Jenkins et al., 2006). They are also selected to have no resolvable companions to avoid flux contamination.
The Anglo-Australian Planet Search (AAPS) selection criteria for its initial group of stars are discussed in Jones et al. (2002a). The sample considered here comprises 178 F, G and K dwarf stars with declinations south of –20∘ and is complete to V 7.5. There is a requirement that the activity seen in Ca II H&K absorption lines has an index (measured by log - hereafter referred to as ; for details see Jenkins et al., 2006, 2008, 2011) of less than -4.5, and for there to be no known companions within 2 arcsec. The spectroscopic binaries presented in this paper are drawn from this sample.
2 Observations & Data Reduction
2.1 The Primaries: Stellar Characteristics
A summary of the characteristics and masses for the primaries are given in Table LABEL:primaries. Spectral types, B-V colours, magnitudes, and parallaxes for all the stars are taken from the Simbad and HIPPARCOS databases. Metallicities for the stars in this sample are drawn from two sources; spectroscopic metallicities were extracted from Bond et al. (2006) and photometric values were taken from the catalogue of Casagrande et al. (2011). For five of the binary stars we report there are no Bond et al. spectroscopic values, however, these have Casagrande et al. metallicities. In fact, all but one of the primaries, HD39213, have Casagrande et al. measurements, allowing for a uniform and self-consistent set of [Fe/H] estimates to be generated for the sample.
data are used with the activity-age relation given in Soderblom et al. (1991) to provide secondary age estimates for the stars. Note that since our stars were preselected to have values below -4.5, the Soderblom et al. relations are quantitatively the same in this regime to the updated work of Mamajek & Hillenbrand (2008) due to the sparse activity-age data for older dwarf stars. The activity values have been drawn from the studies of Henry et al. (1996), Tinney et al. (2002), Jenkins et al. (2006), and Jenkins et al. (2011), yet even considering these four works, there are still three stars with unknown activities, highlighting the lack of chromospheric activity studies in the southern hemisphere compared to the north. The primary stellar ages, along with the stellar masses, are determined through interpolation of the Yonsei-Yale isochrones (Yi et al., 2001) and uncertainties can be found to reach 100% for the ages of these types of old and Sun-like dwarf stars. Given the 0.06-0.10 dex uncertainty in metallicities, natural variations in stellar activity (for example solar activity variation between –4.75 and –5.10 translates to an age variation from 2.2 and 8.0 Gyr – Henry et al.), uncertainty in the precise form of the age-activity relationship, along with the possibility of flux contamination from the secondary, a number of isochronal mass/age/metallicity points can equally account for a star’s colour and magnitude. In fact, an offset is found between ages derived from the activity indices and those measured from isochrone fitting, whereby the activity derived ages are generally significantly younger than those measured from fitting the isochrones. This result highlights that more work is needed to make ages derived from stellar activity relations, or gyrochronology, and those derived from evolutionary models, more consistent for old field stars. A consideration of these uncertainties enables us to determine a consistent mass range for each star.
| Star | B-V | V | Parallax | MV | Spectral | [Fe/H] | [Fe/H] | log | Mass | |
|---|---|---|---|---|---|---|---|---|---|---|
| (mas) | Type | Casa | Bond | (M☉) | ||||||
| 1 | HD18907 | 0.79 | 5.9 | 31.1 | 3.4 | K2V | -0.46 | -0.500.07 | -5.11 | 1.05 0.15 |
| 2 | HD25874 | 0.67 | 6.7 | 38.6 | 4.6 | G2V | -0.02 | - | -4.95 | 1.00 0.05 |
| 3 | HD26491 | 0.64 | 6.4 | 42.3 | 4.5 | G1V | -0.11 | -0.080.07 | -4.95 | 0.97 0.05 |
| 4 | HD39213 | 0.81 | 9.0 | 16.3 | 5.1 | K0V | - | 0.200.07 | -5.10 | 0.93 0.05 |
| 5 | HD42024 | 0.55 | 7.2 | 18.2 | 3.5 | F7V | 0.19 | - | - | 1.30 0.05 |
| 6 | HD64184 | 0.68 | 7.5 | 30.0 | 4.9 | G3V | -0.18 | -0.230.07 | -4.88 | 0.93 0.05 |
| 7 | HD120690 | 0.70 | 6.4 | 51.4 | 5.0 | G5+V | -0.08 | -0.100.06 | -4.78 | 0.98 0.05 |
| 8 | HD121384 | 0.78 | 6.0 | 25.8 | 3.1 | G8V | -0.39 | -0.400.07 | -5.22 | 0.98 0.10 |
| 9 | HD131923 | 0.71 | 6.3 | 41.9 | 4.4 | G4V | 0.06 | -0.050.08 | -4.90 | 1.05 0.05 |
| 10 | HD145825 | 0.65 | 6.6 | 46.4 | 4.9 | G3V | 0.12 | -0.040.07 | -4.74 | 1.03 0.05 |
| 11 | HD150248 | 0.65 | 7.0 | 37.5 | 4.9 | G3V | -0.13 | -0.110.07 | -4.88 | 0.93 0.05 |
| 12 | HD156274B | 0.76 | 5.5 | 113.6 | 5.8 | G8V | -0.40 | - | -4.95 | 0.83 0.06 |
| 13 | HD158783 | 0.67 | 7.1 | 23.7 | 4.0 | G4V | 0.05 | -0.050.07 | -4.91 | 1.04 0.05 |
| 14 | HD162255 | 0.66 | 7.2 | 24.9 | 4.2 | G3V | 0.17 | -0.010.08 | - | 1.12 0.08 |
| 15 | HD169586 | 0.55 | 6.8 | 21.4 | 3.5 | G0V | 0.32 | - | -4.92 | 1.25 0.05 |
| 16 | HD175345 | 0.57 | 7.4 | 21.3 | 4.0 | G0V | -0.16 | - | - | 1.05 0.05 |
2.2 Determination of Radial Velocities
2.2.1 UCLES Data
Observations were made at the 3.9m Anglo-Australian Telescope using the University College London Echelle Spectrograph (UCLES), operated in its 31 lines/mm mode. High precision Doppler measurements are made possible by the use of an iodine absorption cell that permits detailed modeling of the spectrograph Point Spread Function (PSF). The reader is referred to Butler et al. (1996; 2001) for a detailed description, however, the procedure is outlined below.
Multi-epoch spectra at a resolution of R 45,000 are obtained for each star with the I2 cell mounted behind the UCLES, imprinting the stellar spectra with thousands of iodine absorption lines in the 5000-6200 Å region. Each spectrum can be synthesised from a product of a Doppler-shifted copy of a pure stellar spectrum for the star in question (a higher resolution stellar template spectrum from which the spectrograph PSF has been removed) and an iodine absorption spectrum, all of which is convolved with the spectrograph’s PSF at the time of the observation. A least squares fitting process matches this synthetic spectrum with the observed spectrum, and determines up to 14 free parameters (one being the Doppler shift, one the wavelength dispersion, and the remainder associated with the detailed PSF profile). This fitting process is carried out on 2 Å chunks of the spectrum between 5000-6200 Å and the resulting velocities are weighted by the gradient (F/) of the spectral profile for each chunk. The mean of these weighted velocities, corrected for the Earth’s motion relative to the Solar System barycentre (McCarthy, 1995), represents the RV for that observation. A barycentric correction is also applied to the Julian dates. The internal uncertainty is obtained from the standard deviation of the velocities. This technique has demonstrated consistently that 3 ms-1 precision is achievable down to the V=7.5 magnitude limit of the survey for suitably inactive stars over the long term (Jones et al., 2002b). The barycentric Julian dates and RV data of our sources are given in Table 3.
2.2.2 HARPS Data
In order to supplement the velocities measured using the UCLES spectrograph, we performed a search of the ESO Archive Facility to determine if any of these stars had high precision ESO-HARPS measurements that could be used to increase the phase coverage of our orbits. The search revealed that six of targets had been observed with HARPS multiple times, such that the inclusion of the velocities yielded much better constraints on the binary orbits. The HARPS RV data is also shown in Table 3.
At this point it is worth briefly discussing the HARPS strategy for measuring precision RVs from high resolution and high S/N echelle spectra. The HARPS data is automatically processed by the HARPS-DRS version 3.5, with the reduced and analysis quality data on the Advanced Data Products page of the ESO Archive website. The actual reduction and analysis method itself is based in general on the procedure explained in Baranne et al. (1996). Unlike the method employed by the AAPS using UCLES, no iodine cell is used by HARPS, but instead, precision RVs are measured by maintaining the highest stability possible over the long term, but placing the spectrograph in a vaccuum tank to maintain the pressure and temperature as stable as possible, and feeding the light to the spectrograph using optical fibres.
The actual RV measurements are not performed in chunks like they are using UCLES, but each entire echelle order is used to measure the RV. A weighted binary mask is constructed that synthetically mimics the position of an absorption line in the star (Pepe et al., 2002), and a weighted cross-correlation between the stellar spectrum and the binary mask gives the RV. The mean of the RV for each order gives rise to the final absolute RV measurement from the star, with the uncertainty measured following the procedure in Bouchy et al. (2001). The stability of the spectrograph is maintained by using a calibration Thorium-Argon lamp, that is also simultaneously fed to the spectrograph using another fibre, allowing any drifts in the wavelength solution to be measured at the 0.1 ms-1 level (Lovis & Pepe, 2007). The drift is then removed from the measured RV to get the most precise value, however a stability of less than 1 ms-1 has been found for HARPS data over the long term (e.g. Lo Curto et al., 2010).
2.3 Orbital Parameters
For the analysis of spectroscopic binaries the task is to provide a set of orbital parameters (period, P, eccentricity, e, periastron angle, , time of periastron passage, Tp, and the projected semi-major axis of the primary, ap ) - and a velocity offset, , that optimise the fit of the equation
| (1) |
to the observations of line-of sight radial velocity, , at true anomalies (derived from the observed times, t, through iteration of Kepler’s equation). A least-squares minimisation procedure, invoking several IDL routines, is used to fit the equation.
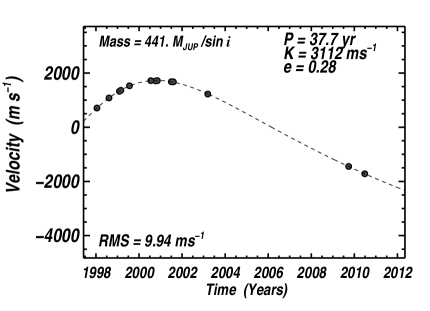
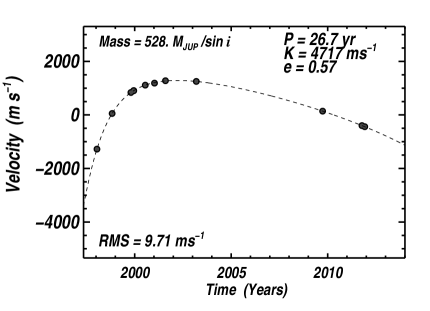
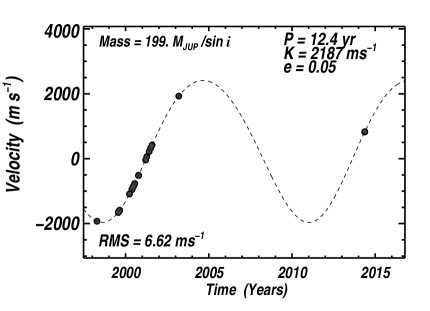
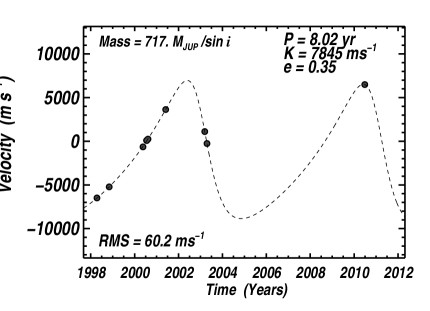
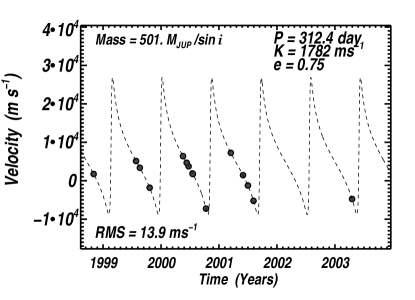
In the search for an orbital solution, periods are initially identified via Lomb-Scargle periodogram analysis (Lomb, 1976; Scargle, 1982). Orbital solutions are plotted in Fig. 1 and summarized in Table LABEL:orbit (i & ii). Where the RV data have a monotonic variation, or only one extremum occurs without any clear inflection in the RV variation to constrain a second extremum (HD 18907, HD 25874, HD 26491, HD 131923, HD 156274B), convergence is reached for a number of different periods. In these cases, where the period is clearly greater than the duration of the observations, and where periodogram analysis is least effective, we consider only the minimum orbital period in our solutions. Periodograms are shown (Fig. 2) for all the targets where the RV phase coverage is nearly a cycle or more. Where the sampling is sparse, aliasing introduces spectral power over a range of frequencies and is particularly marked for HD 64184 which has just eight RV observations and for HD 121384 due to the highly eccentric nature of the orbit (see O’Toole et al., 2009). This is perhaps a reminder that data sets should comprise more than a dozen observations for the periodogram technique to be properly effective (Horne & Baliunas, 1986). The period inferred from the orbital solution in each case is marked with a vertical dashed line. Identification of periods is least effective for HD 131923 and HD 156274B, where the phase coverage is less than one cycle. Nevertheless, the inflections in the RV variation enable a robust Keplerian period to be found.
| Star | P | e | Tp | K | a | rms | ||
|---|---|---|---|---|---|---|---|---|
| days | deg | JD- | m/s | au | m/s | |||
| 2450000 | ||||||||
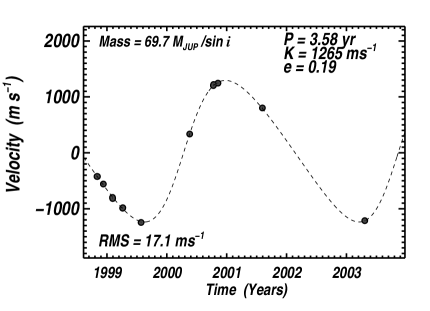
| HD39213 | 1309 159 | 265 23 | 0.2 0.1 | 1636.7 2.8 | 1265 273 | 2.3 0.3 | 1.97 | 17.1 |
| HD42024 | 76.26 0.03 | 347 87 | 0.19 0.01 | 1154.8 0.7 | 3228 133 | 0.38 0.01 | 3.22 | 11.8 |
| HD64184 | 17.863 0.002 | 184 84 | 0.249 0.004 | 949.50 0.05 | 12910 439 | 0.130 0.002 | 0.93 | 2.39 |
| HD120690 | 3800 18 | 339 55 | 0.34 0.01 | 1140 11 | 6325 100 | 4.73 0.02 | 27.7 | 15.2 |
| HD121384 | 178.7 0.1 | 182 28 | 0.84 0.01 | 852 1 | 10887 2201 | 0.61 0.02 | 7.19 | 15.1 |
| HD150248 | 3272 29 | 356 68 | 0.67 0.04 | 2365 13 | 1995 12 | 4.36 0.01 | 3.19 | 3.55 |
| HD158783 | 4535 225 | 170 46 | 0.05 0.05 | 986 27 | 2133 527 | 5 1 | 3.03 | 6.62 |
| HD162255 | 48 1 | 51 5 | 0.06 0.01 | 1017.1 0.1 | 16223 3419 | 0.27 0.01 | 2.49 | 7.81 |
| HD169586 | 2935 119 | 59 10 | 0.4 0.1 | 2653 22 | 7857 2708 | 4.3 0.2 | 11.5 | 60.2 |
| HD175345 | 312.4 0.1 | 277 14 | 0.75 0.05 | 1256 11 | 16099 3675 | 0.92 0.01 | 3.44 | 13.9 |
| Star | Pmin | e | Tp | K | a | rms | ||
|---|---|---|---|---|---|---|---|---|
| days | deg | JD- | m/s | au | m/s | |||
| 2450000 | ||||||||
| HD18907 | 13770 3528 | 314 34 | 0.28 0.07 | 865 9 | 3112 1903 | 13 4 | 4.31 | 9.94 |
| HD25874 | 71108 2308 | 274 10 | 0.8 0.1 | 4382 2453 | 2578 253 | 33 2 | 4.16 | 4.67 |
| HD26491 | 9748 1223 | 221 38 | 0.57 0.05 | 250.9 0.5 | 4717 2969 | 10 2 | 3.16 | 9.71 |
| HD131923 | 7495 334 | 15 79 | 0.72 0.02 | 528 30 | 5784 821 | 8.7 0.4 | 21.8 | 8.60 |
| HD145825 | 6024 163 | 149 53 | 0.33 0.02 | 1095 13 | 669 10 | 6.54 0.04 | 14.4 | 7.68 |
| HD156274B | 191455 13707 | 30 85 | 0.0 0.1 | 5222 10588 | 692 55 | 63.5 0.2 | 11.4 | 5.95 |


3 Discussion
3.1 The Binary Stars
HD 18907: A high proper-motion star classed as K2 V (Gray et al., 2006) though consistently classified as a G5 IV prior to this (eg. Evans et al. 1957), its colour and magnitude confirm that it is evolving away from the main sequence. Chromospherically quiet (= -5.11, Jenkins et al. 2006), HD 18907 is most likely an old star with an age in excess of 12 Gyr which agrees with isochrone fits based on metallicities derived through spectral and photometric analysis - for example [Fe/H]=-0.50 dex from Bond et al. and -0.46 dex from Casagrande et al. This age/metallicity scenario translates to a stellar mass estimated to be 1.05 M☉. Limited phase coverage of the RV data means that the period isn’t well constrained so the orbital solution converges to a number of fits with periods upwards of 10000 days. The shortest period orbit translates to a secondary minimum mass (Ms ) of 0.42 0.10 M☉.
HD 25874: Classified as a G2V by Gray et al. (2006) and listed by (Dommanget & Nys, 1994) in the Catalogue of Components of Double and Multiple Stars (CCDM), it is identified along with a V = 12 companion (position angle 225∘, separation 29 arcsec, 1941) as a common proper-motion pair. Jenkins et al. derive an index of -4.95, suggesting an age of about 4 Gyr, while Casagrande et al. find a metallicity of [Fe/H] =-0.02 dex, suggesting an age of 9.2 Gyr, in agreement with the subgiant designation. Given the age-metallicity range, a mass of 1.00 0.05 M☉ is inferred for the primary. Since the phase coverage from both the AAPS and HARPS is limited, a variety of solutions exist, however we find the best solution to the data gives rise to a very long period low-mass stellar companion, with a period of nearly 200 years and a minimum mass of 0.33 0.07 M☉.
HD 26491: This is classified as a G1V by Gray et al. (2006), and previously consistently classified as a G3 (Houk & Cowley, 1975; Evans, 1964), and is identified by Decin et al. (2000) as having a Vega-like IR excess. Bond et al. derive a spectroscopic metallicity of [Fe/H] = -0.08 dex, which is larger than the Casagrande et al. value of -0.11 dex. An age of 10.5 Gyr is indicated by the isochrone fit which is somewhat older than the 5 Gyr inferred from an index of -4.95 (Henry et al.). Accordingly a mass of 0.97 0.05 M☉ is assigned to this high-proper motion star. Given the nature of the RV variation (Fig. 1), orbital solutions with periods significantly longer than 7000 days are possible, and in all cases the eccentricity is greater than 0.5. An orbital period of 9747.5 1223.2 days (e = 0.57) translates to a secondary minimum mass of 0.50 0.15 M☉.
HD 39213: The Bond et al. metallicity of this K0 dwarf (Houk, 1982) is found to be [Fe/H]=0.200.07 dex. The measured index of -5.10 relates to an age of 8 Gyr and by fitting a range of isochrones with ages from 7.5 and 10 Gyr respectively, a mass range of 0.93 0.05 M☉ is inferred. Though the orbital parameters appear tightly defined (helped by the RV data having a phase coverage close to one cycle), the residuals are relatively high (rms=17.1 ms-1) and the of 1.97 suggests the fit is significant at under the 5 per cent level. A Keplerian period of 1300 days and eccentricity of 0.2 translate to a companion with a minimum mass of 0.07 0.01 M☉ – potentially a brown dwarf if the orbit is being seen close to edge on.
HD 42024: Given a Casagrande et al. metallicity of 0.19 for this star, isochrones ranging in age from 2.5-4 Gyr suggest a mass of 1.30 0.05 M☉ for this F7 dwarf (Houk, 1978), though the lack of an index deprives us of a secondary age indicator. Phase coverage is broad and the RV values fold convincingly around a period of 76.26 days (Fig. 1) with well defined orbital parameters to yield a companion minimum mass of 0.066 0.003 M☉, another possible brown dwarf companion. Residuals are above average with an rms for the fit of 11.8 m s-1.
HD 64184: This G3 dwarf (Gray et al., 2006) is listed in SIMBAD as a variable (V = 7.49-7.55), though no variability flag is marked in HIPPARCOS. The Bond et al. and Casagrande et al. metallicities are in close agreement at -0.23 and -0.18 dex respectively, and an age between 7-10 Gyr is indicated by the isochrone fits, somewhat older than the 4 Gyr inferred from the index (-4.88; Henry et al.). The stellar mass is estimated at 0.9 0.1 M☉. The eight RV measurements fold convincingly around a period of 17.86 days (Fig. 1) and the orbital parameters, which are tightly defined by the broad phase coverage, suggest a companion with an Ms of 0.170 0.001 M☉ and an orbital separation of 0.130 0.002 AU. With a sufficiently high orbital inclination (87∘), the secondary could provide sufficient obscuration of the primary’s surface for a variation in V of 0.03 magnitudes, given that a mass of 0.160 M☉ would be no brighter than M at 6 Gyr - (Baraffe et al., 1998).
HD 120690: This G5+V, as classified by Gray et al. (2006), has an index of -4.78 (Henry et al.), equivalent to an age of 3 Gyr. Metallicities are found to be -0.10 and -0.08 dex from Bond et al. and Casagrande et al. respectively, suggesting an age from the isochrone fits somewhere between 6.5 and 9 Gyr, from which a stellar mass of 0.98 0.05 M☉ is inferred. While limited phase coverage of RV data means that the orbital period is only poorly constrained by periodogram analysis (1900 500 d), a full orbital solution yields tightly defined parameters. A Keplerian period of 3799.98 18.12 days and an eccentricity of 0.34 indicate a secondary minimum mass of 0.59 0.01 M☉. With the secondary contributing upwards of 0.4 per cent of the flux at 5500 Å, the central region over which radial velocities are determined, contamination of the primary spectrum could be a contributory factor. It could also affect the star’s colour-magnitude location making it appear redder (and apparently more evolved) possibly accounting for an element of the age discrepancy mentioned above. These issues are considered further in Section 3.4. We do note that a second signal may be present in the data, with a period of 531 days and a semi-amplitude of 32 m s-1, which if it were a genuine Doppler signal, would give rise to a planet with mass around 1 MJ. The addition of this signal can serve to decrease the rms by a factor two.
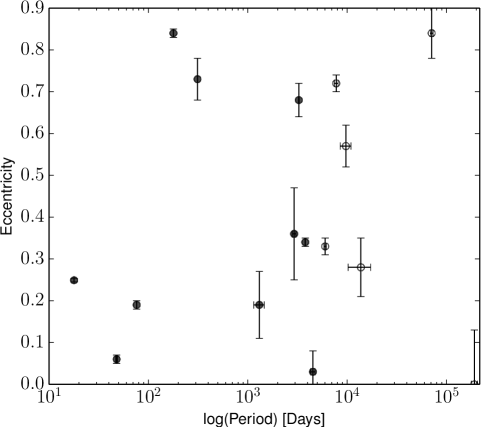
HD 121384: Classified as G8V (Gray et al., 2006), and listed in Dommanget & Nys (1994) along with a common V = 13 proper-motion companion (position angle 45∘, separation 31 arcsec, 1941), this star is identified by Oudmaijer et al. (1992) and by Aumann & Probst (1991) as having a Vega-like IR excess. Bond et al. find a [Fe/H] value of -0.400.07 dex, in excellent agreement with the value found by Casagrande et al. of -0.39 dex, yet in good agreement within the uncertainties with Bond et al. The colour and magnitude are well fit by 7-10 Gyr isochrones indicating that the primary component is indeed evolving away from the main sequence - a view further evidenced by the low level of activity (-5.22, Henry et al. 1996). Accordingly its stellar mass is estimated at 0.98 M☉. The 179-day period is sharply defined by the broad phase coverage and the Keplerian solution, albeit with a relatively large rms of 15.1 m s-1. The data indicate there is a 0.17 0.01 M☉ companion orbiting with an eccentricity of 0.84. An eccentricity of this magnitude (Fig. 4) places this binary in the extreme upper tail of the eccentricity distribution for systems with periods 1000 days (Duquennoy & Mayor, 1991, Fig. 6a) and when combined with the window function, makes the detection of this signal from periodogram analysis alone very difficult (see Fig. 2).
HD 131923: The colour-magnitude location is well fit by 9-12 Gyr isochrones with metallicities of -0.05 and 0.06 dex for Bond et al. and Casagrande et al. respectively. These close to solar values suggest that this high proper-motion G4V star (Gray et al., 2006) is starting to evolve away from the main sequence; by contrast, the age inferred from its index (-4.90, Henry et al. 1996) is only 4 Gyr. Given the monotonic variation in RV measurements, the period is poorly defined, though a 7496 day Keplerian solution emerges with an eccentricity of 0.72. The rms for the fit is above average (9 m s-1) and this is reflected in a of 21.8. With an inferred mass for the primary of 1.05 0.05 M☉, the orbital parameters translate to a secondary minimum mass of 0.52 0.06 M☉. The star is identified in the HIPPARCOS catalogue as a ‘suspected non-single’ object.
HD 145825: This G3 dwarf (Torres et al., 2006) again appears to have a metallicity consistent with solar ([Fe/H]=-0.04 and 0.12 dex from Bond et al. and Casagrande et al.) and isochrone fitting suggests an age under 3 Gyr, which is consistent with the relatively high level of activity (-4.74, Henry et al. 1996). Consequently the stellar mass is estimated at 1.03 0.05 M☉. Recent RV measurements have improved the phase coverage, leading to a more sharply defined period of 6024 163 days. With a minimum mass of 0.06 0.01 M☉, this adds to the list of brown dwarf candidate companions in our sample.
HD 150248: Consistently classified as a G3V (Gray et al., 2006; Houk, 1978; Evans et al., 1957), the sub-solar metallicity of [Fe/H]=-0.11 dex from Bond et al. and -0.13 dex from Casagrande et al. suggest an age from isochrone fits of 7 Gyr, which contrasts with an activity-inferred age of 4 Gyr ( activity of -4.88 from Henry et al.). A mass of 0.93 0.05 M☉ is estimated for the star. The orbital parameters are fairly well defined, with a period of 3272.4 28.7 days and eccentricity of 0.67, relating to a companion with a minimum mass of 0.10 0.02 MJ.
HD 156274B: Listed as a multiple-star system in Dommanget & Nys (1994), comprising four known components: Gl 666A, a G8V (Eggl, 2013), Gl666B, an M0 dwarf (separation 7.5 arcsec, 1880), a V=12.5 companion and a 14.0 companion (respectively 279∘, 41.8 arcsec, 1900; 30∘, 47 arcsec, no year). Our RV measurements indicate that Gl666A is itself a spectroscopic binary. No spectral metallicity was determined but Casagrande et al. find a metal-poor value of [Fe/H]=-0.40 dex. Such a value demands isochrones of 9-10 Gyr, though the star would appear to be no older than 6 Gyr judging from its index (-4.95, Jenkins et al.) in which case isochrones with metallicities of 0.1-0.2 dex provide complementary fits. These two scenarios translate to a stellar mass estimated at 0.83 0.06M☉. The best fit period is found to be 524 years, implying a secondary minimum mass of 0.20 0.03 MJ, the fit has an rms of 5.95 m s-1, however we note that the uncertainties on the measured quantities from the bootstrap are formal to the solution presented. It is clear that this is the minimum best fit to the data and so the true solution could be very different and therefore properties like the time of periastron passage are essentially unconstrained.
HD 158783: This G3/G5 dwarf (Houk & Cowley, 1975) appears to have a metallicity slightly under solar (-0.05 dex from Bond et al. and 0.05 dex from Casagrande et al.) and isochrone fits demand an age of 8–10 Gyr, significantly above the 4 Gyr age inferred from the star’s index (-4.91, Henry et al. 1996). A stellar mass of 1.04 0.05 M☉ is inferred. Orbital parameters are tightly defined given the limited phase coverage of the RV measurements and the Keplerian fit is significant at the 20 per cent level. A period of 4534.78224.92 days and zero eccentricity translate to a secondary minimum mass of 0.20 0.02 M☉.
HD 162255: Though no index is given for this G3 dwarf (Houk & Smith-Moore, 1988), isochrone fits based on -0.01 dex (Bond et al.) and 0.17 dex (Casagrande et al.) metallicities suggest an age ranging from 5-9 Gyr, translating to a stellar mass of 1.12 0.08 M☉. The eleven RV measurements fold convincingly around a 47.95-day period, indicating a companion minimum mass of 0.333 0.001 M☉.
HD 169586: This G0V star Houk (1982) appears metal rich ([Fe/H] = 0.32 dex, Casagrande et al.) suggesting an age around 2-4 Gyr, which is in agreement with that derived from the index (-4.92, Henry et al. 1996); the stellar mass is estimated at 1.25 0.05M☉. The acquisition of two of the most recent RV measurements has defined a relatively sharp extremum in what was originally a monotonic RV variation so that a 2935-day orbit with an eccentricity of 0.35 appears well constrained. Given that the secondary has a minimum mass of 0.68 0.22 M☉ (equivalent to an MV = 9.4 companion) contamination of the primary’s spectrum has almost certainly taken place, and is possibly a reason why the rms for the fit (60.2 m s-1) is so large, along with the large . Nevertheless the existing RV measurements clearly indicate that the primary has one or more companions.
HD 175345: Listed in Dommanget & Nys 1994 as having a V=14.2 proper motion companion (B 413: 252∘, 5.4 arcsec, 1927), our measurements indicate that this G0 dwarf (Houk & Smith-Moore, 1988) is itself a spectroscopic binary. There is no index for this star and the isochrone fits based on its Casagrande et al. metallicity of [Fe/H]=-0.16 dex gives an age range of 4-9 Gyr along with an inferred mass of 1.05 0.05 M☉. There is a clear fold of the RV data around a 312-day period so orbital parameters are tightly constrained, however the residuals are relatively large (rms = 14 m s-1) making the fit statistically poor, even though the is fairly low (3.44). With a minimum mass of 0.48 0.08 M☉, (equivalent to MV = 9.5 or brighter) the secondary is again a source of spectral contamination.
The locations of these stars on a HIPPARCOS-based HR diagram, along with a summary of the isochrone fits, are shown in Fig. 3 a & b, respectively. We also show the distribution of eccentricity versus period in Fig. 4. We find that the companions to HD121384 and HD175345 have very high eccentricities for companions with orbital periods below 1000 days, placing them in the extreme upper tail of the distribution in this parameter space. We also find a few of the longer period companions that have not been fully constrained yet due to the limited baseline of the data have moderate to high eccentricity. Although the periods of the orbits could be significantly longer, the eccentricities are rather well constrained with the current data in hand, assuming a single Keplerian fit. The one obvious exception is HD156274B which currently only exhibits a linear trend with velocity over time, and although we fit this will a circular model, this could very well be highly eccentric.


3.2 High Contrast Observations
A number of the binaries we have discovered in this work have been followed up using adaptive optics systems to search for direct confirmation of the companions. Obtaining orbital motion from direct images of low-mass companions to bright Sun-like stars, especially when coupled with RV information, can yield dynamical masses for the companions (Liu, 2007). Combining dynamical masses with photometric colours and spectra can allow evolutionary and atmospheric properties to be well constrained and models to be tested (e.g. Dupuy et al., 2009).
In Jenkins et al. (2010) we observed two of the host stars we report new binaries for in this work, HD25874 and HD145825. In that work we found contrast ratios of greater than 11 magnitudes at separations of only 0.5′′ using the VLT NAOS CONICA instrument (Rousset et al., 2003) in Simultaneous Differential Imaging mode. Although a tentative detection of the companion around HD25874 was discussed, further analysis revealed this to be a probable artifact of the reduction and analysis procedure, and therefore no companion detection was conclusively made for either of these stars with mid-T dwarf masses of around 50 MJ or so. Some of the other stars we report companions for are included in our ongoing NACO/NICI imaging campaign.
3.3 HIPPARCOS Astrometry
Out of these sixteen binaries, four (HD 39213, HD 120690, HD 121384, and HD 175345) have well constrained periods in the range 0.5–6 years, making them suitable candidates for analysis of their HIPPARCOS astrometry. In order to determine if there are any astrometric signatures that would allow us to place additional constraints on our orbital parameters, we extracted the astrometric data from the HIPPARCOS database (van Leeuwen, 2007) and derived positional residuals (, ). In Fig. 5 we show these with associated errors for HD 175345.
There are no significant variations obvious in the plots for the four candidates, though in the case of HD 175345, periodogram analysis reveals significant power at around 320 days. (c.f. a 312-day period from RV analysis). Failure, however, of these data to fold around either period suggests that the spectral power owes more to sampling of the data (which have a strong 300-day element) than to any possible astrometric signature. The significance of the astrometric variations is clearly low and we do not attempt further to constrain our orbital parameters using these data.

3.4 Secondary Flux Contamination
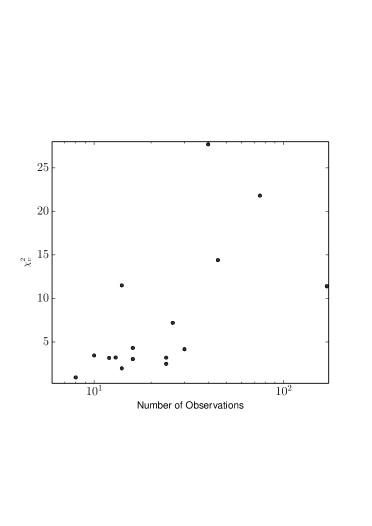
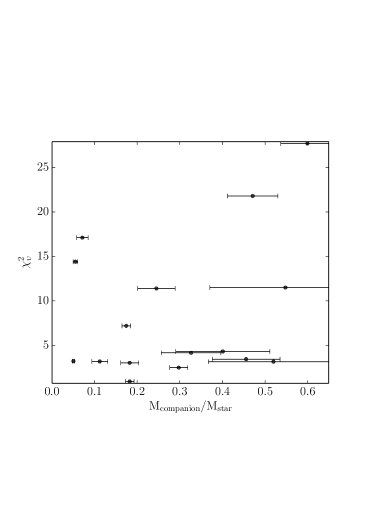
In those cases where the orbits are fully constrained and the secondary minimum mass is 0.5M☉ (HD 18907, HD 26491, HD 120690, HD 131923, HD 169586 and HD 175345) the contribution of the secondary to the overall flux is at least 1 per cent and the signature of this contribution is found in the quality of the orbital solutions: the rms scatter of these stars is generally much higher than the internal measurement uncertainty. The reason for this is that flux from the secondary, which is contaminating the primary’s spectrum, will be associated with a different radial velocity at each of the subsequent observations from that when the template spectrum was acquired. The radial velocity fitting process relies on the assumption that the primary’s spectrum is modified only by the Doppler shift of the primary and the spectrograph PSF variation. Consequently, less than optimal solutions can be expected when a faint secondary contribution to the primary’s spectrum is present at variable Doppler shifts. In essence, the fitting process matching the observed and synthetic spectra would be expected to generate larger measurement errors, and this is the case particularly for HD 169586. Fig. 6 shows how the quality of the orbital solutions - measured by the significance of the fit - varies with the number of observations (plot a) and the binary minimum-mass ratio (plot b). While no correlation appears to be evident between the reduced Chi-squared and companion mass ratio, in general, the statistical significance of the fits appear to indicate a marked deterioration as the number of data points increase. This could reflect the fact that these are the systems exhibiting the most stellar flux contamination and therefore they required more observations in order to better constrain their orbits, or, another possibility is that these systems also contain additional companions, either brown dwarfs or planets, that are giving rise to mixed signals that are being manifest once enough RV measurements have been acquired.
Given the precision with which radial velocities can be obtained by the AAPS, we could speculate that where low M values yield statistically poor fits (HD 39213, HD 121384), the orbital inclinations are low and that the companions have masses high enough for spectral contamination to be taking place. The large errors in RV measurements for HD 39213 and HD 156274 lend credence to this scenario, though this isn’t the only explanation. It is also possible that these are multiple systems for which a double-star solution simply isn’t appropriate. Moreover, enhanced activity in any of these stars (bearing in mind that the index is merely a ‘snapshot’ measurement) would mean that the internal errors would not properly reflect the uncertainty in the RV measurements. This is why it is pragmatic to use relatively inactive stars in Doppler searches. For the targets considered here, enhanced activity is unlikely to be the cause: Henry et al. (1996) estimate that 90 percent of the time a single measurement for a solar-type star is sufficient to identify correctly if it has an activity greater, or less, than = -4.75, and all but one of the stars have indices lower than this. Where the measurement errors are low but the orbital solutions are statistically weak (HD 121384 and HD 162255), the most convincing explanation is that these systems comprise more than a single companion.

The effect of binarity on the colour and magnitude of a primary of any age and metallicity can be modelled easily using the Yonsei-Yale isochrone data. Fig. 7 shows the variation in colour and magnitude for a 5.5 Gyr, solar metallicity isochrone ranging in mass from 0.88-1.20 M☉ (solid curve). The effect of adding a secondary is marked by the dotted curves at various mass intervals, with each point representing a secondary companion that increases in mass from 0.5-1.0 Mp in steps of 0.05 Mp.
For companions below 0.55 Mp the effect of binarity on the colour-magnitude location of the primary is negligible. The effect of a 0.70 Mp companion is to make the primary appear redder and brighter by around 0.05 and 0.3 magnitudes respectively, for a solar-mass star, with slighter larger and smaller values for less massive and more massive primary stars, respectively. Such an effect generally makes the unresolved pair appear older and/or more metal rich; however if the primary itself is evolving away from the main sequence, the companion will make the pair appear ‘bluer’. These effects will complicate the process of mass estimation. For example, the presence of a 0.70Mp companion translates effectively to a systematic error of 0.04M☉ in the mass of the primary. This is of the order of the error in mass due to the age-metallicity uncertainties. The orbital solutions indicate binary mass ratios generally significantly less than unity (HD 169586 being the exception) so that the effect of binarity on the determination of the primary mass (and by extension the secondary mass) is negligible. Clearly, for many of the binaries in our sample, the uncertainty in secondary mass is due principally to poorly constrained orbital parameters.
3.5 Mass Distribution
The binaries and planetary companions to solar-type stars reported by the AAPS provide an opportunity to examine, from a single radial velocity survey, the distribution of M values for a mass regime extending from Jovian through brown dwarf to sub solar in value.
In order to derive a more meaningful distribution of minimum-mass ratios, we need to impose a period cut-off on both the planetary and binary companions so that we count only those companions within a certain distance of the primary stars. As a rule, planetary candidates are announced when the phase coverage of the RV data are close to one orbital period. For the AAPS, which has been operating since 1998, we can say that the inventory of exoplanet candidates orbiting with periods up to 12 years (i.e. out to around the orbit of Jupiter in the solar system) is reasonably complete down to the level permitted by a Doppler precision of 3ms-1, i.e. complete for Jupiter-mass objects and above. Brown dwarf and low mass stellar companions induce larger reflex velocities making them easier to detect over a greater range of distances and periods. In order to compare directly with Duquennoy & Mayor (1991), six out of the sixteen binaries have periods greater than 12 years and these need to be excluded from our count.
Ten remaining binaries out of a sample of 178 stars is around half of that expected from the period distribution given in Fig. 13 of Raghavan et al. (2010), when normalised by the multiplicity fraction, though there are several reasons for this. First, our sample excludes all known short-period spectroscopic binaries with separations less than 2 arcseconds; second, all binaries beyond 2 arcseconds detected using Hipparcos data are excluded from our sample; third, ‘double-lined’ spectrum binaries are immediately removed as soon as they are recognized; fourth, our requirement for the AAPS target stars to have an index below -4.5 has the effect of filtering out some short-period, chromospherically active binaries – RS CVn/W UMa types for example – though admittedly these are few in number. The observed distribution in minimum masses, corrected for completeness for periods up to 12 years, is shown in Fig. 8.
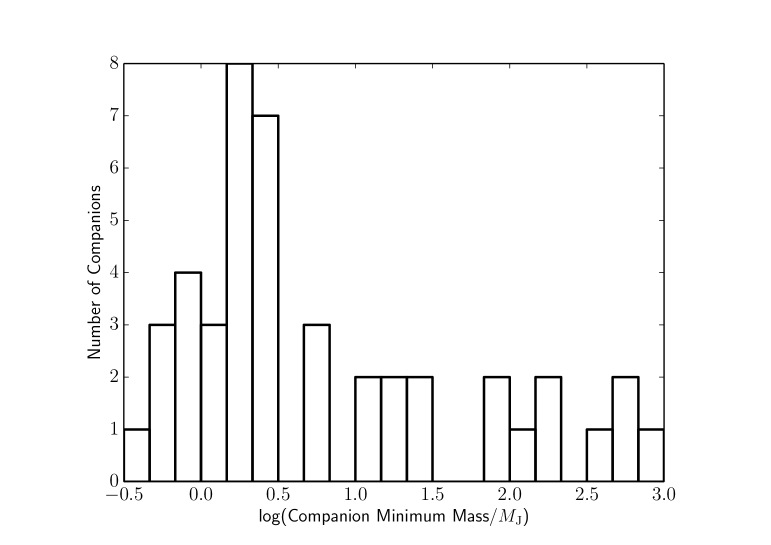
The main features seen in this P 12 yr distribution are (i) a sub-stellar companion mass function rising strongly below 10 MJ, (ii) a comparatively flat distribution of stellar companions, and (iii) a region from 20-70 MJ (corresponding to the brown dwarf regime) where relatively few objects are found despite a selection bias in the observations making them easier to detect than planets. Note that although objects do exist in this part of the parameter space (e.g. Jenkins et al., 2009), the term brown dwarf desert was given to highlight the relative paucity in comparison to planets and stellar objects (Marcy & Butler, 2000). Such features accord with RV observations elsewhere: the CORALIE, Keck, and Lick surveys all report the same form of sub-stellar function while the ‘flat’ stellar distribution mirrors that seen in Duquennoy & Mayor (1991, Fig. 11) This similarity comes about despite the fact that the various RV surveys work with different samples and operating strategies. The form of the distribution of planetary and stellar companions is considered to reflect the different formation mechanisms for these two populations (respectively accretion in dissipative circumstellar disks and gravitational instabilities in collapsing cloud fragments) and their consequent evolution. The relatively small number of brown dwarf companions has been noted elsewhere (for example Halbwachs et al. 2000; Butler et al. 2001; McCarthy 2001) and may be a reflection of a formation mechanism different again from that of stars or planets, though Armitage & Bonnell (2002) argue that its existence is a consequence of orbital migration of brown dwarfs within an evolving proto-stellar disk.
The question arises as to what effect a correction for inclination would have on the observed distribution. The simplest (crudest) correction is to scale masses up by a factor of 1/. This doesn’t alter the form of the distribution, nor in this case the total number of objects that can be regarded as brown dwarf candidates - just those objects out of the survey that can be regarded as such. Clearly, a knowledge of the precise form of the mass distribution for this (or any) RV survey is precluded until inclinations can be determined accurately via sub-milli-arcsecond astrometric surveys such as GAIA (Sozzetti et al., 2001) and SIM (Sozzetti et al., 2002), though it would take a remarkable confluence of inclinations for the objects uncovered by the AAPS to alter the underlying distribution of masses. Indeed, recent attempts have been made to recover the ’true’ mass distribution (Lopez & Jenkins, 2012), with very few of the sub-10 MJ objects moving above this mass limit.
3.6 Metallicity-Mass Distribution
One of the most interesting features to emerge from the early study of exoplanets, is the dependence of gas giants to be found orbiting stars with super-solar metallicities (Gonzalez, 1997; Fischer & Valenti, 2005; Sousa et al., 2011). This result is a key prediction of the core accretion scenario for planet formation (Ida & Lin, 2004; Mordasini et al., 2012). However, it seems that this bias towards the most metal-rich stars is only found for gas giants and not lower-mass rocky planets (Udry et al., 2007; Buchhave et al., 2012; Jenkins et al., 2013b). Therefore, given there is a clear mass dependence as a function of metallicity, it is interesting to test what the metallicity distribution looks like for binaries drawn from a representative sample.
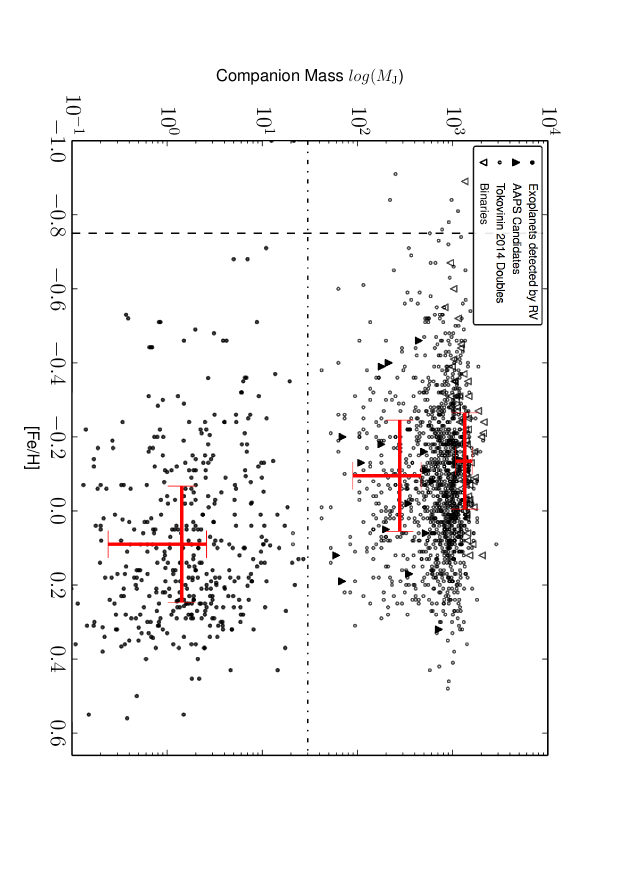
In Fig. 9 we show the distribution in the metallicity-mass plane of planets, brown dwarfs, and stellar binaries that have been detected mostly by the radial velocity method, with a large clutch of the stellar binaries being drawn from the sample of F,G, and K stars from Tokovinin et al. (2014). The iron abundances used in this plot were taken from high-resolution spectral analysis where possible, generally from the published papers for the detected exoplanets, with the Tokovinin et al. primary star metallicities being drawn from Casagrande et al. (2011). The giant planet metallicity bias discussed above is evident here, where the sample mean cross-hairs are clearly offset from the sample means at higher masses (i.e. above the horizontal dot-dashed line). The brown dwarf and stellar binaries have mean values in good agreement with each other, both with sub-solar values, in comparison to the exoplanet primary mean distribution that is significantly above the solar value.
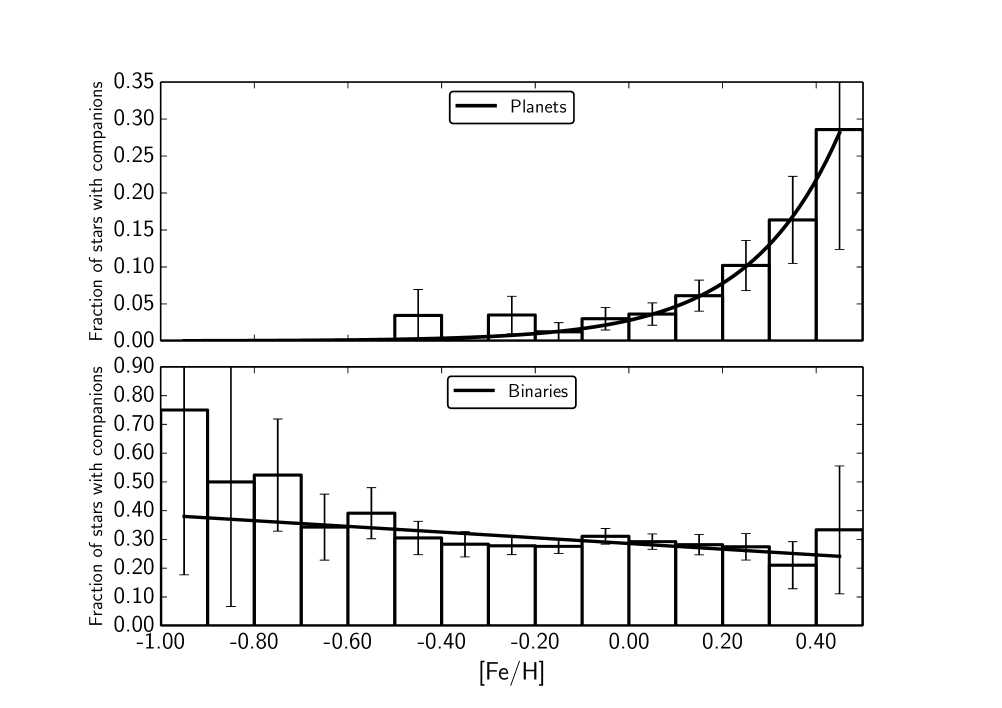
In Fig. 10 we show the distribution of exoplanets and binaries as a function of primary star metallicity. We used the large sample of Fischer & Valenti (2005) for the exoplanet distribution and again the Tokovinin (2014) sample for the binary population. The biases in both of these samples are discussed in each of the works, yet they are large enough and have been examined well enough that they can be thought of as good representations of their respective field populations. The full Tokovinin et al. sample was not included since we wanted to maintain metallicity homogeneity and also we aimed for a direct overlap in orbital separation with the exoplanet sample, meaning we only included binary companions with orbital periods out to 4 years. For metallicity homogeneity, we cross-matched the sub-4 year sample with the Casagrande et al. (2011) catalogue of metallicities, leaving a total of 874 binaries or multiple stars, out of the complete 3936 sample.
As was shown in Fischer & Valenti (2005), the distribution of exoplanets follows a power law where the percentage of stars with giant planets increases as a function of metallicity. After constructing a similar histogram of values to that in Fischer & Valenti, we find a power law described by an amplitude of 0.0280.002 and an index of 2.230.09, which we represent by the dashed black curve in the plot. Beyond around a solar metallicity, the increase in planet hosting fraction rises steeply, possibly accelerating beyond a value of +0.2 dex in metallicity (Sousa et al., 2011).
The distribution of binaries on the other hand is extremely flat across all the metallicity range, within the uncertainties, with the fraction found to be 434%, in excellent agreement with Raghavan et al. (2010). The best fit weighted linear function is shown in the figure and has values for the gradient () and offset () of 0.2860.011 and -0.0990.044, respectively. These parameters are fairly insensitive to different bin widths, therefore, it is clear that the binarity fraction as a function of metallicity is significantly different to the planetary system fraction.
We investigated if there is any dependence on the binary fraction with orbital separation by constructing the same distribution on the sample of binaries with orbital periods longer than 4 years, and on the full sample regardless of orbital period. We found no significant differences between the distributions, however we do note a small drop in the fraction of binaries in the metal-poor regime (-0.8 [Fe/H] -0.5) for the longer period sample. Although it still agrees with a flat distribution within the uncertainties, in the future it may be worthwhile to revisit this regime with more binaries in these bins to see if this drop in fraction becomes significant, which would indicate there is a dependence of the binary fraction with separation as a function of metallicity.

In Fig. 11 we show the cumulative fraction between the binary fraction and the exoplanet fraction as a function of metallicity. The early rise at low metallicities in the binary fraction is apparent, along with the rapid rise at the high metallicity end for the exoplanet fraction. We find that the largest disparity between the two populations occurs around 0.15 dex in metallicity, a little over solar metallicity, where the planet fraction begins to significantly increase. A Kolmogorov-Smirnov test yields a D-statistic of 0.733 here, relating to a probability of the null hypothesis of 2.377%.
Gao et al. (2014) show that the fraction of binaries with orbital periods of less than 1000 days dramatically falls in the metal-rich regime when they split their SDSS and LAMOST FGK star samples up into three different metallicity bins. They find a total binary fraction of 432%, again in excellent agreement with what we find here, but they calculate binary fractions of 565%, 563%, and 305.7% for metallicities ([Fe/H]) of -1.1, -1.1 to -0.6, and -0.6, respectively, indicating a drop in the fraction of binaries in the most metal-rich region. Although this is an indication of a higher fraction of binaries near our metallicity lower limit, within the uncertainties the distribution is still flat (similar to the result reported in Raghavan et al., 2010). Therefore, we can not confirm if such a binary fraction change exists, a change that is also recovered by some models (e.g. Machida et al., 2009).
Bate (2014) studied the effects of changes of the metallicity on their star formation models, assuming the dust opacity scales linearly with metallicity across a range of metallicities from 1/3rd solar to three times solar metallicity. He finds no significant changes in the multiplicity fraction with metallicity, suggesting gas opacity does not overtly change the large-scale properties of star formation from the fragmentation of giant molecular clouds. Furthermore, he also finds no dependence with metallicity on the orbital separation of binaries and higher order multiples, as we find here. Given that recent works have shown that the cooling times in proto-planetary disks increase as a function of metallicity, meaning suppression of disk fragmentation in the super metal-rich regime (e.g. Cai et al., 2006), we might expect that if FGK star secondaries formed primarily through fragmentation of the proto-planetary disk, there would be a strong dependence of the binary fraction with metallicity. As this does not appear to be the case, then a flat distribution of binary fraction with metallicity suggests that these close binaries predominantly form through fragmentation of the giant molecular cloud that also formed the primary star.
3.7 Summary
Our target sample of 178 solar-type stars has revealed that 10 percent are spectroscopic binaries. Orbital solutions indicate that two systems potentially have brown dwarf companions and another two could have eccentricities that place them in the extreme upper tail of the eccentricity distribution for binaries with periods less than 1000 days. The systems with the largest quantity of data points appear to generate the least robust orbital solutions, which could owe to secondary flux contamination of the template spectra, and hence the necessity to garner more data to constrain their solutions. When the radial velocity measurement errors are low, yet the Keplerian solutions have low significance, the most likely scenario is a multiple-star system. HIPPARCOS astrometry was examined in an attempt to constrain our orbital parameters, however no significant astrometric variation could be discerned in the positional residuals. The distribution of companion masses was examined for both the binaries and candidate exoplanets detected by the AAPS. For periods up to 12 years the ‘steep’ planetary and ‘flat’ binary mass distributions mirror those seen by other surveys. Over a time scale equivalent to one orbital period of Jupiter, upwards of 30 exoplanet detections can be expected from our original sample of 178 stars. The discovery of these sixteen AAPS binaries from a sample of solar-type stars selected to have no resolvable or known SB companions is a reminder that the data for even the relatively bright southern stars remain far from complete.
Finally, analysis of the metallicity-mass plane from planetary companions all the way up to stellar companions reveals a stark difference in the mean metallicities of these populations, with planets orbiting stars more metal-rich than stellar companions, in general. The fraction that host these companions as a function of metallicity is also different, with the binary fraction being found to be flat (434%) in the metallicity range between -1.0 to 0.6 dex. This is in contrast to the fraction of stars hosting giant planetary systems, which has a very low fraction until around a solar metallicity, at which point the fraction rises steeply following a power law. The flat binary fraction across this wide range of metallicities is in agreement with recent hydrodynamical simulations of star formation through fragmentation of giant molecular clouds. Such a result suggests this is the dominate formation mechanism for FGK-type binaries and not fragmentation of the proto-planetary disk that was left over from the formation of the primary star.
4 Acknowledgements
We acknowledge funding by CATA-Basal grant (PB06, Conicyt), from Fondecyt through grant 3110004, and partial support from Centro de Astrofísica FONDAP 15010003, the GEMINI-CONICYT FUND and from the Comité Mixto ESO-GOBIERNO DE CHILE. (JSJ). We thank the support of CONICYT-PFCHA/Doctorado Nacional-Chile (MD). We further acknowledge Australian governmental support of the Anglo-Australian Telescope as part of the Department of Industry and Science (CGT, BC) and NSF grant AST-9988087 (RPB). We also thank David Soderblom for granting the use of Ca II H and K spectra taken at CTIO. This research has made use of the SIMBAD database, operated at CDS, Strasbourg, France.
References
- Abt et al. (1990) Abt H. A., Gomez A. E., Levy S. G., 1990, ApJS, 74, 551
- Anglada-Escudé et al. (2014) Anglada-Escudé G., Arriagada P., Tuomi, M., et al., N., 2014, MNRAS, 443, 89
- Armitage & Bonnell (2002) Armitage P. J., Bonnell I. A., 2002, MNRAS, 330, L11
- Aumann & Probst (1991) Aumann H. H., Probst R. G., 1991, ApJ, 368, 264
- Baraffe et al. (1998) Baraffe I., Chabrier G., Allard F., Hauschildt P. H., 1998, A&A, 337, 403
- Baranne et al. (1996) Baranne A., Queloz D., Mayor M., Adrianzyk G., Knispel G., Kohler D., Lacroix D., Meunier J.P., Rimbaud G, Vin A., 1996, A&A, 119, 373
- Bate (2014) Bate M., 2014, MNRAS, 442, 285
- Bond et al. (2006) Bond J., C., Tinney, C. G., Butler, R. P., Jones, H. R. A., Marcy, G. W., Penny, A. J., Carter, B. D., 2006, MNRAS, 370, 163
- Bouchy et al. (2001) Bouchy F., Pepe, F., Queloz, D., 2001, A&A, 374, 733
- Butler et al. (1996) Butler R. P., Marcy G. W., Williams E., McCarthy C., Dosanjh P., Vogt S. S., 1996, PASP, 108, 500
- Butler et al. (2001) Butler R. P., Tinney C. G., Marcy G. W., Jones H. R. A., Penny A. J., Apps K., 2001, ApJ, 555, 410
- Buchhave et al. (2012) Buchhave L. A., Latham D. W., Johansen A., et al., 2012, Nature, 486, 375
- Cai et al. (2006) Cai K., Durisen R. H., Michael S., et al., 2006, ApJ, 636, 149
- Casagrande et al. (2011) Casagrande L., Schonrich R., Asplund M., et al., 2011, A&A, 530, 138
- Decin et al. (2000) Decin G., Dominik C., Malfait K., Mayor M., Waelkens C., 2000, A&A, 357, 533
- Dommanget & Nys (1994) Dommanget J., Nys O., 1994, Communications de l’Observatoire Royal de Belgique, 115, 1
- Dupuy et al. (2009) Dupuy T. J., Liu M. C., Ireland M. J., 2009, ApJ, 692, 729
- Duquennoy & Mayor (1991) Duquennoy A., Mayor M., 1991, A&A, 248, 485
- Eggl (2013) Eggl S., Pilat-Lohinger E., Funk B., Georgakarakos N., Haghighipour N., 2013, MNRAS, 428, 3104-3113
- van Leeuwen (2007) van Leeuwen, F., 2007 , A&A, 474, 653
- Evans et al. (1957) Evans D. S., Menzies A., Stoy R. H., 1957, MNRAS, 117, 534
- Evans (1964) Evans D. S., 1964, Royal Greenwich Observatory Bulletin, 85, 207
- Fischer & Marcy (1992) Fischer D. A., Marcy G. W., 1992, ApJ, 396, 178
- Fischer & Valenti (2005) Fischer D. A., Valenti J., 2005, ApJ, 622, 1102
- Gao et al. (2014) Gao S., Liu C., Zhang X., et al., 2014, ApJ, 788, 37
- Gonzalez (1997) Gonzalez G., 1997, MNRAS, 285, 403
- Gray et al. (2006) Gray R. O., Corbally, C. J., Garrison, R. F., McFadden, M. T., Bubar, E. J., McGahee, C. E., O’Donoghue, A. A., Knox, E. R., 2006, AJ, 132, 161G
- Halbwachs et al. (2000) Halbwachs J. L., Arenou F., Mayor M., Udry S., Queloz D., 2000, A&A, 355, 581
- Halbwachs et al. (2012) Halbwachs J. L., Mayor M., Udry S., 2003, MNRAS, 422, 14
- Henry et al. (1996) Henry T. J., Soderblom D. R., Donahue R. A., Baliunas S. L., 1996, AJ, 111, 439
- Horne & Baliunas (1986) Horne J. H., Baliunas S. L., 1986, ApJ, 302, 757
- Houk (1978) Houk N., 1978. Michigan catalogue of two-dimensional spectral types for the HD stars. Ann Arbor : Dept. of Astronomy, Univ of Michigan
- Houk (1982) Houk N., 1982. in Michigan Spectral Survey, Ann Arbor, Dep. Astron., Univ. Michigan, (Vol. 3), pp 0–+
- Houk & Cowley (1975) Houk N., Cowley A. P., 1975. Michigan Catalogue of two-dimensional spectral types for the HD stars. Ann Arbor: Dept. of Astronomy, Univ of Michigan
- Houk & Smith-Moore (1988) Houk N., Smith-Moore M., 1988. in Michigan Spectral Survey, Ann Arbor, Dept. of Astronomy, Univ. Michigan (Vol. 4) (1988), pp 0–+
- Ida & Lin (2004) Ida S., Lin D. N. C., 2004. in ApJ, 616, 567
- Jenkins et al. (2006) Jenkins J. S., Jones H. R. A., Tinney C. G., Butler R. P., McCarthy C., Marcy G. W., Pinfield D. J., Carter B. D., Penny A. J., 2006, MNRAS, 372, 163
- Jenkins et al. (2008) Jenkins J. S., Jones H. R. A., Pavlenko Y., Pinfield D. J., Barnes J. R., Lyubchik Y., 2008, A&A, 485, 571
- Jenkins et al. (2009) Jenkins J. S., Jones H. R. A., Gozdziewski K., et al., 2009, MNRAS, 398, 911
- Jenkins et al. (2010) Jenkins J. S., Jones H. R. A., Biller B. A., O’Toole S. J., Pinfield D. J., Close L., Tinney C. G., Butler R. P., Wittenmyer R., Carter B. D., Day-Jones A. C., 2010, MNRAS, 372, 163
- Jenkins et al. (2011) Jenkins J. S., Murgas F., Rojo P., Jones H. R. A., Day-Jones A. C., Jones M. I., Clarke J. R. A., Ruiz M. T., Pinfield D. J., 2011, A&A, 531, 8
- Jenkins et al. (2013a) Jenkins J. S., Tuomi M., Brasser R., Ivanyuk O., Murgas F., 2013a, ApJ, 771, 41
- Jenkins et al. (2013b) Jenkins J. S., Jones H. R. A., Tuomi M., et al., 2013b, ApJ, 766, 67
- Jenkins & Tuomi (2014) Jenkins J. S., Tuomi M., 2014, ApJ, 794, 110
- Jones et al. (2002a) Jones H. R. A., Paul Butler R., Marcy G. W., Tinney C. G., Penny A. J., McCarthy C., Carter B. D., 2002a, MNRAS, 337, 1170
- Jones et al. (2002b) Jones H. R. A., Paul Butler R., Tinney C. G., Marcy G. W., Penny A. J., McCarthy C., Carter B. D., Pourbaix D., 2002b, MNRAS, 333, 871
- Liu (2007) Liu M. C., Leggett S. K., Chiu K., 2007, ApJ, 660, 1507
- Lo Curto et al. (2010) Lo Curto, G., Mayor, M., Benz, W., Bouchy, F., Lovis, C., Moutou, C., Naef, D., Pepe, F., Queloz, D., Santos, N. C., Segransan, D., Udry, S., 2010, A&A, 512, A48
- Lomb (1976) Lomb N. R., 1976, Ap&SS, 39, 447
- Lopez & Jenkins (2012) Lopez S., Jenkins J. S., 2012, ApJ, 756, 177
- Lovis & Pepe (2007) Lovis C., Pepe F., 2007, A&A, 468, 1115
- Machida et al. (2009) Machida M. N., Omukai, K., Matsumoto T, Inutsuka I., 2009, MNRAS, 399, 1255
- Mamajek & Hillenbrand (2008) Mamajek E. E., Hillenbrand, L. A., 2008, ApJ, 687, 1264
- Marcy & Butler (2000) Marcy G. W., Butler R. P., 2000, PASP, 112, 137
- Mason et al. (1998) Mason B. D., Gies D. R., Hartkopf W. I., Bagnuolo W. G., Brummelaar T. T., McAlister H. A., 1998, AJ, 115, 821
- McCarthy (1995) McCarthy C., 1995, M.S. Thesis, San Francisco State Univ
- McCarthy (2001) McCarthy C., 2001, Ph.D. Thesis, University of California Los Angeles
- Mordasini et al. (2012) Mordasini C., Alibert Y., Benz W., Klahr H., Henning T., 2012, A&A, 541, 97
- Nidever et al. (2002) Nidever D. L., Marcy G. W., Butler R. P., Fischer D. A., Vogt S. S., 2002, ApJS, 141, 503
- O’Toole et al. (2009) O’Toole S. J., Tinney C. G., Jones H. R. A., Butler R. P., Marcy G. W., Carter B., Bailey J., 2009, MNRAS, 392, 641
- Oudmaijer et al. (1992) Oudmaijer R. D., van der Veen W. E. C. J., Waters L. B. F. M., Trams N. R., Waelkens C., Engelsman E., 1992, A&AS, 96, 625
- Pepe et al. (2002) Pepe, F., Mayor, M., Galland, F., Naef, D., Queloz, D., Santos, N. C., Udry, S., Burnet, M., 2002, A&A, 388, 632
- Perrin et al. (1988) Perrin M.-N., Cayrel de Strobel G., Dennefeld M., 1988, A&A, 191, 237
- Preibisch et al. (1999) Preibisch T., Balega Y., Hofmann K., Weigelt G., Zinnecker H., 1999, New Astronomy, 4, 531
- Raghavan et al. (2010) Raghavan D., McAlistar H. A., Henry T. J., et al., 1999, ApJS, 190, 1
- Rousset et al. (2003) Rousset G., Lacombe F., Puget P., et al. , 2003, SPIE, 4839, 140
- Scargle (1982) Scargle J. D., 1982, ApJ, 263, 835
- Soderblom et al. (1991) Soderblom D. R., Duncan D. K., Johnson D. R. H., 1991, ApJ, 375, 722
- Sousa et al. (2011) Sousa S., Santos N.C., Israelian G., et al., 2011, A&A, 533, 141
- Sozzetti et al. (2002) Sozzetti A., Casertano S., Brown R. A., Lattanzi M. G., 2002, PASP, 114, 1173
- Sozzetti et al. (2001) Sozzetti A., Casertano S., Lattanzi M. G., Spagna A., 2001, A&A, 373, L21
- Tinney et al. (2002) Tinney C. G., McCarthy C., Jones, H. R. A., Butler, R. P., Carter, B. D., Marcy, G. W., Penny, A. J., 2001, MNRAS, 332, 759
- Tokovinin (2014) Tokovinin A., 2014 AJ, 147, 86
- Torres et al. (2006) Torres C. A. O., Quast, G. R., Da Silva, L., De La Reza, R., Melo, C. H. F., Sterzik, M., 2006 A&A, 460, 695-708
- Udry et al. (2007) Udry S., Bonfils, X., Delfosse, X., et al., 2007 A&A, 649, 43
- Vogt et al. (2010) Vogt S. S., Butler R.P., Rivera, E. J., Highighipour, N., Henry, G. W., Williamson, M. H., 2010, ApJ, 723, 954
- Wittenmyer et al. (2014) Wittenmyer R. A., Tuomi M., Butler, R. P., et al., N., 2014, ApJ, 791, 114
- Yi et al. (2001) Yi S., Demarque P., Kim Y., Lee Y., Ree C. H., Lejeune T., Barnes S., 2001, ApJS, 136, 417

![[Uncaptioned image]](/html/1507.04749/assets/x39.png)


