On the dependence of galaxy morphologies on galaxy mergers
Abstract
The distribution of galaxy morphological types is a key test for models of galaxy formation and evolution, providing strong constraints on the relative contribution of different physical processes responsible for the growth of the spheroidal components. In this paper, we make use of a suite of semi-analytic models to study the efficiency of galaxy mergers in disrupting galaxy discs and building galaxy bulges. In particular, we compare standard prescriptions usually adopted in semi-analytic models, with new prescriptions proposed by Kannan et al., based on results from high-resolution hydrodynamical simulations, and we show that these new implementations reduce the efficiency of bulge formation through mergers. In addition, we compare our model results with a variety of observational measurements of the fraction of spheroid-dominated galaxies as a function of stellar and halo mass, showing that the present uncertainties in the data represent an important limitation to our understanding of spheroid formation. Our results indicate that the main tension between theoretical models and observations does not stem from the survival of purely disc structures (i.e. bulgeless galaxies), rather from the distribution of galaxies of different morphological types, as a function of their stellar mass.
keywords:
galaxies:structure - galaxies:interactions - galaxies:bulges - galaxies:evolution1 Introduction
The morphological classification of galaxies constitutes one of the earliest attempts to explain the different observational properties of galaxies in terms of an evolutionary sequence (Hubble, 1926). The distribution of galaxies in different morphological classes has been shown to correlate strongly both with local environment (see e.g. Dressler, 1980; Wilman et al., 2009) and stellar mass (see e.g. Vulcani et al., 2011; Wilman & Erwin, 2012). Therefore modern astrophysical research focuses on the complex interplay of physical mechanisms acting on the baryonic components and responsible for the morphological transformation as a function of stellar mass, cosmic epoch and environment (Brennan et al., 2015). Different approaches to the morphological classification of galaxy samples have been proposed, moving from the visual classification of (relatively) small samples of local galaxies, to the use of automatic pipelines applied to galaxy surveys. All these techniques have their strengths and shortcomings: typically the merit of the classification heavily depends on photometric data quality and/or on the algorithm used (e.g. profile or 2D fitting) and on the galactic components assumed. The aim is to distinguish between a centrally concentrated spheroidal structure (also defined as a “bulge”) and a disc-like component (which may also host spiral arms). This oversimplified picture neglects the heterogeneity of the bulge population and the role played by bar-like structures in galaxy evolution (see e.g. Kormendy & Kennicutt, 2004), nevertheless it is useful to define the mass ratio between the bulge mass and the total mass of the galaxy (the so called bulge-to-total ratio, ) as a primary discriminant between bulge- and disc-dominated galaxies.
Galaxies which consist purely of a bulge (ellipticals) are not easy to identify unambiguously in observations, even in the very local Universe. They have kinematic properties varying from pure pressure-supported systems to systems with partial rotational support similar to lenticular galaxies, just without the defining outer disk component (Krajnović et al., 2008; Emsellem et al., 2011). In absence of kinematics, an accurate multi-component decomposition requires well resolved imaging at high signal to noise, for which a 2-component (bulge+disk) model can be fit (see e.g. Simard et al., 2011; Mendel et al., 2014), providing parameters tied to the morphological information. Visual classifications - confirming the absence of disk light and asymmetric features such as bars and spiral arms - provides an alternative approach to identify ellipticals. Nonetheless, ellipticals are always difficult to distinguish from face-on lenticular galaxies, and visual classification requires a huge effort for the characterization of large samples. In both cases, with the average B/T increasing to high mass (see e.g. Bluck et al., 2014), it becomes more difficult to distinguish pure elliptical galaxies from the increasing population of intermediate B/T (and still fairly concentrated) galaxies. Therefore, depending upon the exact cuts used to select elliptical or (more inclusively) early-type galaxies, a different sample of elliptical galaxies may be selected.
In a recent paper, Wilman & Erwin (2012) presented a local galaxy catalogue, based on a visual classification of galaxy morphology. This catalogue (SDSSRC3) includes galaxies with and it is based upon the New York University Value Added Galaxy Catalogue (NYU-VAGC, Blanton et al. 2005) who matched the SDSS DR4 (Sloan Digital Sky Survey Data Release 4, Adelman-McCarthy et al. 2006) to the Third Reference Catalogue of Bright Galaxies (RC3, de Vaucouleurs et al. 1991). Wilman & Erwin (2012) used this sample to study the fraction of galaxies of different morphological types as a function of stellar and parent Dark Matter (DM) halo mass. For central galaxies, the fraction of (visually classified) elliptical galaxies is found to increase with stellar mass and parent DM mass (only for central galaxies). They also found a relatively small fraction of genuine elliptical galaxies at high stellar masses (), with a large contribution of S0s (which never have ) and Spiral galaxies. One of the main differences between this work and previous ones lies in the definition of the galaxy sample (relatively nearby and bright - they appear in the RC3 catalogue) and in the use of visual classification to separate S0s from Ellipticals. Their definition is thus both qualitatively and quantitatively different from alternative approaches to define samples of Early Types galaxies based on fitting light profiles and/or automatic decomposition (see e.g. Hyde & Bernardi 2009 for the full SDSS volume).
The work by Wilman & Erwin (2012) has been extended in Wilman et al. (2013) including a detailed comparison to predictions from a suite of semi-analytic models (SAMs hereafter) of galaxy formation and evolution implementing different prescriptions for bulge formation. They showed that theoretical predictions are able to reproduce the observed increase of the Ellipticals fraction with stellar/halo mass. However, theoretical is too high with respect to the estimates from the SDSSRC3, by factors of a few (2.6 to 4.2 for the models considered in that paper). Moreover, models are also able to reproduce the fraction of passive galaxies and the fraction of star forming disc galaxies (the separation between star forming and passive galaxies being set at a specific star formation rate ). Therefore, models overproduce Elliptical galaxies at the expense of passive S0s and Spiral galaxies. Wilman et al. (2013) suggested a reduced efficiency of bulge formation in mergers, via efficient stripping of satellite galaxies leading to reduced baryonic merger ratios, as a viable solution to this problem.
Contrasting results have been presented recently: Porter et al. (2014) compared predictions of improved variants of the Somerville et al. (2008) model with the fraction of Early Type galaxies computed using the Hyde & Bernardi (2009) SDSS sample, and conclude that their models tend to underpredict the fraction of Early type galaxies, when bulges are produced only in mergers. In view of these contradicting claims, it becomes important to understand the origin of the differences between observational determinations of the Early Type/Elliptical fractions.
The efficiency of binary galaxy mergers in destroying discs and forming bulges has been revised, following numerical simulations taking into account the role of the gas content (see e.g. Robertson et al., 2006; Governato et al., 2009; Hopkins et al., 2009). Consensus has grown that the presence of a gas component may lead to the survival of the original disc even in 1:1 mergers. However, these studies were based on idealized merger configurations and did not cover a statistical sample of cosmological initial conditions. As a matter of fact, Moster et al. (2011) repeated similiar simulations including both cosmological accretion and accretion from a reservoir of hot gas associated with the parent dark matter halo (two ingredients that were not considered in Hopkins et al. 2009) and they did not find any clear dependence of burst efficiency on the progenitor’s cold gas fraction.
A complementary approach has been used in the framework of the so-called Simulated Merger Tree Approach (Moster et al., 2014): this method is based on high-resolution hydrodynamical simulations of galaxy mergers, with initial conditions (Dark Matter structures, orbital parameters, galaxy properties) extracted from (lower resolution) cosmological simulations coupled with SAMs. This technique thus combines the potential of high resolution to explore the effect of mergers on the mass distribution of the remnant galaxy, with cosmologically motivated initial conditions. Using this method, Kannan et al. (2015) analyzed the channels of bulge growth in 19 simulations of binary galaxy mergers. In particular, they followed the transfer of stellar and cold gas mass from the satellite to the central galaxy, as well as the mass exchanges between different components (disc, bulge, halo) of the central galaxy. They then try to quantify the mass flows by providing fitting formulae that parametrize the dependence of such mass exchanges on the merger mass ratio (both baryonic and in Dark Matter), and the orbital parameters. Their results show that the morphology of merger remnant depends mainly on the baryonic mass ratio between the two merging galaxies but also on the gas fraction of the main galaxy, while the orbital parameters (i.e. the eccentricity of the orbit) play a minor role.
The aim of this work is to study the implications of the new fitting formulae when implemented within models that can create large statistical realizations of the galaxy population, and in particular the predicted fraction of early types as function of stellar and halo mass. This paper is organized as follows. In Section 2, we introduce the semi-analytic implementations we consider in our analysis. We then compare the different distribution of morphological types to different sets of observational data in Section 3. Finally, we discuss our conclusions in Section 4.
2 Models
In this work we consider predictions from three different state-of-the-art SAMs, namely morgana (Monaco et al., 2007), the De Lucia & Blaizot (2007, DLB07 hereafter) version of the Munich model and the Santa Cruz model (SC-SAM , Somerville et al. 2008; Porter et al. 2014). In particular, we consider the morgana run defined in Lo Faro et al. (2009) and calibrated on WMAP3 cosmology ( km s-1 Mpc-1 , , , , ); the DLB07 model applied to the Millennium Simulation (Springel et al. 2005, km s-1 Mpc-1 , , , , ) and the “fiducial” SC-SAM model as presented in Porter et al. (2014, including also the modifications discussed in ) applied to the Bolshoi simulation (Klypin et al. 2011, km s-1 Mpc-1 , , , , ). We do not expect the differences in the cosmological parameters to affect model predictions in a relevant way (see e.g Guo et al., 2013; Wang et al., 2008). All models adopt a Chabrier (2003) IMF. We refer the interested reader to the original papers for a complete overview of the modelling of the different physical processes in each code. Predictions from the same SAMs considered here have already been compared against a number of observational constraints (see e.g Fontanot et al., 2009, 2011). In the following, we give a brief description of the physical mechanisms relevant for bulge formation and morphological transformations. A detailed analysis of the timescales and channels of bulge formation in morgana and DLB07 has been presented in De Lucia et al. (2011), Fontanot et al. (2011) and Wilman et al. (2013).
2.1 Reference and HOP09 runs
All reference models assume that star formation happens primarily in disc systems. Spheroidal systems form when the stars and/or gas in the galactic discs lose angular momentum as a consequence of dissipative processes like galaxy mergers and/or disc instabilities, and are funnelled towards the centre of the galaxy. Broadly speaking, galaxy mergers are supposed to lead to the formation of an Elliptical galaxy or of a “classical” bulge (with kinematic and photometric properties similar to those of Elliptical galaxies, see e.g. Davies & Illingworth 1983), while secular processes are associated with the formation of “pseudo” bulges (characterized by disc-like exponential profiles or kinematics; see e.g. Kormendy & Kennicutt 2004).
The modelling of disc instabilities represents one of the largest uncertainties in SAMs. Different assumptions are found in the literature, from transferring just enough mass to restore stability (e.g. De Lucia & Blaizot 2007) to the catastrophic destruction of the entire disc into a spheroidal remnant (Bower et al., 2006). Numerical simulations of bar formation and evolution (see e.g. Debattista et al., 2006) have not yet provided definitive evidence in favour of a given treatment or alternative prescriptions (although less dramatic mass transfers seem to be preferred Moster et al., in preparation); given these uncertainties, in the following we switch off disc instabilities in our reference models, that therefore correspond to the pure merger realizations in Wilman et al. (2013). It should be borne in mind that the contribution of disc instabilities is negligible at the highest stellar masses, but relevant for intermediate mass galaxies () for all models (as discussed in De Lucia et al. 2011 and Porter et al. 2014), thus playing a critical role for the interpretation of observational data at these scales (Fontanot et al., 2011). Moreover, in our models we also do not consider tidal stripping of stars in satellite galaxies.
All 3 SAMs considered in this work implemented merger prescriptions based on a broad division between major and minor mergers: in a major merger (i.e. mass ratio 0.3) the entire stellar and gaseous content of the two merging galaxies is given to the spheroidal remnant, which becomes an Elliptical galaxy (). In minor mergers, the stellar mass of the satellite is given to the bulge of the central/remnant, while the gaseous component is given either to the disc (DLB07, SC-SAM ) or to the bulge (morgana ): in both cases the merger triggers a starburst. Wilman et al. (2013) showed that this scheme implies a significant increase of with stellar mass and parent halo mass for central galaxies. We refer to these model realizations as reference runs. In particular, for the SC-SAM reference run we use the same merger prescriptions as in Somerville et al. (2008), which includes the scattering of of a fixed () fraction of disc stars into the diffuse stellar halo (DSH) at each galaxy merger.
A different formulation was proposed by Hopkins et al. (2009), based on results from idealized hydrodynamical simulations of binary mergers (Robertson et al., 2006). This “gas-fraction-dependent merger model” assumes that galaxy mergers trigger a burst of star formation, but the fraction of cold gas that participates in the starburst (i.e. efficiency of the conversion of cold gas into stars) depends on both the baryonic merger ratio of the two progenitors, and on the gas fraction of the disc of the primary galaxy. All stars formed in the burst are assigned to the spheroidal component of the remnant galaxy, as well as the whole stellar mass of the satellite galaxy. In addition, the coalescence of the two galaxies might destroy a large fraction of the primary disc (depending on the mass ratio of the merger), transferring its mass to the spheroidal component of the remnant. This is significantly different with respect to the reference approach, where the disc of the primary galaxy is either unaffected in minor mergers or completely destroyed in major mergers. De Lucia et al. (2011) studied the impact of the Hopkins et al. (2009) prescriptions on bulge formation channels in the framework of the morgana and DLB07 models, finding small differences in terms of galaxy distribution into different morphological types, with respect to the reference runs. In contrast, Hopkins et al. (2009) have investigated the impact of these prescriptions in the SC-SAM model, finding a suppression of bulge formation in low-mass galaxies, and claiming that the gas dependence of merger-induced starbursts is a fundamental ingredient to reproduce the observed morphology-mass relation. An improved version of the SC-SAM model including the Hopkins et al. (2009) prescriptions has been presented in Porter et al. (2014). We refer to this set of realizations as the HOP09 runs. While running the reference and KAN15/Kz1 realizations for the SC-SAM model, we fixed all the other relevant parameters to the values assumed in Porter et al. (2014).
The frequency of mergers is clearly related to the timescales assumed for the orbital decay of satellites inside DM haloes. morgana and SC-SAM assign the merger time at the last time the galaxy is central (i.e. when the haloes merge), while in DLB07 the residual merging time is estimated from the relative orbit of the two merging objects, at the time of subhalo disruption. morgana uses the fitting formula from Taffoni et al. (2003) while both DLB07 and SC-SAM use variants of the dynamical friction formula. In particular, SC-SAM uses the formulation proposed by Boylan-Kolchin et al. (2008) and DLB07 use the Chandrasekhar formula with a fudge factor 2 (which should bring merger times in closer agreement with those predicted by the Boylan-Kolchin et al. 2008 formula). The three approaches provide different predictions for the dynamics of satellite galaxies (De Lucia et al., 2010). In particular, the merging timescale for massive satellites (i.e. with large progenitor mass ratios) is roughly one order of magnitude shorter in morgana than in the other two models.
2.2 Fitting formulae from Kannan et al. (2015).
We briefly recall here the main results from Kannan et al. (2015). Using hydrodynamical simulations based on the parallel TreeSPH-code GADGET-2 (Springel et al., 2005), they show that in binary galaxy mergers, the mass exchanges between the satellite and the central galaxy and between the different components of the central galaxy primarly depend on the baryonic merger ratio () between the two objects (computed at the infall time of the satellite galaxy, i.e. when it first became a satellite) and on the gas fraction () of the primary galaxy. Following Moster et al. (2014), initial conditions for the hydrodynamical simulations are set up at using morgana to populate DM merger trees constructed from a cosmological volume using the Lagrangian code pinocchio (Monaco et al., 2002). morgana provides predictions for the physical properties of merging galaxies, including stellar and cold gas mass, morphology and scale radii, while infall times are derived directly from the DM merger tree. It is worth stressing that the simulation suite used in Kannan et al. (2015) analysis includes only 19 merger configurations, extracted from the cosmological volume and bound to have DM halo masses at similar to the Milky Way host halo. Initial masses for primary galaxies lie in the range , with merger ratios and gas fraction . This is a rather small sample and results in a significant scatter around the proposed analytic fitting formulae, thus limiting the precision of the resulting fitting formulae. Moreover, since we will apply these prescriptions on a full cosmological volume, we must extrapolate beyond the DM halo mass scale and redshift range they were calibrated on. Nonetheless, given the present uncertainties in the modeling of bulge formation during galaxy mergers, it is interesting to explore the implications of these trends in terms of the distribution of model galaxies in the different morphological types, in order to assess if these results go into the direction of relieving or exacerbating the tension between data and model predictions. In order to test the strength of our results, we define additional model realizations imposing a (gaussian distributed) scatter around the adopted fitting formulae corresponding to variance ranging from 0.2 to 1. The analysis of these runs show that none of the conclusions we discuss in this paper change when scatter in the fitting formulae is taken into consideration.
In detail, the main mass exchanges parametrized in the Kannan et al. (2015) simulations include the fraction of total (stellar plus cold gas) satellite mass ending up in the bulge of the remnant galaxy
| (1) |
where represents the satellite mass deposited into the DSH as a result of tidal stripping acting on the secondary galaxy, while it orbits within the parent DM halo potential well. They also consider the fraction of the central disc gas mass transferred to the central bulge
| (2) |
which is strictly defined as . The cold gas transferred from the primary disc to the bulge of the remnant, and the cold gas from the satellite are readily consumed in a burst of star formation, following the original definition in each model. Finally, the Kannan et al. (2015) fitting formulae describe the mass loss from the stellar disc of the central galaxy, as the result of tidal effects: i.e. the fraction of primary disc stars transferred to the bulge of the remnant
| (3) |
and the fraction of central disc stars dispersed into the DSH
| (4) |
It is worth stressing that, for massive galaxies, results are more sensitive to the fitting formulae describing the effect of mergers on existing stars, as they typically have very low gas fractions.
In the following, we focus on two different sets of models: we first consider SAMs realizations (KAN15) where the Kannan et al. (2015) fitting formulae are implemented at all redshifts. In a second set of modified models (Kz1), we allow these modifications only for , keeping the reference merger prescriptions at earlier times. This second choice is motivated by the fact that the original simulations considered in Kannan et al. (2015) are set up at (using the information provided by the SAM) and then run to . Since we expect the properties of higher-redshift discs to be different than those of low-z systems, Kz1 represents a conservative lower limit on the effect of the Kannan et al. (2015) prescriptions on the distribution of morphological types.
3 Results & Discussion
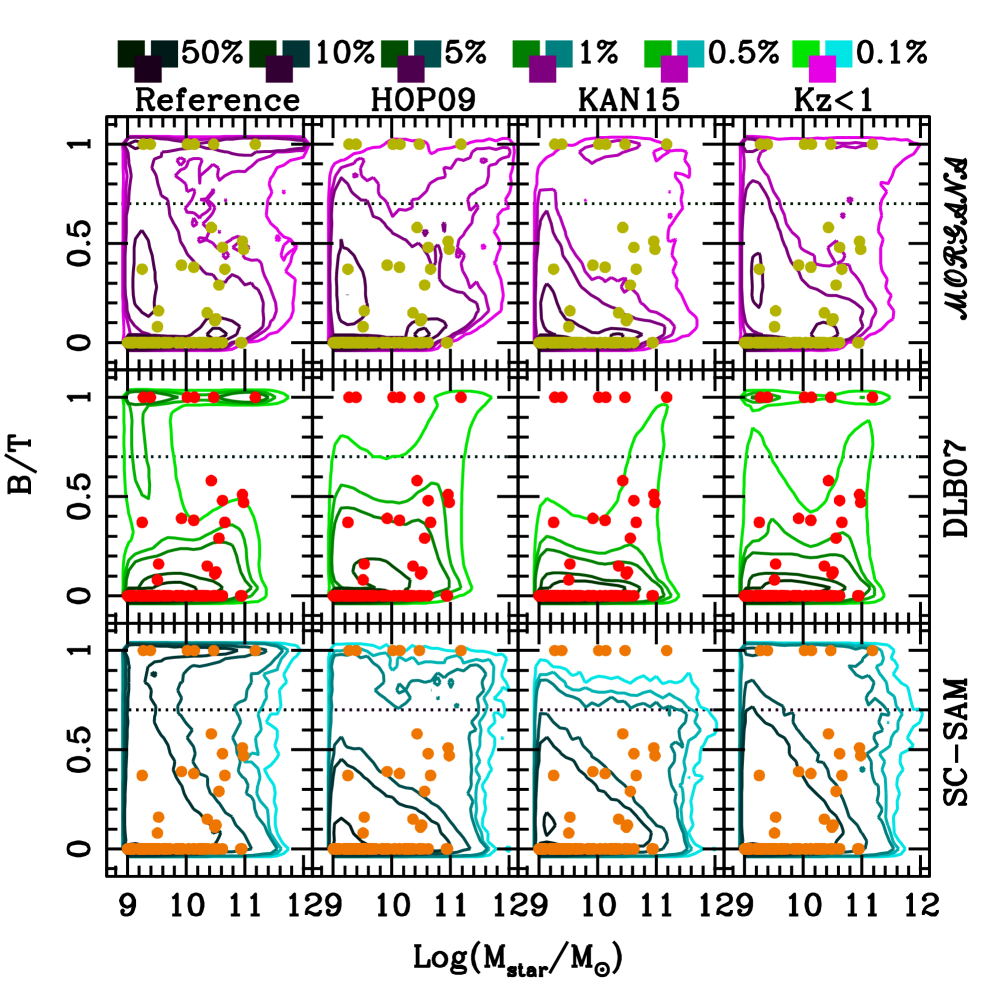
In fig. 1, we compare the bidimensional vs distributions in our model galaxy catalogues and in the local (closer than 11 Mpc) volume-limited sample of 321 nearby galaxies from Fisher & Drory (2011), based on a bulge-disc decomposition and pseudo-bulge diagnostics in the Spitzer m band. As disk instability has been switched off in the models, we only consider “classical” ratios for the data sample (i.e. we consider in the Fisher & Drory 2011 sample only for those bulges classified as classical, see also Wilman et al. 2013). A consistent picture can be drawn from the predictions of the different reference models, despite different merger prescriptions and merger timescales. In the KAN15 runs (i.e. when the new prescriptions are applied at all redshifts) the abundance of galaxies is drastically reduced at all mass scales. However, this is obtained at the expense of almost completely devoiding the region. This effect goes into the same direction as for the HOP09 runs, but the overall reduction of bulge dominated galaxies is greater when using the Kannan et al. (2015) prescriptions in these models: the KAN15 column of Fig. 1 shows that most model galaxies have . As expected, the Kz1 model provides intermediate results between the reference and KAN15 runs: the number of galaxies is reduced, but not as much as in the KAN15 runs. In particular the effect is mass dependent, as more massive galaxies are scattered to a wider distribution of with respect to the reference runs (where they are mostly objects).
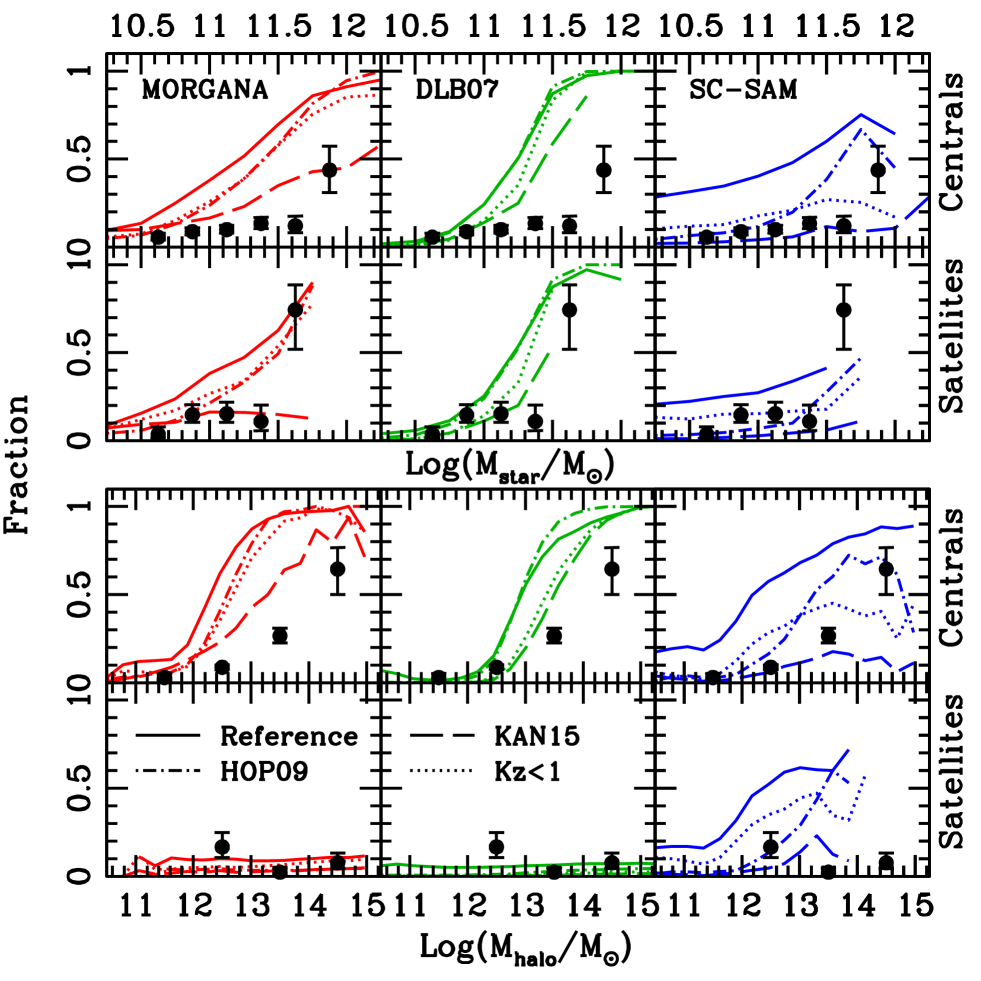
More insight can be obtained by comparing the predictions of our models with the observed as a function of stellar and parent DM halo mass, as defined in Wilman et al. (2013). As in their work, in Fig. 2, we define as Ellipticals all model galaxies with , and split our sample by hierarchy considering separately central and satellite galaxies in the upper and lower rows (only bins containing more that 10 objects are considered). Our choice for the threshold at is motivated by observational studies (Weinzirl et al., 2009; Laurikainen et al., 2010)) and by consistency with previous studies. We want to stress that our results do not change qualitatively if we assume a different threshold for the definition of Elliptical galaxies (in the range 0.5-0.9). We remind the reader that the Wilman & Erwin (2012) sample contains 854 galaxies with , whose morphologies are visually classified. It is difficult to directly compare this sample with the Fisher & Drory (2011) catalogue, as the latter contains only 11 galaxies with , while the former does not allow for a finer classification between pseudo and classical bulges. It is thus worth stressing that in the following plots formally represents an upper limit for the fraction of Elliptical galaxies, as it is not possible to discriminate the relative contribution of disk instabilities and merger processes in the formation of a spheroid, but only its main shape (but see Erwin et al. 2015 for recent progress on these issues). Nonetheless, a more detailed classification should have a limited impact on our conclusions, since we do not expect the formation of objects to be driven by disk instabilities alone, although they might contribute to increase the mass of a merger-induced spheroid. Similar arguments hold for the other two main samples considered in this work (Hyde & Bernardi, 2009; Mendel et al., 2014). As discussed in Wilman et al. (2013), the reference models (solid lines) overpredict over the whole mass range. The discrepancy is larger for more massive systems, where model fractions almost reach 100. The discrepancy is particularly severe for central galaxies that show, in all models, a strong dependence of on stellar and parent halo mass. It is interesting to notice that the reference run of SC-SAM (that was not included in Wilman et al. 2013) predicts lower elliptical fractions at the high mass end, with respect to the other two models, thus providing the closest match to the Wilman et al. (2013) sample among reference runs. Moreover, the predicted fractions of galaxies in the HOP09 runs (dot-dashed lines) deviate considerably from the reference runs only for the SC-SAM model, while they are very close for the other two models (as already noticed in Wilman et al. 2013).
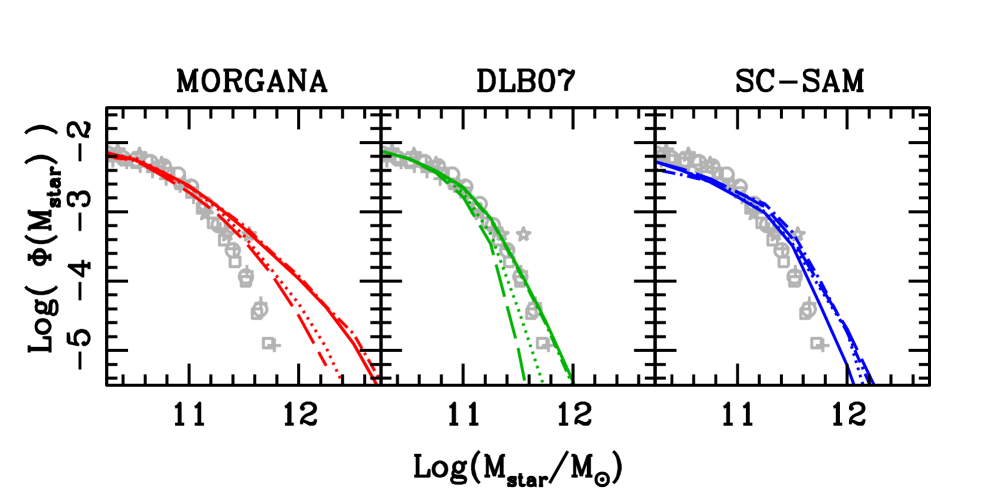
The picture changes when the KAN15 runs are considered: the predicted are reduced at all mass scales, both as a function of stellar and parent halo mass. It is worth stressing that the final masses of model galaxies change between the reference and the KAN15/Kz1 runs (dashed and dotted lines), due to the different assembly history. The effect of these changes is imprinted on the galaxy stellar mass function (Fig. 3). For both morgana and DLB07 there is a clear decrease in stellar mass at the high-mass end due to the deposit of stellar mass into the DSH as a consequence of the assumed modeling for and (and because more massive galaxies experience more merger events). This effect is more severe for DLB07, as the number density of massive galaxies is already the smallest among the models considered and the original prescription of this model did not include stellar stripping of satellites (and we did not retune the parameters to account for this effect). In this model, both the KAN15 and Kz1 runs do not predict any galaxy with stellar mass , and the highest mass bins available are affected by small number statistics. In addition, this model shows the smallest reduction of , with the bins still dominated by galaxies. We checked that, in DLB07, this behaviour is mainly due to the reduced mass of infalling satellites (i.e. ). We also noticed that the HOP09 runs of morgana and DBL07 predict galaxy stellar mass functions almost indistinguishable from those of the reference runs. For the SC-SAM instead, only small differences between the predicted mass function from the four runs can be seen. This is due to the fact that the SC-SAM already includes the scattering of disc stars into the DSH at each merger in the Somerville et al. (2008) and Porter et al. (2014) versions. Therefore, the impact of the Kannan et al. (2015) formulae is reduced, with respect to the other two models.
Despite for morgana and SC-SAM the predicted fractions for the KAN15 runs are now roughly consistent with the Wilman & Erwin (2012) observational constraints, this is obtained at the expenses of losing all Ellipticals. The Kz1 runs provide intermediate results with respect to the other two sets of runs. In most cases, however, the predicted still overpredicts the observed in the Wilman & Erwin (2012) sample, at most mass scales.
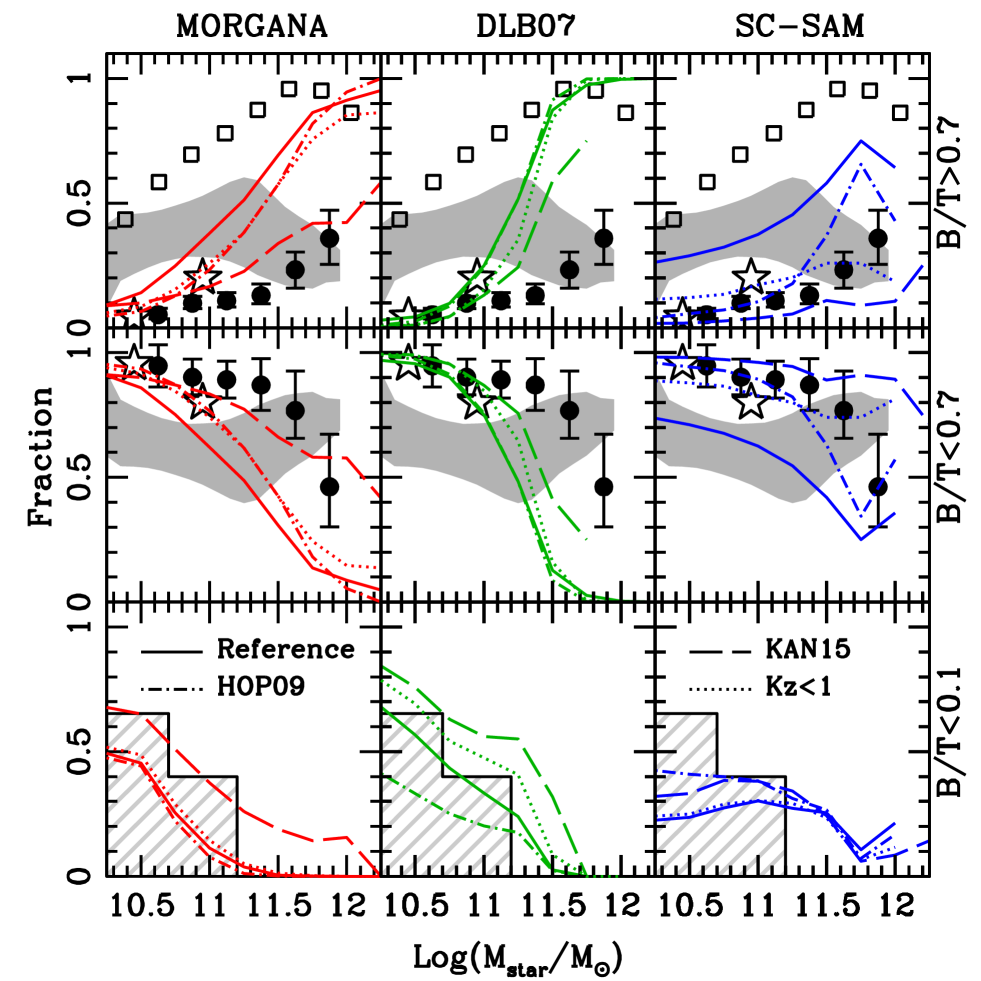
We then compare our model predictions with additional observational constraints in Fig. 4. We first consider different ranges for model galaxies: we split the sample into (upper row) and objects (mid row), and we also consider a selection (lower row), which corresponds to the fraction of “bulgeless” galaxies, i.e. those objects with the smallest contribution from a spheroidal component. As for the observational data, we consider four different samples and we plot their results in each panel as follows. We first consider the Wilman & Erwin (2012) sample, and we plot as solid circles their total in the upper row. In the mid row, we plot the sum of the (visually classified) S and Spiral fractions. We include as open squares in the upper row, the total fraction of Early Type galaxies in the SDSS selected by Hyde & Bernardi (2009) on the basis of the SDSS parameter fracDev=1 (the fraction of source light well-fitted by a de Vaucouleur’s profile) and -band axis ratio .
We also consider the catalogue of bulge, disk and total stellar mass estimates for galaxies in the Legacy area of the SDSS presented in Mendel et al. (2014). Those mass estimates are based on updated SDSS photometry and bulge+disc decomposition, using dual Sérsic profiles (Simard et al., 2011). In their analysis, Bluck et al. (2014) consider a subsample of the full catalogue defined by the cuts , , and . represents the scatter in the relation between the estimate of the total stellar mass and the sum of the estimates of bulge and disc separately; the applied cut removes objects with problematic decomposition. is the probability that a source is best-fit by a single Sérsic profile; the applied cut removes sources with possibly spurious components. It is worth stressing that the bulge+disk modeling adopted in Mendel et al. (2014), i.e. the combination of a de Vaucouleur’s bulge and an exponential disk profiles, is unable to accurately recover the total flux of galaxies with Sérsic index larger than 5. For these sources, the model fails in reproducing the bright inner and extended outer profiles, at the same time. Nonetheless, we include also these objects in our analysis, as they might represent some extreme configurations of bulge/disc-dominated sources. In order to assess for the uncertainties in their bulge+disc decomposition, we define two subsamples of the Mendel et al. (2014) catalogues as follows. We first consider all galaxies satisfying the first 3 cuts as in Bluck et al. (2014). We use this catalogue to define a subsample (A) imposing to all objects with , in order to obtain a lower limit on the fraction of bulge-dominated galaxies in the Mendel et al. (2014) sample. Analogously, we define a subsample (B) assuming for sources with , which maximizes the fraction of bulge-dominated galaxies. The shaded area in Fig. 4 represents the confidence region between the resulting fractions of and objects in the two subsamples. Fractions referring to subsample A correspond to the lower and upper envelope of the shaded region in the upper and mid panels respectively (viceversa for subsample B).
Finally, we include results from Fisher & Drory (2011). This local sample allows a finer classification of spheroids into “classical” and “pseudo”-bulges, thus providing a finer comparison with our model predictions with respect to the Mendel et al. (2014) sample, but it contains only 11 galaxies in the stellar mass range of interest (i.e. ). As in all our runs we switched off disc instabilities, our models formally account for the formation of classical bulges only, i.e. we assume that the entire “pseudo”-bulge population is the result of secular processes. We first plot the resulting morphological fractions as stars in the upper and middle panels of Fig. 4. These fractions do not depend on the bulge classification, since there are no galaxies hosting pseudo-bulges with , and in reasonable agreement with both Wilman & Erwin (2012) and Mendel et al. (2014). The hatched histograms in the lower row represents (as in Fontanot et al. 2011) the fraction of galaxies with classical in the Fisher & Drory (2011) sample. We stress that the sample contains a significant number of galaxies hosting pseudo-bulges with , which may hide a (subdominant) merger-driven classical bulge. This effect would tend to reduce the estimated fraction of bulgeless galaxies and the hatched histograms then represent an upper limit to the bulgeless fraction in the sample.
This comparison is meant to account for the uncertainty in the definition of galaxy morphology. In general, there are still large differences in the observational estimates, which explain the apparently contradictory conclusions given in Porter et al. (2014) and Wilman et al. (2013). The tension between different samples is likely due to the different techniques adopted to estimate the relative importance of bulges and discs. The biggest discrepancy is seen in the upper row between the Early Type catalogue of Hyde & Bernardi (2009) and the Elliptical fraction from the Wilman & Erwin (2012) sample; the Mendel et al. (2014) decomposition shows intermediate results, but is in better agreement with the latter sample at the high mass end. In the mid row, we show how the reduced bulge formation efficiency in galaxy mergers impacts the statistics of disc-dominated galaxies. As in Fig. 2, we see that the KAN15 run of the morgana model and the SC-SAM runs provide the best agreement with the Wilman & Erwin (2012) sample, also when model galaxies are compared with sources with a relevant disc component (either Ss or spiral galaxies). However, none of the models and runs considered in this work is able to reproduce the peculiar trends of the Mendel et al. (2014) sample.
Finally, in the lower row, we focus on the number density of “bulgeless” galaxies. The formation of these objects has been claimed to represent a potential challenge for the standard cosmological model (see e.g. Kormendy et al., 2010, and references herein). We showed in Fontanot et al. (2011) that these objects do not constitute a rare population in SAMs, as there is a sufficient number of DM halos with merger-quiet assembly histories to account for local statistics (see also Porter et al., 2014). With respect to the reference runs, both the KAN15 and Kz1 realizations predict an increase of the fraction of galaxies at all mass scales, which improves the agreement with the observations. The increase is relatively mild in DLB07 and SC-SAM and more marked in morgana . This is due to the shorter timescales for merging assumed by the latter model, which induce more galaxy mergers.
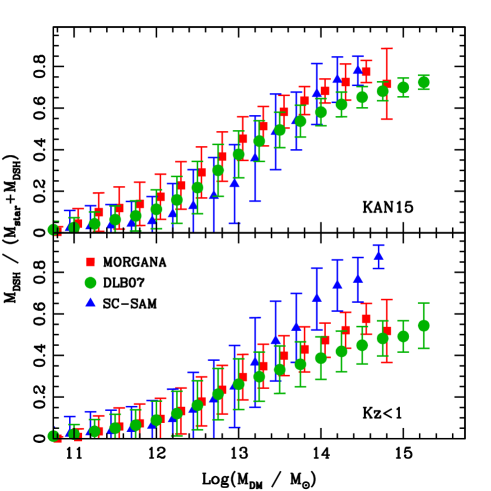
A major role in the Kannan et al. (2015) formulation is played by the stars getting stripped (from the satellite galaxies) or scattered (from the primary discs), and dispersed into the parent DM halo. In Fig. 5, we show the stellar mass in the DSH as a function of halo mass, normalized to the stellar mass of the central galaxy plus the DSH itself. The upper panel refers to KAN15 runs, while the lower panel to Kz1 runs. In all cases, there is a clear trend of a larger contribution of DSH at increasing halo masses. A direct comparison of these DSH estimates with observational constraints is complicated by the intrinsic difficulties in disentangling the contribution to the total cluster luminosities from the central bright galaxy and from the DSH (i.e. the intra cluster light), due to the different techniques and assumptions (see e.g. Zibetti, 2008, for a review on these issues). At face value, our predictions agree well with constraints from Gonzalez et al. (2005, at ), but are larger than the recent estimates from Budzynski et al. (2014, ). Moreover, the differences between the KAN15 and Kz1 runs are small, showing that in these models, most of the DSH is formed at . This confirms that most of the differences at the high mass end between the reference models and the new runs are due to the effect of stellar stripping/dispersion, which reduce the mass of both progenitors, rather than to the influence of gas fraction (as noted above, most model massive galaxies have typically low gas fractions at ).
4 Conclusions
In this paper we study the impact of a different modelling of baryonic (stellar and cold gas) mass transfers associated with galaxy mergers on the distribution of morphological types as a function of hierarchy, stellar mass and parent DM mass. We consider three independently developed SAMs, namely the SC-SAM model, the DLB07 version of the Munich model and morgana . When compared to a local sample of visually classified galaxies, the two latter models have already been shown to overpredict the fraction of Elliptical galaxies at high masses, while reproducing the observed fraction of passive galaxies. Wilman et al. (2013) ascribed this discrepancy to a too high efficiency of morphological transformation (from disc- to bulge-dominated system) during galaxy mergers (which they suggest can be reduced by assuming that a fraction of the satellite galaxy is deposited into the DSH before the merger takes place). On the other hand, Porter et al. (2014) showed that the SC-SAM model underpredicts the fraction of Early Type galaxies in the Hyde & Bernardi (2009) SDSS sample. In this work, we extend the analysis by comparing model predictions to four different observational samples (Hyde & Bernardi, 2009; Fisher & Drory, 2011; Wilman & Erwin, 2012; Mendel et al., 2014) and by considering new prescriptions for the mass exchanges during galaxy merges, recently proposed by Kannan et al. (2015). These authors analyzed high-resolution hydrodynamical simulations of binary mergers, with initial condition extracted from a combination of cosmological simulations and SAMs. The simulations were used to parametrize the strength of baryonic mass transfer between the different components (disc, bulge, halo) as a function of an effective merger ratio (taking into account both the intrinsic merger ratio and the details of the relative orbit).
Our results confirm that the different modelling of mass transfer during mergers leads to significant modification of the distribution of ratios as a function of both stellar and parent halo mass. In particular, the fraction of galaxies, , is reduced at all mass scales. However, runs using the Kannan et al. (2015) fitting formulae at all redshifts result in virtually no galaxy with . Moreover, in these model realizations most of the bulge mass is assembled at . More conservative runs, enabling the new fitting formulae only at (i.e. the redshift range probed by the simulations) provide a better match to the distribution, at the expense of a smaller reduction of . These results suggest the need to extend the Kannan et al. (2015) work at higher redshifts. In fact, discs are likely very different structures with respect to local Spirals (see e.g. Förster Schreiber et al., 2009), therefore we expect them to show a different response to the tidal fields triggered by close encounters, with respect to their local counterparts.
The detailed effects of the new prescriptions on the distribution of galaxy morphologies are strongly SAM dependent. morgana shows a significant reduction of which moves the model predictions in better agreement with the Wilman et al. (2013) data. In DLB07, the most relevant effect is that of decreasing the mass of the most massive galaxies, due to the stripping effects included in Kannan et al. (2015) formulae. At intermediate-to-low mass scales, model predictions are similar to the SDSSRC3 fractions, while at higher masses they are closer to the early type fraction in Hyde & Bernardi (2009) than to the estimate from SDSSRC3. Finally, the effect of the new prescriptions is limited in SC-SAM due to the fact that the reference run already predicts a reduced with respect to the other two SAMs we consider: this model still undepredicts the Early Type fractions as in Hyde & Bernardi (2009), but its predictions are similar to the values from SDSSRC3.
Overall, the new formulation predicts a decrease of the fraction of bulge-dominated () galaxies and a corresponding increase in the fraction of disc-dominated galaxies (including bulgeless galaxies). The comparison between model predictions and data is complicated by the different observational estimates for the fraction of bulge-dominated objects. As an additional test, in this work we also consider the morphological fractions coming from the Mendel et al. (2014) sample. In general, this sample provides morphological fractions which are intermediate with respect to the Wilman & Erwin (2012) and Hyde & Bernardi (2009) datasets, but at the high mass end, bulge+disk decomposition in this sample is consistent with the results based on visual inspection of SDSSRC3 galaxies. It is worth stressing that the spread between the different observational constraints for is significant. Much of this tension is directly linked to the different techniques used to estimate galaxy morphology, and ranging from purely automatic classification to human visual inspection. Additional sources of uncertainty come from the presence of fine structure features like spiral arms and bars, whose detection strongly depend on the data quality the classification is performed on (independently from the overall strategy). Much work is therefore needed, on the observational side, in order to assess the consistency of the different classifications and/or to understand the systematics involved in each choice. The end product of this process will provide even stronger constraints for modelers trying to quantify the amount of morphological transformation connected to the different channels of bulge growth.
We stress that the Kannan et al. (2015) fitting formulae are based on a small sample of high-resolution hydrodynamical simulations (19 binary isolated mergers, covering a fair range of merger ratios), and their results show a large scatter around the fitted relations. More high-resolution simulations are thus required to better quantify both the mean relations and their scatter, which could also play a role in defining the observed distribution of morphological types. Moreover, galaxy mergers in SAMs are assumed to be binary, i.e. involving only two galaxies. This is an idealized assumption useful for most physical configurations, but not representative when more than one satellite interacts with the central galaxy at the same time (see e.g. Villalobos et al., 2014). More work in this direction is needed to characterize mass transfers in multiple merger configurations, as a function of the relative masses and orbits.
Acknowledgements
FF acknowledges financial support from the grants PRIN MIUR 2009 “The Intergalactic Medium as a probe of the growth of cosmic structures”, PRIN INAF 2010 “From the dawn of galaxy formation” and from the Klaus Tschira Foundation. MH acknowledges financial support from the European Research Council via an Advanced Grant under grant agreement no. 321323 (NEOGAL). RSS thanks the Downsbrough family for their generous support. DJW thanks the Deutsche Forschungsgemeinschaft for funding via project WI 3871/1-1
References
- Adelman-McCarthy et al. (2006) Adelman-McCarthy J. K., Agüeros M. A., Allam S. S., Anderson K. S. J., Anderson S. F., Annis J., Bahcall N. A., Baldry I. K. e. a., 2006, ApJS, 162, 38
- Blanton et al. (2005) Blanton M. R., Schlegel D. J., Strauss M. A., Brinkmann J., Finkbeiner D., Fukugita M., Gunn J. E., Hogg D. W., Ivezić Ž., Knapp G. R., Lupton R. H., Munn J. A., Schneider D. P., Tegmark M., Zehavi I., 2005, AJ, 129, 2562
- Bluck et al. (2014) Bluck A. F. L., Mendel J. T., Ellison S. L., Moreno J., Simard L., Patton D. R., Starkenburg E., 2014, MNRAS, 441, 599
- Bower et al. (2006) Bower R. G., Benson A. J., Malbon R., Helly J. C., Frenk C. S., Baugh C. M., Cole S., Lacey C. G., 2006, MNRAS, 370, 645
- Boylan-Kolchin et al. (2008) Boylan-Kolchin M., Ma C.-P., Quataert E., 2008, MNRAS, 383, 93
- Brennan et al. (2015) Brennan R., Pandya V., Somerville R. S., Barro G., Taylor E. N., Wuyts S., Bell E. F., Dekel A., Ferguson H. C., McIntosh D. H., Papovich C., Primack J., 2015, ArXiv e-prints
- Budzynski et al. (2014) Budzynski J. M., Koposov S. E., McCarthy I. G., Belokurov V., 2014, MNRAS, 437, 1362
- Chabrier (2003) Chabrier G., 2003, ApJ, 586, L133
- Davies & Illingworth (1983) Davies R. L., Illingworth G., 1983, ApJ, 266, 516
- De Lucia & Blaizot (2007) De Lucia G., Blaizot J., 2007, MNRAS, 375, 2
- De Lucia et al. (2010) De Lucia G., Boylan-Kolchin M., Benson A. J., Fontanot F., Monaco P., 2010, MNRAS, 406, 1533
- De Lucia et al. (2011) De Lucia G., Fontanot F., Wilman D., Monaco P., 2011, MNRAS, 414, 1439
- de Vaucouleurs et al. (1991) de Vaucouleurs G., de Vaucouleurs A., Corwin Jr. H. G., Buta R. J., Paturel G., Fouque P., 1991, S&T, 82, 621
- Debattista et al. (2006) Debattista V. P., Mayer L., Carollo C. M., Moore B., Wadsley J., Quinn T., 2006, ApJ, 645, 209
- Dressler (1980) Dressler A., 1980, ApJ, 236, 351
- Emsellem et al. (2011) Emsellem E., Cappellari M., Krajnović D., Alatalo K., Blitz L., Bois M., Bournaud F., Bureau M., et al. 2011, MNRAS, 414, 888
- Erwin et al. (2015) Erwin P., Saglia R. P., Fabricius M., Thomas J., Nowak N., Rusli S., Bender R., Vega Beltrán J. C., Beckman J. E., 2015, MNRAS, 446, 4039
- Fisher & Drory (2011) Fisher D. B., Drory N., 2011, ApJ, 733, L47+
- Fontanot et al. (2009) Fontanot F., De Lucia G., Monaco P., Somerville R. S., Santini P., 2009, MNRAS, 397, 1776
- Fontanot et al. (2011) Fontanot F., De Lucia G., Wilman D., Monaco P., 2011, MNRAS, 416, 409
- Fontanot et al. (2011) Fontanot F., Pasquali A., De Lucia G., van den Bosch F. C., Somerville R. S., Kang X., 2011, MNRAS, 413, 957
- Förster Schreiber et al. (2009) Förster Schreiber N. M., Genzel R., Bouché N., Cresci G., Davies R., Buschkamp P., Shapiro K., Tacconi L. J. e. a., 2009, ApJ, 706, 1364
- Gonzalez et al. (2005) Gonzalez A. H., Zabludoff A. I., Zaritsky D., 2005, ApJ, 618, 195
- Governato et al. (2009) Governato F., Brook C. B., Brooks A. M., Mayer L., Willman B., Jonsson P., Stilp A. M., Pope L., Christensen C., Wadsley J., Quinn T., 2009, MNRAS, 398, 312
- Guo et al. (2013) Guo Q., White S., Angulo R. E., Henriques B., Lemson G., Boylan-Kolchin M., Thomas P., Short C., 2013, MNRAS, 428, 1351
- Hirschmann et al. (2012) Hirschmann M., Somerville R. S., Naab T., Burkert A., 2012, MNRAS, 426, 237
- Hopkins et al. (2009) Hopkins P. F., Cox T. J., Younger J. D., Hernquist L., 2009, ApJ, 691, 1168
- Hopkins et al. (2009) Hopkins P. F., Somerville R. S., Cox T. J., Hernquist L., Jogee S., Kereš D., Ma C., Robertson B., Stewart K., 2009, MNRAS, 397, 802
- Hubble (1926) Hubble E. P., 1926, ApJ, 64, 321
- Hyde & Bernardi (2009) Hyde J. B., Bernardi M., 2009, MNRAS, 394, 1978
- Kannan et al. (2015) Kannan R., Macciò A., Fontanot F., Moster B., Karman W., Somerville R., 2015, MNRAS submitted
- Klypin et al. (2011) Klypin A. A., Trujillo-Gomez S., Primack J., 2011, ApJ, 740, 102
- Kormendy et al. (2010) Kormendy J., Drory N., Bender R., Cornell M. E., 2010, ApJ, 723, 54
- Kormendy & Kennicutt (2004) Kormendy J., Kennicutt Jr. R. C., 2004, ARA&A, 42, 603
- Krajnović et al. (2008) Krajnović D., Bacon R., Cappellari M., Davies R. L., de Zeeuw P. T., Emsellem E., Falcón-Barroso J., Kuntschner H., McDermid R. M., Peletier R. F., Sarzi M., van den Bosch R. C. E., van de Ven G., 2008, MNRAS, 390, 93
- Laurikainen et al. (2010) Laurikainen E., Salo H., Buta R., Knapen J. H., Comerón S., 2010, MNRAS, 405, 1089
- Lo Faro et al. (2009) Lo Faro B., Monaco P., Vanzella E., Fontanot F., Silva L., Cristiani S., 2009, MNRAS, 399, 827
- Mendel et al. (2014) Mendel J. T., Simard L., Palmer M., Ellison S. L., Patton D. R., 2014, ApJS, 210, 3
- Monaco et al. (2007) Monaco P., Fontanot F., Taffoni G., 2007, MNRAS, 375, 1189
- Monaco et al. (2002) Monaco P., Theuns T., Taffoni G., Governato F., Quinn T., Stadel J., 2002, ApJ, 564, 8
- Moster et al. (2014) Moster B. P., Macciò A. V., Somerville R. S., 2014, MNRAS, 437, 1027
- Moster et al. (2011) Moster B. P., Macciò A. V., Somerville R. S., Naab T., Cox T. J., 2011, MNRAS, 415, 3750
- Porter et al. (2014) Porter L. A., Somerville R. S., Primack J. R., Johansson P. H., 2014, MNRAS, 444, 942
- Robertson et al. (2006) Robertson B., Bullock J. S., Cox T. J., Di Matteo T., Hernquist L., Springel V., Yoshida N., 2006, ApJ, 645, 986
- Simard et al. (2011) Simard L., Mendel J. T., Patton D. R., Ellison S. L., McConnachie A. W., 2011, ApJS, 196, 11
- Somerville et al. (2008) Somerville R. S., Hopkins P. F., Cox T. J., Robertson B. E., Hernquist L., 2008, MNRAS, 391, 481
- Springel et al. (2005) Springel V., White S. D. M., Jenkins A., Frenk C. S., Yoshida N., Gao L., Navarro J., Thacker R., Croton D., Helly J., Peacock J. A., Cole S., Thomas P., Couchman H., Evrard A., Colberg J., Pearce F., 2005, Nature, 435, 629
- Taffoni et al. (2003) Taffoni G., Mayer L., Colpi M., Governato F., 2003, MNRAS, 341, 434
- Villalobos et al. (2014) Villalobos Á., De Lucia G., Murante G., 2014, MNRAS, 444, 313
- Vulcani et al. (2011) Vulcani B., Poggianti B. M., Aragón-Salamanca A., Fasano G., Rudnick G., Valentinuzzi T., Dressler A., Bettoni D., Cava A., D’Onofrio M., Fritz J., Moretti A., Omizzolo A., Varela J., 2011, MNRAS, 412, 246
- Wang et al. (2008) Wang J., De Lucia G., Kitzbichler M. G., White S. D. M., 2008, MNRAS, 384, 1301
- Weinzirl et al. (2009) Weinzirl T., Jogee S., Khochfar S., Burkert A., Kormendy J., 2009, ApJ, 696, 411
- Wilman & Erwin (2012) Wilman D. J., Erwin P., 2012, ApJ, 746, 160
- Wilman et al. (2013) Wilman D. J., Fontanot F., De Lucia G., Erwin P., Monaco P., 2013, MNRAS, 433, 2986
- Wilman et al. (2009) Wilman D. J., Oemler Jr. A., Mulchaey J. S., McGee S. L., Balogh M. L., Bower R. G., 2009, ApJ, 692, 298
- Zibetti (2008) Zibetti S., 2008, in Davies J. I., Disney M. J., eds, IAU Symposium Vol. 244 of IAU Symposium, Statistical Properties of the IntraCluster Light from SDSS Image Stacking. pp 176–185