NuSTAR discovery of an unusually steady long-term spin-up of the Be binary 2RXP J130159.6-635806
Abstract
We present spectral and timing analysis of NuSTAR observations of the accreting X-ray pulsar 2RXP J130159.6-635806. The source was serendipitously observed during a campaign focused on the gamma-ray binary PSR B1259-63 and was later targeted for a dedicated observation. The spectrum has a typical shape for accreting X-ray pulsars, consisting of a simple power law with an exponential cutoff starting at keV with a folding energy of keV. There is also an indication of the presence of a 6.4 keV iron line in the spectrum at the significance level. NuSTAR measurements of the pulsation period reveal that the pulsar has undergone a strong and steady spin-up for the last 20 years. The pulsed fraction is estimated to be , and is constant with energy up to 40 keV. The power density spectrum shows a break towards higher frequencies relative to the current spin period. This, together with steady persistent luminosity, points to a long-term mass accretion rate high enough to bring the pulsar out of spin equilibrium.
1 Introduction
2RXP J130159.6-635806, first discovered by the ROSAT observatory, was later rediscovered in hard X-rays by the INTEGRAL/IBIS telescope and designated with the name IGR J13020-6359 (Bird et al., 2006; Revnivtsev et al., 2006). The first comprehensive analysis of the temporal and spectral X-ray properties of this source was done by Chernyakova et al. (2005) using data from the ASCA, BeppoSAX, INTEGRAL and XMM-Newton observatories. In particular, XMM-Newton data showed coherent pulsations with a period of around 700 s. Joint spectral analysis of XMM-Newton and INTEGRAL data demonstrated that the spectral shape is very typical for accretion-powered X-ray pulsars (namely, an absorbed power law with a high-energy cut-off).
Based on 2MASS archival data, Chernyakova et al. (2005) proposed that the binary companion to 2RXP J130159.6-635806 is a Be star at a distance of 4–7 kpc. This suggestion was later confirmed by Coleiro et al. (2013), who reported the presence of emission lines of He I 2.0594 m and Br(7–4) 2.1663 m, which are typical for a Be star. The spectral type of the optical counterpart was determined to be B0.5Ve. The orbital period of the binary remains unknown.
X-ray pulsars in binary systems with Be companions (BeXRPs) typically manifest themselves as transient sources through either Type I (periodic flares related to the periastron passage) or Type II outbursts (powerful rare transient events), or a combination of both (e.g., Reig, 2011). 2RXP J130159.6-635806 shows several differences from a standard transient BeXRP. Specifically, it has a relatively low persistent flux, a long pulse period, and it does not demonstrate either Type I or Type II outbursts. Chernyakova et al. (2005), however, did report some variability of its X-ray flux.
Therefore, there are substantial reasons to consider 2RXP J130159.6-635806 as a member of the subclass of persistent BeXRPs (Reig & Roche, 1999). So far, only a few members of this relatively small category of objects have been studied in detail: 4U 0352+309/X Persei, RX J0146.9+6121/LS I +61 235, RX J0440.9+4431, and RX J1037.5-564 (Haberl et al., 1998; Reig & Roche, 1999).
In this paper, we present results of a comprehensive analysis of the temporal and spectral properties of 2RXP J130159.6-635806 in a broad energy range, finding some properties that are very unusual for BeXRPs. All errors are quoted at the 90% confidence level unless otherwise stated.
2 Observations
2RXP J130159.6-635806 was initially serendipitously observed with Nuclear Spectroscopic Telescope Array (NuSTAR) (Harrison et al., 2013) during observations of the gamma-ray binary PSR B1259-63, with three data sets taken in 2014 May-June (Chernyakova et al., in prep.). In one observation, 2RXP J130159.6-635806 appears in the corner of NuSTAR’s field of view (FOV), and, in two more, the source is at the extreme edge of the FOV. Despite the large off-axis angles, the NuSTAR data were successfully used to extract coherent pulsations. This motivated the NuSTAR team to trigger an on-axis 30 ks observation of 2RXP J130159.6-635806 in order to obtain high-quality data for spectral and timing analysis. Table 1 lists the NuSTAR observations used in this work.
| Seq. | Obs. | Start Time | Exp. | Net Count RateaaNet count rate in keV band for FPMA and FPMB extracted from a circular region with a radius of . | PeriodbbMeasured pulsation period for 2RXP J130159.6-635806. | |
|---|---|---|---|---|---|---|
| Num. | ID | [ UTC ] | [ ks ] | [ counts s-1 ] | [ s ] | |
| 1 | 30002017004 | 2014-05-04 10:01 | 33.3 | |||
| 2 | 30002017008 | 2014-06-02 19:21 | 26.4 | |||
| 3 | 30002017010 | 2014-06-14 17:21 | 29.1 | |||
| 4 | 30001032002 | 2014-06-24 00:06 | 31.6 | |||
NuSTAR carries two co-aligned identical X-ray telescopes operating in wide energy band from 3 to 79 keV with angular resolution of 18” (FWHM) and half-power diameter (HPD) of 58”. Spectral resolution of eV (FWHM) at keV is provided by independent focal planes for each telescope, usualy referred as focal plane module A and B (FPMA and FPMB).
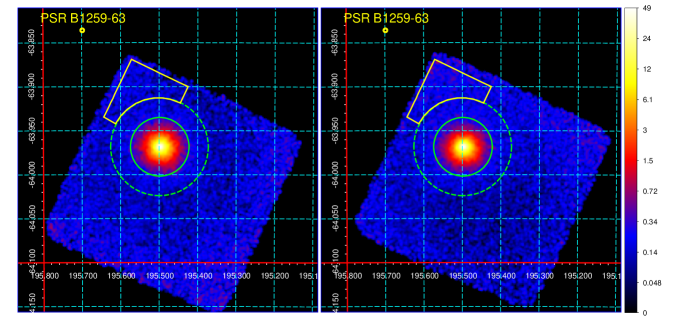
NuSTAR data can have systematic positional offsets as high as . Prior to extraction, we therefore corrected the world coordinate system (WCS) of the event files for the four observations to match the PSR B1259-63 and 2RXP J130159.6-635806 centroid positions based on cataloged coordinates.
Since the NuSTAR PSF has wide wings (Harrison et al., 2013; An et al., 2014), we investigated how the surface brightness of the source changes with radius in order to determine regions where the source dominates over the background. We found that 2RXP J130159.6-635806 is well above background within ( of PSF enclosed energy; see, e.g., An et al., 2014), and that the background count rate can be robustly measured at radii from the source. Taking this into consideration, we defined the corresponding extraction regions shown in Fig. 1 for the 4th (on-axis) observation. The other three observations, for which 2RXP J130159.6-635806 is far off-axis, have been treated similarly. Following NuSTAR recommended standard practice, we chose the background regions to be on the same detector chip as the source.
3 Timing analysis
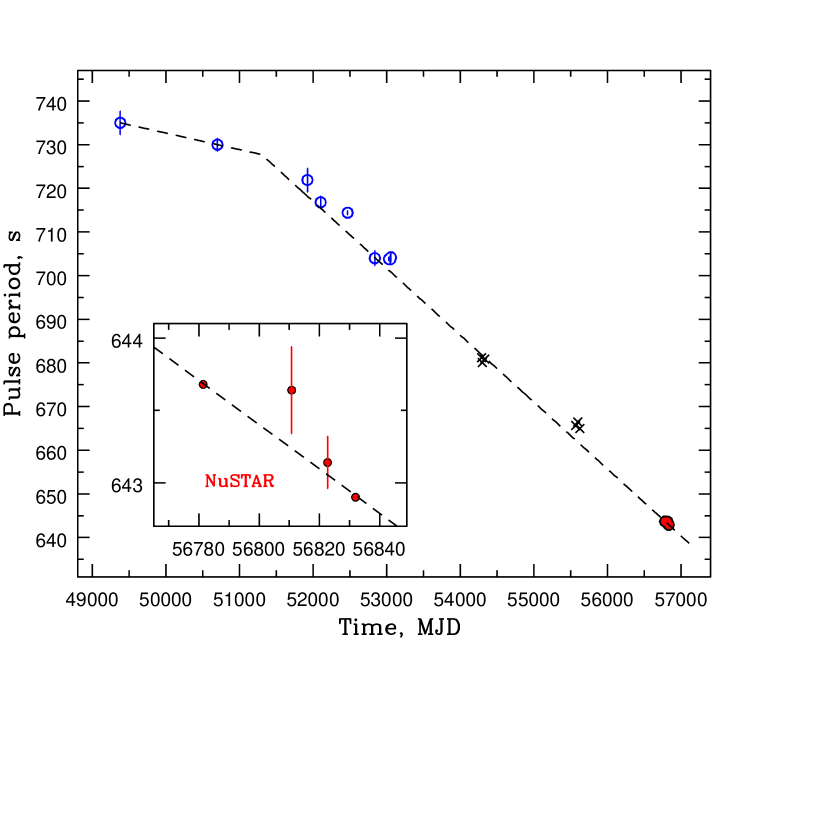
2RXP J130159.6-635806 is a known source of coherent X-ray pulsations at a period of s with an average spin-up rate of Hz s-1 (Chernyakova et al., 2005). We performed timing analysis of the NuSTAR data using the xronos (epoch folding tool efsearch; Leahy et al., 1983) after barycentering the data with barycorr. For each NuSTAR observation, the pulse period and its uncertainty were calculated following the procedure described in (Boldin, Tsygankov, & Lutovinov, 2013). Namely, a large number () of source light curves were simulated, the pulse period of each one was determined with efsearch, and the distribution of the corresponding pulse periods was constructed. The mean value of this distribution and its standard deviation were taken as the pulse period and its uncertainty, correspondingly. Table 1 lists period results derived from the FPMA and FPMB combined light curves. The inset of Fig. 2 shows the evolution of the spin period as a function of time.
As seen from Table 1 and Fig. 2, all four NuSTAR datasets are suitable for pulsation detection. It is also quite evident that periods recorded over the time span of 50 days are not consistent with each other, clearly showing a decrease in the period. We utilized the 1st and 4th NuSTAR observations, which have the most accurate period measurements and also span the full duration of the NuSTAR coverage, to measure a period derivative of s/day, equivalent to s s-1, or Hz s-1. This is in agreement with the Chernyakova et al. (2005) spin-up measurement of the second interval of their data, after the ‘break’ at MJD ( Hz s-1). This is quite remarkable since there is almost a decade between the period measurements.
3.1 Pulse period long-term evolution
2RXP J130159.6-635806 regularly fell into the FOV of various X-ray telescopes thanks to extensive observational campaigns dedicated to PSR B1259-63 which is located only away. This allows us to investigate the long-term evolution of the pulse period. We analyzed the XMM-Newton (Jansen et al., 2001) archival data from 2007-2011 using the procedures described by Chernyakova et al. (2005) and Science Analysis Software (SAS) version 14.0.0. The list of selected XMM-Newton observations with corresponding period measurements are shown in Table 2.
| Obs. | Start Time | Exp. | Period |
|---|---|---|---|
| ID | [ UTC ] | [ ks ] | [ s ] |
| 0504550501 | 2007-07-08 12:01 | 14.1 | |
| 0504550601 | 2007-07-16 19:59 | 55.3 | |
| 0504550701 | 2007-08-17 08:38 | 11.4 | |
| 0653640401 | 2011-01-06 17:37 | 19.9 | |
| 0653640501 | 2011-02-02 18:59 | 26.3 | |
| 0653640601 | 2011-03-04 05:59 | 12.9 |
Fig. 2 presents the long-term evolution of the period, showing that the 2RXP J130159.6-635806 neutron star has undergone very strong and steady spin-up during the last 20 years. The first available value of spin period, measured in 1994, is 735 s (Chernyakova et al., 2005). The most recent measurements by NuSTAR, from 2014, show the period to be around 643 s (Table 1). This means that during the last years the spin period decreased by s, corresponding to a mean spin-up rate of s s-1. Fig. 2 shows a change in the average spin-up rate, first reported by Chernyakova et al. (2005).
We approximated the long-term period evolution with a linear function with one change in slope. A fit shows that the break occurred at MJD (mid 1999) with a spin-up rate before and after the break of s s-1 and s s-1, respectively. As seen from the fit parameters, the spin-up rate becomes significantly higher after the break. As noted above, the inset of Fig. 2 shows that the NuSTAR data points fit the long-term spin-up rate with remarkably high precision.
Similar behavior was observed for the X-ray pulsar GX 1+4, which showed steady spin up for more than a decade (see, e.g., Bildsten et al., 1997; González-Galán et al., 2012). However, GX 1+4 belongs to the subclass of accreting X-ray pulsars known as symbiotic X-ray binaries (SyXBs). For BeXRPs, persistent sources typically demonstrate pulse periods that are relatively stable. Examples include the population of Be systems in the Small Magellanic Cloud (Klus et al., 2014) and the well-known low luminosity Galactic system X Persei (Lutovinov et al., 2012). Transient BeXRPs show strong spin-up during Type I and Type II outbursts (Bildsten et al., 1997) with significant spin-down episodes in between (see, e.g., Postnov et al., 2015). Therefore, 2RXP J130159.6-635806 is a unique source among the BeXRPs because it demonstrates steady and high long-term spin-up with a relatively low and stable luminosity.
3.2 Pulse profile and pulsed fraction
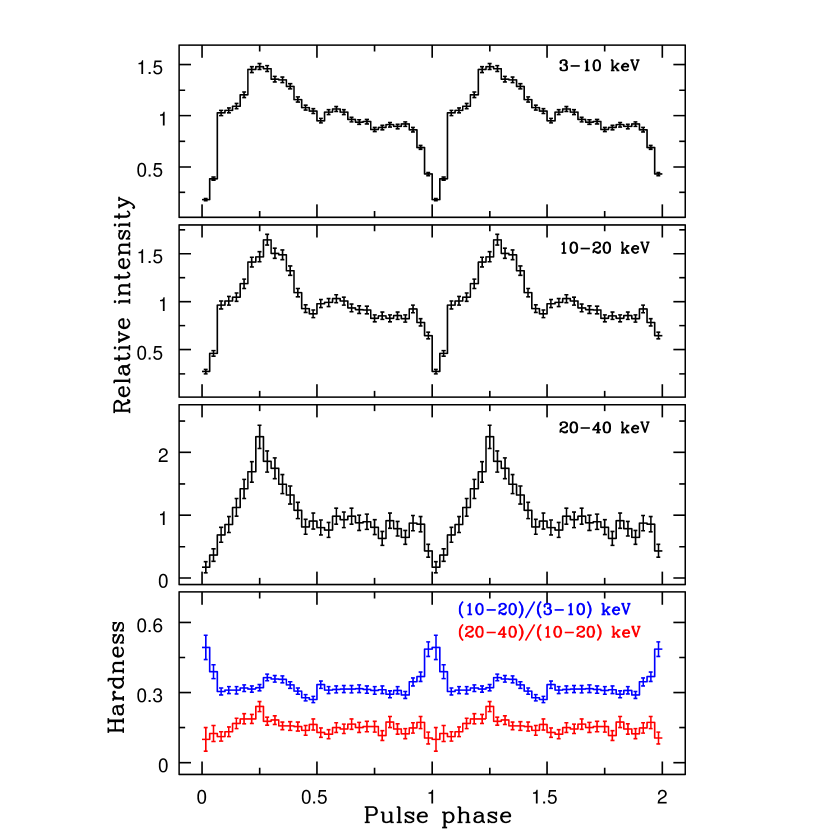
Pulsar pulse profiles and their evolution with luminosity and energy band depend on the geometrical and physical properties of the emitting regions in the vicinity of the neutron star. In Fig. 3, the NuSTAR pulse profiles of 2RXP J130159.6-635806 are shown in three different energy bands: 3–10, 10–20 and 20–40 keV. The lower panel shows “soft” ((10–20)/(3–10) keV) and “hard” ((20–40)/(10–20) keV) hardness ratios.
At all energies, the pulse profile can roughly be divided into one main peak at phases 0.0–0.5 and two smaller peaks at phases 0.5–0.75 and 0.75–1.0. The main feature that changes with energy is the depth of the minimum at phase 0.0. As shown in the lower panel of Fig. 3, while the “hard” hardness ratio is almost constant, the “soft” hardness ratio shows a maximum at phase 0.0 due to an increase in the depth of the minimum at 3–10 keV. Such behavior is caused by differences in the source spectrum with pulse phase (see Section 4).
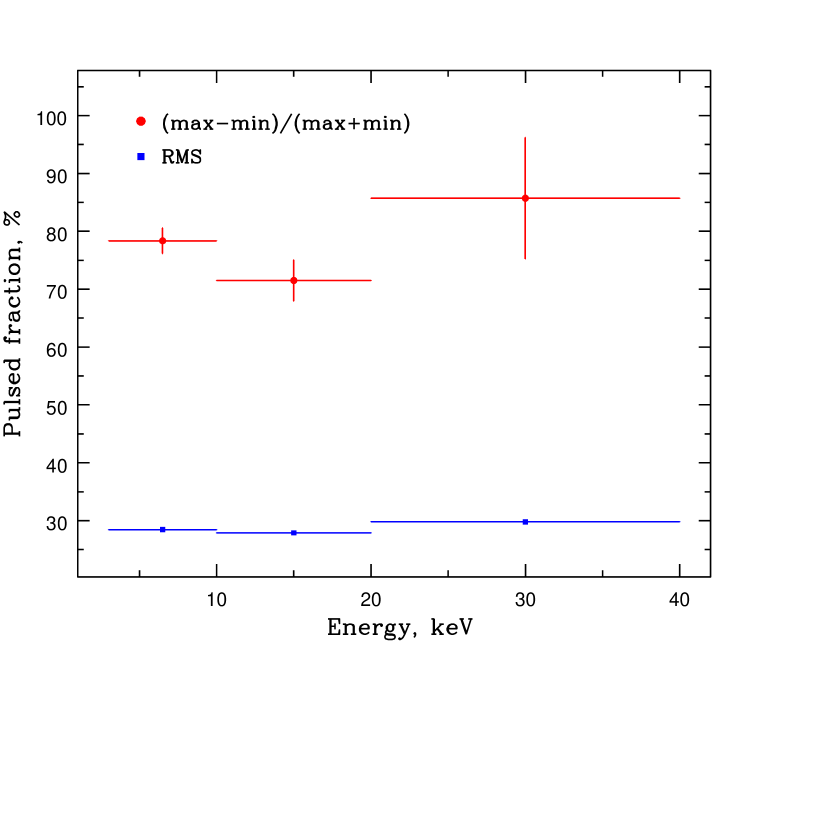
Fig. 4 shows the pulsed fraction as a function of energy. The pulsed fraction is defined as , where and are the maximum and minimum intensities in the pulse profile, respectively. Defined in this way, the pulsed fraction is very high (about 80%). The alternative way to characterize the pulsed fraction is the relative Root Mean Square (RMS), which can be calculated using the following equation:
| (1) |
where is the background-corrected count rate in a given bin of the pulse profile, is the count rate averaged over the pulse period, and N is the total number of phase bins in the profile ( in our analysis). The deviation obtained in this way reflects the variability of the source pulse profile in a manner that is not sensitive to outliers like the narrow features seen in the profile of 2RXP J130159.6-635806. Therefore, this quantity has a value of around 30% that is much lower than the classically determined pulsed fraction and also independent of the energy band (see Fig. 4).
It is interesting to note that in contrast to the majority of X-ray pulsars (Lutovinov & Tsygankov, 2009), 2RXP J130159.6-635806 does not show an increase in the pulsed fraction at higher energies. Such uncharacteristic behavior was previously observed for another persistent BeXRP – RX J0440.9+4431 (Tsygankov, Krivonos, & Lutovinov, 2012). On the other hand, Fig. 3 shows that the pulsed fraction increases somewhat with energy if is defined from the the pulse plateau rather than from the pulse minimum. In other words, the peak-to-plateau difference slightly grows with energy.
3.3 Power Spectrum
The observed 20-year strong and steady spin-up of 2RXP J130159.6-635806 reveals the existence of a long-term accelerating torque, which indicates that the binary interaction must lead to regular accretion over a decade-long time scale, although this could certainly be episodic (e.g., at periastron passages). The torque can be transferred by matter accreted from either the disc around the neutron star or a stellar wind from the optical counterpart. Unfortunately, there is no strong observational evidence allowing us to distinguish between these two different accretion channels. In both scenarios, this process is defined mainly by the mass accretion rate and the magnetic field strength (see, e.g., Ghosh & Lamb, 1979).
Due to the unknown distance of 2RXP J130159.6-635806, the luminosity and mass accretion rate are highly uncertain; the magnetic field is also unknown since no cyclotron line is found in the energy spectrum (Sect. 4). However, some qualitative conclusions about the interaction between the accretion disk and the neutron star magnetosphere can be made from the noise power spectrum of the X-ray pulsar.
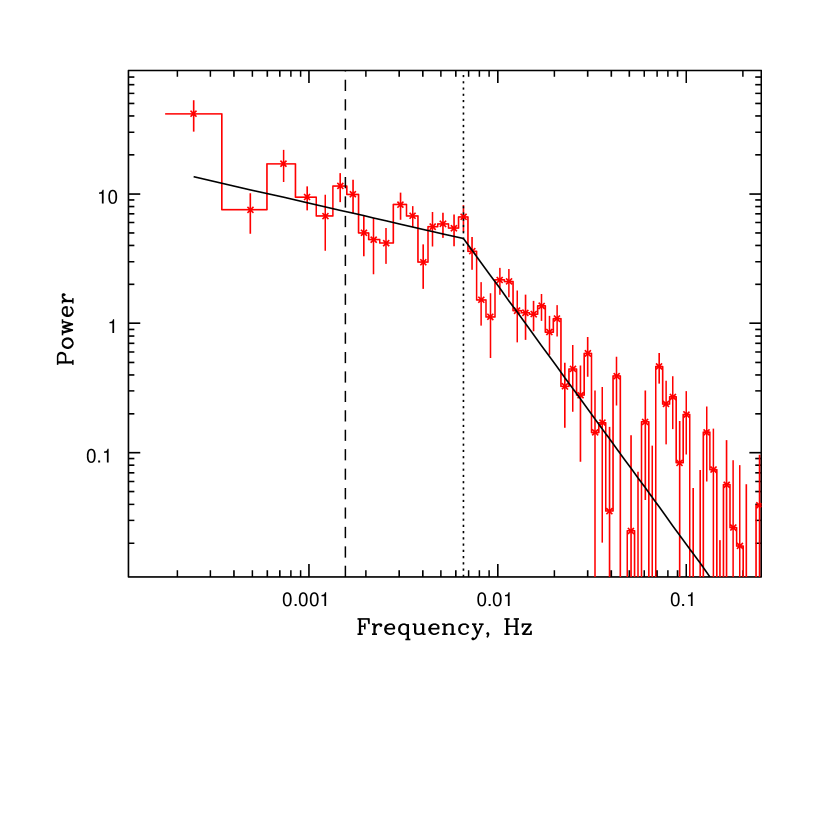
According to the “perturbation propagation” model, stochastic variations of viscous stresses in the accretion disc cause variations of the mass accretion rate (Lyubarskii, 1997; Churazov et al., 2001). This, in turn, results in a specific shape of the Power Density Spectrum (PDS) of the emerging light curve. Namely, it will appear as a power law with slope –1 to –1.5 (but the exact value is not well established for X-ray pulsars) up to the break frequency, which is the highest frequency that can be generated in the accretion disk (Lyubarskii, 1997).
In the case of a highly magnetized neutron star, this maximal frequency is limited by the Keplerian frequency at the magnetospheric radius, above which one can expect a cutoff in the source PDS (Revnivtsev et al., 2009). If the source stays in spin equilibrium (corotation), the cutoff frequency will coincide with the spin frequency of the pulsar, whereas, in the case of spin-up (increased mass accretion rate), the magnetosphere will be squeezed and additional noise will be generated at higher frequencies. If the mass accretion rate is known (i.e., the distance to the source is known), this property of the PDS can be used to estimate the magnetic field strength of the neutron star (Revnivtsev et al., 2009; Tsygankov, Krivonos, & Lutovinov, 2012; Doroshenko et al., 2014). The appearance of the break in the PDS does not necessarily indicate that accretion is from a disk. There are wind-accreting sources in spin equilibrium also showing a break in their PDSs around the pulse frequency (Hoshino & Takeshima, 1993). However, the evolution of the PDS shape aw a function of mass accretion rate in such systems is not well studied.
In Fig. 5, we show the PDS of 2RXP J130159.6-635806 obtained with the NuSTAR data in the 4th observation after subtracting the pulse profile folded with the measured period from the light curve. The solid line represents the fitting model in the form of a broken power law. The measured break frequency is 0.0066 Hz (shown by dotted line), and it is clear that it is shifted towards higher frequencies relative to the spin frequency in this observation (0.0015 Hz; shown by dashed vertical line). The power-law slope above the break frequency is fixed at –2 (Revnivtsev et al., 2009). The best-fit value of the slope below the break is . Given the steady persistent luminosity, we conclude that the spin-up observed during last years is caused by a long-term mass accretion rate that is high enough to squeeze the magnetosphere inside the corotational radius. This finding confirms the uniquness of 2RXP J130159.6-635806 among the other X-ray pulsars in binary systems with Be companions.
4 Spectral analysis
We used nuproducts, a part of the NuSTARDAS package, to extract source and background spectra and to generate NuSTAR response matrix (RMF) and effective area (ARF) files for a point source. In our analysis we utilized the most recent calibration database (CALDB), version 20150316. The extracted spectra were then grouped to have more than 20 counts per bin using the grppha tool from the HEAsoft 6.15.1 package. We fit the NuSTAR spectra using xspec version 12.8.1 (Arnaud, 1996).
4.1 Pulse phase-averaged spectroscopy
According to measurements from the ASCA and XMM-Newton observatories, the spectrum of 2RXP J130159.6-635806 is characterized by a moderate absorption value cm-2, which is stable over a dozen years (Chernyakova et al., 2005). This value was obtained by approximating the source spectra as a power law model modified by interstellar absorption (wabs model in the XSPEC package). Note that it is just slightly higher than the value of the interstellar hydrogen absorption cm-2 determined by Dickey & Lockman (1990) in the direction of 2RXP J130159.6-635806.
In the first three NuSTAR observations 2RXP J130159.6-635806 serendipitously appeared highly offset from the optical axis, and at the large off-axis angles the absolute flux measurements can be affected by inaccurate PSF positioning and subsequent inapropriate weighting in the spectrum extraction procedure. This leads to large systematics for the extracted spectra. Therefore, we restrict detailed analysis of the source spectrum to the data obtained in the 4th (on-axis) observation, which provides high-quality data.
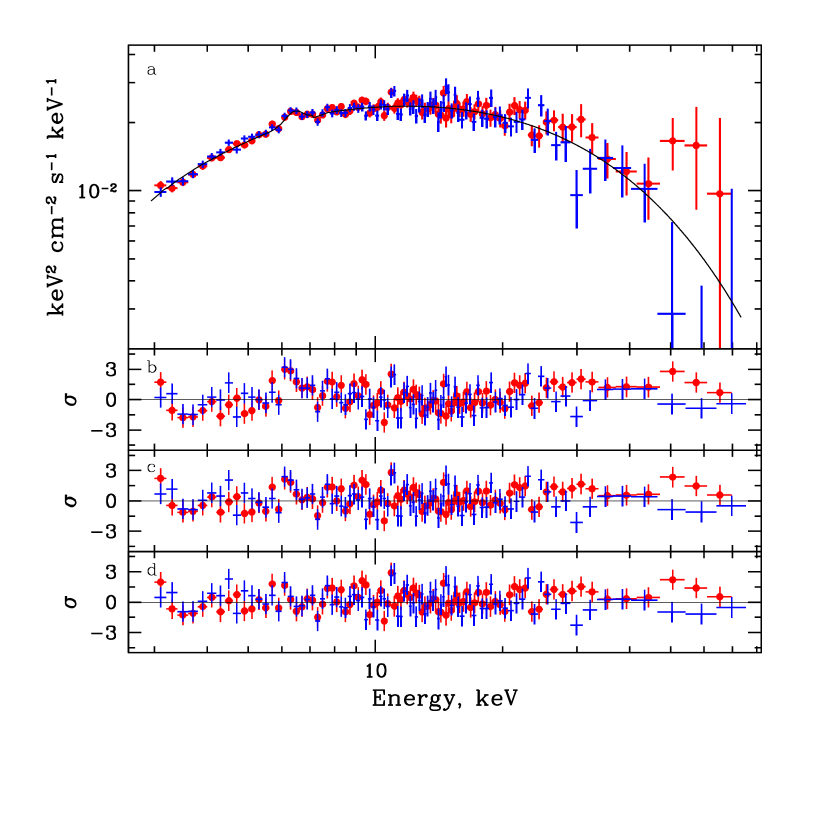
In general, the spectrum of 2RXP J130159.6-635806 has a shape which is typical for accreting pulsars in binary systems, showing a hard spectrum with an exponential cutoff at high energies. Fig. 6 (a) presents the phase-averaged spectrum approximated with the most suitable spectral model determined below. We initially modeled data with a cutoff power-law model (cutoffpl in the XSPEC package)
| (2) |
where is the photon index, is the characteristic energy of the cutoff (e.g., the folding energy), and is a normalization. This model was modified by interstellar absorption in the form of the wabs model. As the working energy range of the NuSTAR observatory begins at 3 keV, it is not very sensitive to measuring low absorption columns. Therefore, in the following analysis, the interstellar absorption was fixed to the value cm-2 measured by Chernyakova et al. (2005). Note that we simultaneously fitted spectra obtained by both NuSTAR modules. To take into account the uncertainty in their relative calibrations, which may be even more of a concern for the observations where the source is highly offset from the optical axis, we added a cross-calibration constant between the modules. The fitting parameters for different data sets are shown in Table 3.
The ‘cutoff’ model approximates the source spectrum relatively well with for 921 degrees-of-freedom (dof; see Table 3). Nevertheless, a wave-like structure is clearly seen in the residual panel Fig. 6 (b). To improve the quality of the fit, we applied another continuum model in the form of a power-law multiplied by a high-energy cutoff (highecut model in the XSPEC package; White et al. 1983). This model can be written as:
| (3) |
where is the energy where the cutoff starts. As in the previous case, we fixed the interstellar absorption value. Residuals of modeling the source spectrum with ‘highecut’ are presented in Fig. 6 (c), and best fit parameters are listed in Table 3. The ‘highecut’ model significantly improves the quality of the fit ( for 920 dof). The high-energy cutoff value is found to be keV, which is significantly lower than the value of keV reported by Chernyakova et al. (2005) using simultaneous XMM-Newton and INTEGRAL data. The apparent discrepancy is probably due to the lower statistical quality of the INTEGRAL data and the gap between the energy bands covered by the XMM-Newton and INTEGRAL observatories. An additional possible problem is that the cutoff energy keV is very close to the energy of the iron fluorescent line at 6.4 keV. The simplistic ‘highecut’ model might hide the presence of the emission line in the source spectrum. Observed deviations of the measured spectrum from the model near this energy argue in favor of this possibility.
To investigate this issue, we added a Gaussian emission line to the ‘highecut’ model, fixing its energy to 6.4 keV and width to keV, allowing its normalization to be a free parameter. This resulted in an additional improvement of the fit to for 919 dof for a normalization of ph cm-2 s-1. The corresponding equivalent width of the line is eV ( error). We determined the significance of the line using the XSPEC script simftest with trials, and found that presumption against the null hypothesis, or no line required by the data is , which corresponds to line detection, assuming a normal distribution. The residuals of the ‘highecut’ model with the 6.4 keV iron line are shown in Fig. 6 (d). The model itself, together with spectral data points, is shown in Fig. 6 (a).
| Seq. | ModelaaThe xspec spectral model used. ‘CU’: wabs*cutoffpl, ‘HI’: wabs*powerlaw*highecut, ‘HI+Fe’: wabs(powerlaw*highecut+gau). | ConstbbConstant factor of the FPMB spectrum relative to FPMA. | Photon | Flux | (dof) | |||||
|---|---|---|---|---|---|---|---|---|---|---|
| Num. | index | [ keV ] | [ keV ] | FPMA | FPMB | |||||
| 1 | HI | 1.06 (458) | ||||||||
| 2 | HI | (frozen) | 0.92 (124) | |||||||
| 3 | HI | (frozen) | 0.81 (264) | |||||||
| 4 | CU | 1.07 (921) | ||||||||
| HI | 1.01 (920) | |||||||||
| HI+FeddThe corresponding 6.4 keV iron line parameters are: keV (fixed), normalization ph cm-2 s-1, and line equivalent width eV ( error). | 1.00 (919) | |||||||||
Considering the moderate spectral resolution of the NuSTAR observatory and the low significance of the detected iron line, we investigated the possibility of the presence of an iron fluorescence line in the XMM-Newton spectrum of 2RXP J130159.6-635806. As mentioned above, the X-ray pulsar 2RXP J130159.6-635806 was observed with XMM-Newton many times during programs studying PSR B1259-63. For our purposes, we chose the two observations with the longest exposures – ObsID 0092820301 (41.2 ksec) and ObsID 0504550601 (55.3 ksec). As for the NuSTAR observations, we modeled the spectra of 2RXP J130159.6-635806 including the Gaussian line at 6.4 keV. For both of the XMM-Newton observations, we did not find a significant improvement in the fits when the iron line was added and obtained a conservative upper limit () for the equivalent width of the iron line of 110 eV, which is consistent with the NuSTAR results.
Despite the fact that the first three NuSTAR observations were made at large offset angles, and the corresponding statistics are significantly lower than for the 4th observation, some useful spectral information can still be extracted. For these observations we used the same ‘highecut’ model. Due to low statistics and poor fit we fixed power-law slope in the 2nd and 3rd data set at value measured in the 4th observation. As seen from Table 3, where the best fit parameters are listed, the principal parameters – power-law slope (), cut-off energy (), and folding energy () – of the first three high-offset observations are in general agreement with 4th (on-axis) observation modeled with ‘highecut’.
The estimated keV flux of 2RXP J130159.6-635806 is about erg s-1 cm-2 during our observations, which is in agreement with the value of erg s-1 cm-2 measured by Chernyakova et al. (2005). An absence of strong transient activity from 2RXP J130159.6-635806 on long time scales is confirmed with the RXTE/ASM and Swift/BAT instruments. Note that Chernyakova et al. (2005) reported on a flaring episode, but the flux of the flare was relatively low raising by a factor of a few (up to erg s-1 cm-2).
Finally, in order to check for the possible presence of a cyclotron absorption line in the source spectrum, we modified the best-fit model (wabs*(powerlaw*highecut+gau)) by including an absorption feature in the form of a Lorentzian optical depth profile (cyclabs model in XSPEC; Mihara et al., 1990). The search procedure was performed following the prescription from Tsygankov & Lutovinov (2005). Namely, we varied the energy of the line over the range between 5 and 50 keV with 3-keV steps and the line width between 2 and 12 keV with 2-keV steps, leaving the line depth as a free parameter. We did not find strong evidence for a cyclotron line in the spectrum of 2RXP J130159.6-635806 (no trials gave a significance higher than ).
4.2 Pulse phase-resolved spectroscopy
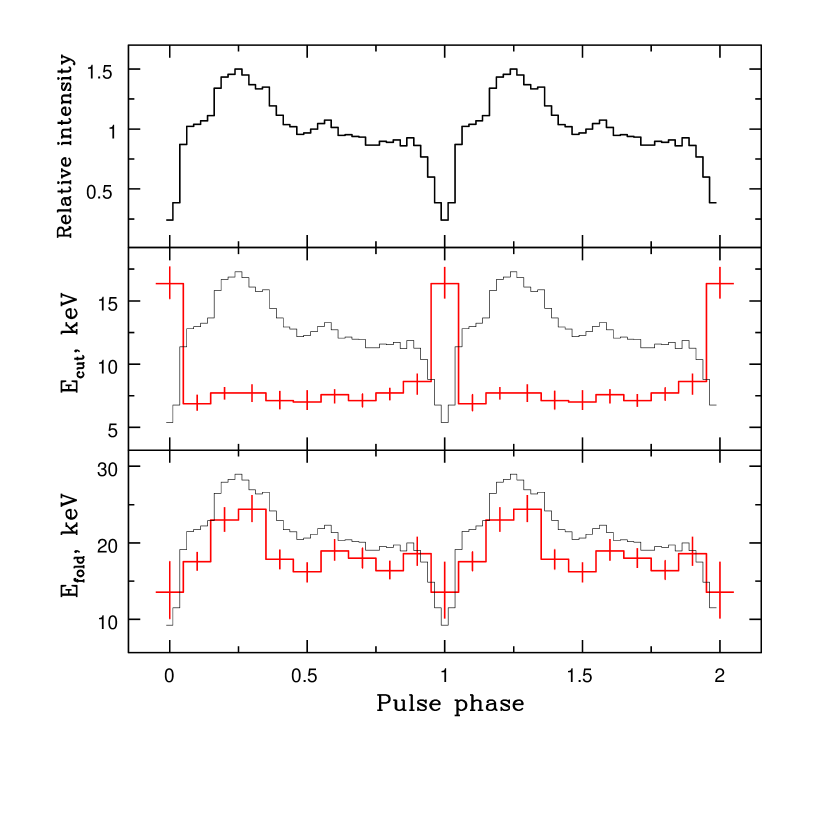
In order to study the evolution of the source spectrum over the pulse period, we performed pulse phase-resolved spectroscopy using the data from the 4th observation. The period was divided into 10 phase bins with zero phase coinciding with the main minimum in the pulse profile. According to the pulse phase-averaged spectral analysis, the fitting model was chosen in the form of (wabs*(powerlaw*highecut+gau)). However, due to much lower statistics, the photon index was fixed at the value from the averaged spectrum (). We selected this parameter due to its virtual constancy over the pulse in our preliminary analysis of the same data. The value is not very well constrained by the NuSTAR data; however we checked that it is consistent with being constant in phase, and we fixed it as well.
The results are shown in Fig. 7. The average pulse profile of 2RXP J130159.6-635806 across the entire NuSTAR energy range is presented in the upper panel. The lower panels demonstrate the behavior of the two free spectral parameters: the cut-off energy () and the folding energy (). The cut-off energy is quite stable over the pulse except at the pulse minimum where its value increases approximately by a factor of two. The folding energy demonstrates an apparent correlation with the pulse intensity, which is probably caused by increasing a spectral hardness around the pulse maximum. Such behaviour of the spectral parameters over the pulse can explain the corresponding behavior of the hardness ratios constructed from the pulse profiles in different energy bands, previously shown in Fig. 3. The keV hardness ratio demonstrates correlation with the pulse intensity and the keV ratio peaks at the pulse minimum right in place where shifts from to keV. Finally, it is necessary to note that the observed behavior of spectral parameters with the pulse phase can be caused by both physical and artificial reasons (in particular, due to limitations of available data, the adopted spectral model, and which model parameters were fixed). More data are required to confidently constrain all the spectral parameters and trace their behavior with the pulse phase.
5 Summary
We summarize the results of spectral and timing analysis of serendipitous and dedicated NuSTAR observations of the accreting X-ray pulsar 2RXP J130159.6-635806 in 2014 May-June.
-
•
The source demonstrates strong pulsations with a period of s. The pulsed fraction is measured to be constant with energy up to 40 keV.
-
•
The pulse profile is virtually independent of energy and can roughly be divided into one main peak at phases 0.0–0.5 and two smaller peaks at phases 0.5–0.75 and 0.75–1.0. The only feature that is changing with energy is the depth of the main minimum at phase 0.
-
•
The measured period shows a significant change over the day time span of the NuSTAR observations, which is consistent with a spin-up rate of Hz s-1. This rate is in remarkable agreement with measurements made by Chernyakova et al. (2005) almost a decade ago.
-
•
Together with the results of Chernyakova et al. (2005), the XMM-Newton data taken in 2007 and 2011, and the NuSTAR observations, we show a long-term spin-up trend of the source during the last 20 years. During the last 15 years, the source has undergone a strong and steady spin-up rate at the level of s s-1.
-
•
The power density spectrum of the source shows a clear break at 0.0066 Hz, which is higher than the period frequency of 0.0015 Hz. This fact, together with the steady persistent luminosity of the source, implies that the spin-up observed during the last 20 years is likely caused by a long-term mass accretion rate high enough to squeeze the magnetosphere inside the corotational radius, which makes 2RXP J130159.6-635806 unique among the other X-ray pulsars in binary systems with Be companions.
-
•
The phase-averaged spectrum of the source has a typical shape for accreting neutron stars in binary systems, in particular, for X-ray pulsars, and demonstrates an exponential cutoff at high energies. Our best-fit model contains an absorbed power-law with modified by a high-energy spectral drop with a cut-off energy of keV and a folding energy of keV. The spectrum also shows evidence for an iron 6.4 keV emission line, with an improvement in the fit when it is included.
- •
-
•
The phase-resolved spectroscopy shows some differences in source spectrum with phase. The cut-off energy is very stable over the pulse except at zero phase where its value increases by a factor of two. The apparent correlation of the folding energy with pulse intensity is attributed to the change in hardness of the source spectrum with orbital phase.
References
- An et al. (2014) An, H., Madsen, K. K., Westergaard, N. J., et al. 2014, Proc. SPIE, 9144, 91441Q
- Arnaud (1996) Arnaud, K. A. 1996, Astronomical Data Analysis Software and Systems V, 101, 17
- Bildsten et al. (1997) Bildsten, L., Chakrabarty, D., Chiu, J., et al. 1997, ApJS, 113, 367
- Bird et al. (2006) Bird, A. J., Barlow, E. J., Bassani, L., et al. 2006, ApJ, 636, 765
- Boldin, Tsygankov, & Lutovinov (2013) Boldin P. A., Tsygankov S. S., Lutovinov A. A., 2013, AstL, 39, 375
- Chernyakova et al. (2005) Chernyakova, M., Lutovinov, A., Rodríguez, J., & Revnivtsev, M. 2005, MNRAS, 364, 455
- Churazov et al. (2001) Churazov, E., Gilfanov, M., & Revnivtsev, M. 2001, MNRAS, 321, 759
- Coleiro et al. (2013) Coleiro A., Chaty S., Zurita Heras J. A., Rahoui F., Tomsick J. A., 2013, A&A, 560, AA108
- Dickey & Lockman (1990) Dickey, J. M., & Lockman, F. J. 1990, ARA&A, 28, 215
- Doroshenko et al. (2014) Doroshenko, V., Santangelo, A., Doroshenko, R., et al. 2014, A&A, 561, AA96
- Ghosh & Lamb (1979) Ghosh, P., & Lamb, F. K. 1979, ApJ, 234, 296
- González-Galán et al. (2012) González-Galán, A., Kuulkers, E., Kretschmar, P., et al. 2012, A&A, 537, AA66
- Haberl et al. (1998) Haberl, F., Angelini, L., Motch, C., & White, N. E. 1998, A&A, 330, 189
- Harrison et al. (2013) Harrison, F. A., Craig, W. W., Christensen, F. E., et al. 2013, ApJ, 770, 103
- Hoshino & Takeshima (1993) Hoshino, M., & Takeshima, T. 1993, ApJ, 411, L79
- Jansen et al. (2001) Jansen, F., Lumb, D., Altieri, B., et al. 2001, A&A, 365, L1
- Klus et al. (2014) Klus, H., Ho, W. C. G., Coe, M. J., Corbet, R. H. D., & Townsend, L. J. 2014, MNRAS, 437, 3863
- Krivonos et al. (2014) Krivonos, R. A., Tomsick, J. A., Bauer, F. E., et al. 2014, ApJ, 781, 107
- Leahy et al. (1983) Leahy D. A., Darbro W., Elsner R. F., Weisskopf M. C., Kahn S., Sutherland P. G., Grindlay J. E., 1983, ApJ, 266, 160
- Lutovinov & Tsygankov (2009) Lutovinov A.A., Tsygankov S.S., 2009, Astron. Lett., 35, 433
- Lutovinov et al. (2012) Lutovinov, A., Tsygankov, S., & Chernyakova, M. 2012, MNRAS, 423, 1978
- Lyubarskii (1997) Lyubarskii, Y. E. 1997, MNRAS, 292, 679
- Masetti et al. (2006) Masetti, N., Pretorius, M. L., Palazzi, E., et al. 2006, A&A, 449, 1139
- Mihara et al. (1990) Mihara T., Makishima K., Ohashi T., Sakao T., Tashiro M., 1990, Natur, 346, 250
- Postnov et al. (2015) Postnov, K. A., Mironov, A. I., Lutovinov, A. A., et al. 2015, MNRAS, 446, 1013
- Reig & Roche (1999) Reig P., Roche P., 1999, MNRAS, 306, 100
- Reig (2011) Reig, P. 2011, Ap&SS, 332, 1
- Revnivtsev et al. (2006) Revnivtsev, M. G., Sazonov, S. Y., Molkov, S. V., et al. 2006, Astronomy Letters, 32, 145
- Revnivtsev et al. (2009) Revnivtsev, M., Churazov, E., Postnov, K., & Tsygankov, S. 2009, A&A, 507, 1211
- Tsygankov & Lutovinov (2005) Tsygankov S. S., Lutovinov A. A., 2005, AstL, 31, 88
- Tsygankov, Krivonos, & Lutovinov (2012) Tsygankov S. S., Krivonos R. A., Lutovinov A. A., 2012, MNRAS, 421, 2407
- Verner et al. (1996) Verner, D. A., Ferland, G. J., Korista, K. T., & Yakovlev, D. G. 1996, ApJ, 465, 487
- White et al. (1983) White N., Swank J., Holt S., 1983, ApJ, 270, 771
- Wilms et al. (2000) Wilms, J., Allen, A., & McCray, R. 2000, ApJ, 542, 914