Discovery of a wandering radio jet base after a large X-ray flare in the blazar Markarian 421
Abstract
We investigate the location of the radio jet bases (“radio cores”) of blazars in radio images, and their stationarity by means of dense very long baseline interferometry (VLBI) observations. In order to measure the position of a radio core, we conducted 12 epoch astrometric observation of the blazar Markarian 421 with the VLBI Exploration of Radio Astrometry at 22 GHz immediately after a large X-ray flare, which occurred in the middle of 2011 September. For the first time, we find that the radio core is not stationary but rather changes its location toward 0.5 mas downstream. This angular scale corresponds to the de-projected length of a scale of Schwarzschild radii () at the distance of Markarian 421. This radio-core wandering may be a new type of manifestation associated with the phenomena of large X-ray flares.
Subject headings:
galaxies: active — galaxies: jets — BL Lacertae objects: individual (Markarian 421) — astrometry1. Introduction
Blazars are extremely bright active galactic nuclei (AGNs) with variable jets. Blazar jets are thought to be powered by the accretion of surrounding material onto super-massive black holes (“central engines”). The radio jet bases (“radio cores”) located in the upstream ends of AGN jets in radio images have been basically considered to be opaque photospheres (surfaces of an optical depth of ) against synchrotron self-absorption (SSA) or free-free absorption. Frequency-dependent offsets of the radio core position detected by very long baseline interferometry (VLBI) observations support this characteristic structure (e.g., Marcaide & Shapiro, 1983; Hada et al., 2011). On the other hand, the stationary standing shock model, which is also another idea explaining blazar radio cores has been proposed based on recent VLBI observations (e.g., Marscher et al., 2008). Although detailed radio observations can provide the morphological structure of an inner jet, their stationarity is less well understood in addition to the location of the radio core still being a matter of debate (e.g., Marscher et al., 2008; Hada et al., 2011). Long-period VLBI astrometry at low frequency has not only derived the stationarity of radio cores with an astrometric accuracy (e.g., Bartel et al., 1986; Guirado et al., 1995; Fey et al., 1997) but also caught the sign of their wandering behavior (Ros et al., 1999; Martí-Vidal et al., 2011). In particular, the stationarity of blazars related to high-energy activity has not yet been verified by observations within a limited period after the flaring phenomena.
The high-synchrotron-peaked BL Lac object Markarian 421, at redshift , is known as the first bright -ray blazar in the TeV energy range to be reported by the Whipple ground-based Cherenkov telescope (Punch et al., 1992). This blazar harbors a solar mass black hole (Wagner, 2008). Niinuma et al. (2012) have reported on superluminal apparent inward motion of the jet component relative to the radio core, which has steep spectra at more than 10 GHz (Lico et al., 2012; Blasi et al., 2013), using the Japanese VLBI network (JVN) soon after the largest X-ray flare occurred in 2010. It is clear that inward motions along outflowing jets are not realistic, but these apparent motions can be explained if the position of the radio core changes (Kellermann et al., 2004).
To clarify the origin of such inward motions, we performed 12 epochs of astrometric observations of the large X-ray flare of Markarian 421 in 2011 September (Hiroi et al., 2011) using the VLBI Exploration of Radio Astrometry (VERA) at 22 GHz together with a nearby reference source J1101+3904 (see Fig. 1). Throughout this paper, we adopt cosmological parameters of , (Komatsu et al., 2011). Based on these parameters, 1 mas at corresponds to a linear scale of 0.62 pc.
2. Astrometric observation and data analysis
2.1. VERA observations
We conducted 12 epochs of phase-referencing observations at 22GHz between 2011 September 16 and 2012 April 28 with typical interval of 20days after the aforementioned large X-ray flare. Observations were conducted using VERA (baselines ranging between 1000 and 2300 km). VERA was designed for dedicated astrometric observations by installing a dual beam system (beams A, B) and is operated by the National Astronomical Observatory of Japan.
To measure the absolute position of Markarian 421, we selected J1101+3904, which is listed in the VLBA calibrator survey list111http://www.vlba.nrao.edu/astro/calib/vlbaCalib.txt, as a position reference.
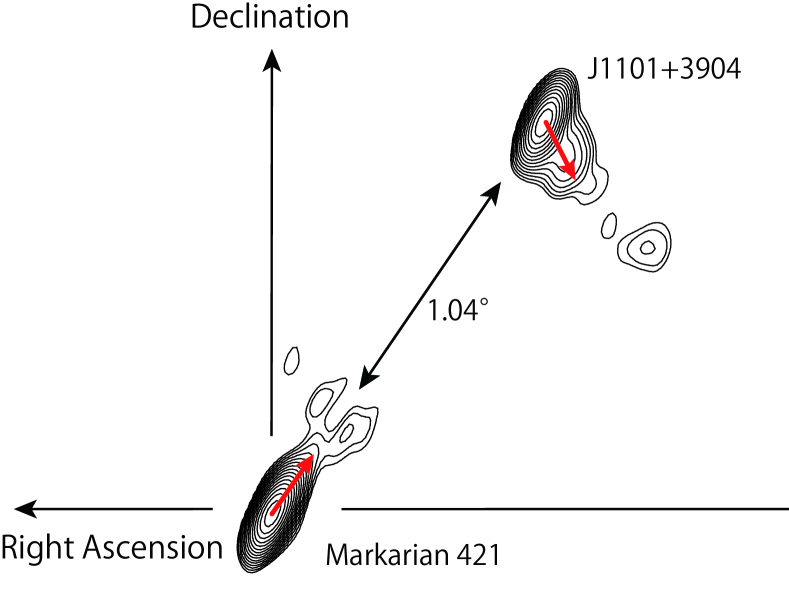
In Fig. 1, we represent the configuration of both sources on the celestial sphere. To clearly display the source morphologies and jet orientations of Markarian 421 and J1101+3904, we show 8 GHz VLBI images of both sources observed by the Very Long Baseline Array (VLBA)222http://astrogeo.org/images/. The position angle (P.A.) measured from north to west of the jet of J1101+3904 is 153°and that of Markarian 421 is 35°on average, respectively. These jet orientations were derived from VERA images and are indicated with red arrows in Fig. 1. Therefore, the two jet axes are nearly perpendicular (118°). In addition, the separation angle between two sources on the celestial sphere is only 1°.04. The orthogonality and the closeness of two sources are crucial to avoid any degeneracy in the structural effects in the jet direction and to reduce the astrometric errors caused by the tropospheric delay residuals. Therefore, the selection of this pair of jets allows us to measure the absolute position of Markarian 421 with respect to J1101+3904 with high astrometric accuracy.
Our VERA observations were performed with a recording rate of 1024Mbps (2-bit quantization 16 MHz 16 intermediate frequency (IF) channels ). Eight IF channels were assigned to Markarian 421 (beam A), and the others were assigned to J1101+3904 (beam B). The instrumental phase difference between the two beams was monitored in real time during the observations by injecting artificial noise sources into both beams at each station (Honma et al., 2008a).
2.2. Data analysis
The visibility calibration was performed using the NRAO Astronomical Image Processing System (AIPS) software package. To increase astrometric precision, we recalculated the delays of all sources using a precise geodetic model and calibrated the instrumental phase difference between the dual beam systems. This precise recalculation of the delay also included the most recent Earth rotation parameters provided by the International Earth Rotation and Reference System Service (IERS) and the tropospheric delays measured using global positioning system receivers at each VERA station (Honma et al., 2008b). Ionospheric delays were considered based on a global ionosphere map, which was produced every 2hr by the University of Bern.
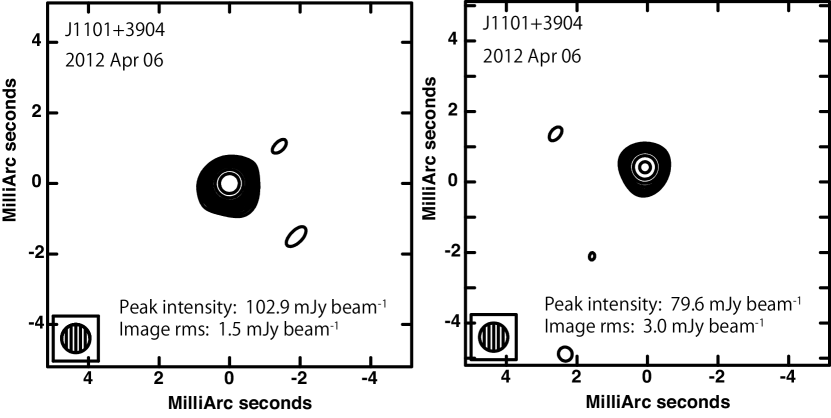
We performed fringe-fitting on both Markarian 421 and J1101+3904 independently using the AIPS task FRING and removed the residual delays, rates, and phases assuming a point-source model. Then VLBI images of Markarian 421 and J1101+3904 (Fig. 2 left) were produced via a standard CLEAN and self-calibration procedure using the Caltech Difmap package (Shepherd, 1997).
To obtain the core position of Markarian 421, we performed a phase-referencing analysis in the following manner. First, we chose Markarian 421 as the phase calibrator because this source is much brighter than J1101+3904. After the a priori corrections of the visibility amplitude, the solutions for residual delays, rates, and phases obtained on Markarian 421 (under the point-source assumption) were transferred to the data set of J1101+3904. Then, to account for the source structure phase of Markarian 421, we ran the AIPS task CALIB on Markarian 421 with the source model derived from the self-calibrated image, and the solution was also transferred to J1101+3904 for accurate determination of the absolute position of the radio core. Based on these procedures, we finally obtained phase-referenced images of J1101+3904 (Fig. 2 right), which displayed the relative position of J1101+3904 with respect to Markarian 421. In the astrometry result, we present the relative position of Markarian 421 with respect to J1101+3904.
To determine the jet orientation of both sources utilized through this paper, we fitted two-dimensional circular Gaussian models to these self-calibrated visibilities. The jet orientation of Markarian 421 derived from the VERA observations is consistent with that reported by previous VLBA observation (Lico et al., 2012). The P.A. of the innermost jet in J1101+3904 (0.8 mas from the core) derived from VLBA 8 GHz data (see Fig. 1) is approximately 150°, which is also quite consistent with VERA observations.
The astrometric accuracy in each observing epoch represented in Fig. 3-(b) and 4 is 0.08–0.12 mas. To estimate these values, we calculated (1) the statistical astrometric error derived from the signal-to-noise ratio of the phase-referenced image of J1101+3904, (2) the dispersive ionospheric residuals, (3) the non-dispersive tropospheric residuals, and (4) the identification of the core position by following the way described in Hada et al. (2011).
3. Detection of the position wandering of the radio jet base
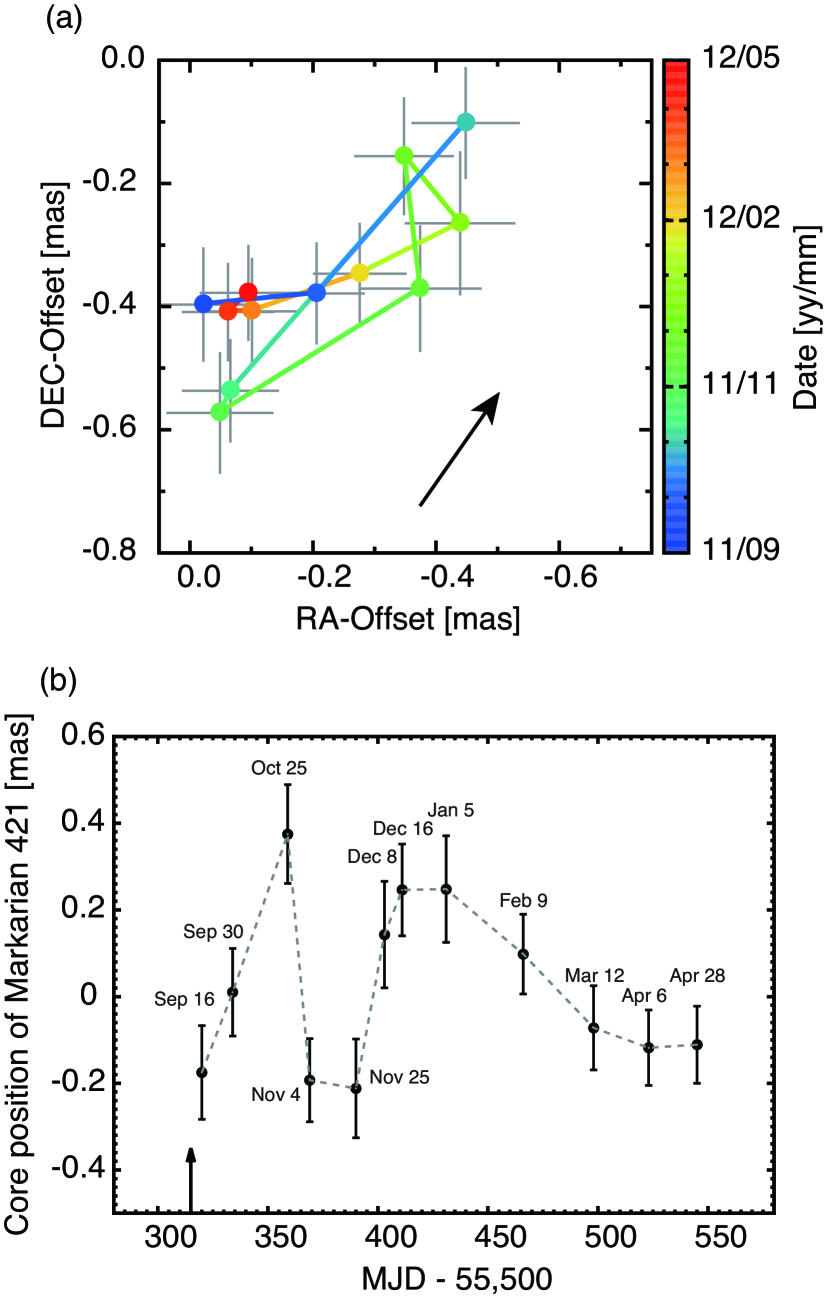
We discovered a core-position wandering in Markarian 421 based on bonafide astrometric observations (Fig. 3). This is the first direct detection of such a clear position change of the radio core within a year at higher frequency ( GHz). We show the position of the Markarian 421 radio core in the celestial coordinates in Fig. 3-(a). The core clearly shows its position change in the northwest direction, which is a similar direction to the Markarian 421 jet axis. In Fig. 3-(b), we present the measured core positions of Markarian 421 projected to the P.A. of 63°, which is a direction perpendicular to the J1101+3904 jet axis, because the structural effect of J1101+3904 is negligible in the motion along this direction. The position of the radio core began to change significantly days after the peak of the X-ray flare. The radio core, which is located at mas on 2011 September 16 (modified Julian date (MJD) 55820) in Fig. 3-(b), moved in the positive direction to mas by 2011 October 25 (MJD 55859). The core position changed by 0.51 mas within 39days, which corresponds to an apparent velocity of . After the core returned to near the initial position on MJD 55890, a core-position change of nearly the same magnitude, 0.49 mas, was detected again within the 41 days between MJD 55890 and MJD 55931. The radio core then gradually returned once more to its initial position by approximately MJD 56000. We stress that the amount of core-position wandering is significantly larger than our astrometric accuracy of .
For quantitative evaluation of the significance of the radio core wandering during all the observing epochs, we examine the chi-square test for the position change represented in Fig. 3-(b). In this test, we define two cases of null hypothesis as follows: the position of the radio core shows the stationarity for 1) the weighted mean position of the radio core during all the observing epochs and 2) the weighted mean position of the radio core during last three epochs in which it seems to be stationary. In both cases, the stationarity of the radio core is rejected at a significance level of as shown in Table 1. The radio core, hence, exhibits its position change during observing epochs at a confidence level of .
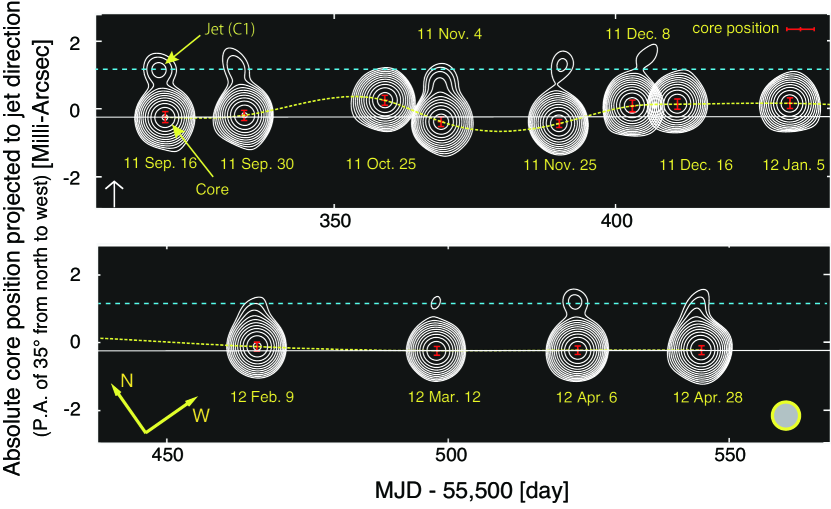
In Fig. 4, we present the absolute core positions along the jet axis of Markarian 421, and radio images are overlaid on each corresponding epoch. In this figure, the presence of a single jet component (hereafter, we call it ‘C1’) located at approximately 1.3 mas northwest from the core can be confirmed and is also well known as its stationarity (Lico et al., 2012). C1 is much fainter than the radio core as represented in Fig. 4. In three out of twelve epochs (namely 2011 October 25, 2011 December 16, and 2012 January 05), the radio core significantly moves downstream (in the northwest direction) of the jet, and the separations between the bright core and C1 become too close to resolve these two components with VERA’s synthesized beam. Hence, C1 was not seen in these three epochs. Thus, the 12 epoch sequence of the radio images suggests the core position wandering phenomenon discovered by our astrometric observations.
Moreover, if a displacement of the brightness centroid between the stationary core and a newborn jet causes the core wandering phenomenon, an elongated or double-peaked radio core image around the reference stationary position (the white line), which should be expected in the epochs where the core clearly moves downstream of the jet in Fig. 4 (e.g., radio images with a beam size of 0.1 mas in Marscher et al., 2010). However, such signatures were not observed in the radio-core images. Therefore, the wandering behavior of the radio core discovered in the present study clearly differs from the observational feature of the radio core in, e.g., BL Lacertae, in which the radio core is indicated to be stationary (Marscher et al., 2008).
| Parameters | Case (1) | Case (2) |
|---|---|---|
4. Discussion
The de-projected distance that corresponds to the core-position changes of Markarian 421 is approximately (equivalent to Schwarzschild radii ()) for a jet-viewing angle of °(Lico et al., 2012). One of the leading models for explaining the blazar phenomenon is the so-called internal-shock model, in which discrete ejecta with higher speeds catch up with the preceding slower ejecta, and the collision leads to a shock wave in the colliding ejecta (Spada et al., 2001; Guetta et al., 2004). Based on this model, core wandering can be naturally explained because the model predicts some scattering of the shock locations caused by the randomness of the ejecta speed. Therefore, we assume that the distances of the shock locations from the black hole immediately after the flare, , are proportional to the product of the square of the bulk Lorentz factor () of the ejecta and the separation length () of the colliding ejecta. Assuming that a typical separation length is a scale of about 10 times the innermost stable circular orbit for non-rotating black holes (), in light of numerical simulations of relativistic outflows around black holes (McKinney et al., 2013), very fast ejecta with a Lorentz factor of approximately are required to explain the observed magnitude of the core wandering. The is comparable to previously reported maximum values ( of ; Lister et al., 2009, 2013) based on statistical studies by a long-term monitor using VLBI. Moreover, the radio core returned to the reference stationary position after 2012 March 12 (the 10th epoch). This can be explained if the emission from the reference position is identical to the radio core that is in a quiescent state. The radio-core emission in a quiescent state is expected to be persistent. As one of the possibilities for reproducing the observed core wandering, this persistent radio core was obscured by the flare-associated radio core, which therefore must be optically thick against SSA and short lived (a lifetime of approximately 2 weeks), for several epochs. Such a flare-associated radio core must be located at least downstream from the persistent radio core. In addition, Koyama et al. (2015) recently conducted multi-epoch astrometric observations of Markarian 501, which is also one of the most nearby TeV blazars by using VERA. However, they detected no significant positional changes of the radio core during its quiescent state. This fact, therefore, seems to support the radio core wandering seen after the large X-ray flare.
Another possible scenario, which may lead to the radio-core wandering is the presence of changes in the electron density and magnetic field strength in the jet flow. Such changes might be triggered when magnetohydrodynamic waves propagate in the jet (Rees, 1971; Cohen et al., 2014) with an apparent wave-pattern speed of approximately . The propagation of electromagnetic waves in a charge-starved jet proposed by Kirk & Mochol (2011) might also be generated at the launching point of the jet, although an assumption of charge starvation may not be warranted because of the high number density of low-energy electrons (Kino & Takahara, 2008). In addition, Gómez et al. (1997) have predicted that the interaction between the steady standing shock and a propagating perturbation that contains shocked regions and is trailed by a rarefaction along the jet causes a positional shift of the brightness centroid with a superluminal speed comparable to the one reported in this Letter.
Regardless of the core-wandering mechanism, it is evident that our new observational finding offers crucial hints to resolving a key jet origin question (i.e., particle versus electromagnetic power) in the innermost region of the TeV blazar Markarian 421. In addition, recent radio and optical observations have suggested that monitoring the behavior of polarized emission on a short timescale is also a promising way to understand the origin of the jet activity in the innermost region of blazars (Lico et al., 2014; Itoh et al., 2015).
Thus far, as one of the few examples, multi-epoch astrometric observations have been performed for the FR-I-type radio galaxy M87 (Acciari et al., 2009; Hada et al., 2014). Acciari et al. (2009) noted that the position of the M87 radio core at 43GHz moved by no more than during the flare that occurred in 2008, while Hada et al. (2014) similarly showed a stable (less than ) nature for the 43GHz core position during the flare in 2012. By contrast, we report here the detection of a large change in the position of a radio core. The de-projected distance corresponding to the core-position changes of Markarian 421, (, is approximately ten thousand times larger than the upper limit in the case of M87. According to the AGN unified model (Urry & Padovani, 1995), both the blazar Markarian 421 and the radio galaxy M87 are classified as FR-I-type galaxies, and their jet power is approximately of W (Rieger & Aharonian, 2012; Potter & Cotter, 2013). Therefore, the difference is most likely related to the jet-viewing angle and the optical depth structure rather than the jet power. The results reported by Piner et al. (2010) and Hada et al. (2013) imply that the jet has a transverse structure composed of an inner fast spine flow and a surrounding slow layer (Ghisellini et al., 2005). On the basis of this model, observers see the radio core in the blazar, which is dominated by the fast spine flow because the jet is closely aligned with our line of sight. In contrast, the radio galaxy has a jet off-axis whose emission comes from the slow layer and not from inner spine flow. A structured jet is a possible model for explaining the observational discrepancy in the behavior of the radio cores between Markarian 421 and M87.
5. Summary
We conclude that the radio core-wandering phenomenon implies that the blazar emission zone in Markarian 421 is occasionally located at least downstream from the black hole just after the large X-ray flare. To wrap up, the location of the radio core in Markarian 421 is far from the black hole, as also suggested in other blazars but without performing astrometric observations (e.g., Marscher et al., 2008, 2010; Abdo et al., 2010; Orienti et al., 2013), while the radio core is not stationary after the large X-ray flare. In addition, our result on the location of the radio core is consistent with the one in the case of CTA 102, which was classified as a flat spectrum radio quasar measured by the image alignment method (Fromm et al., 2015, and references therein). This radio core wandering was discovered just after the large X-ray flare phenomenon using dense VLBI astrometric observations. Thus there is a possibility that the wandering behavior may be a new type of manifestation associated with the phenomena of large X-ray flares.
References
- Abdo et al. (2010) Abdo, A. A. et al., 2010, Nature, 463, 919
- Acciari et al. (2009) Acciari, V. A. et al., 2009, Science, 325, 444.
- Bartel et al. (1986) Bartel, N., Herring, T. A., Ratner, M. I., Shapiro, I. I., & Corey, B. E. 1986, Nature, 319, 733
- Blasi et al. (2013) Blasi, M. G., et al., 2013, A&A, 559, 75
- Cohen et al. (2014) Cohen, M. H., et al., 2014, ApJ, 787, 151
- Croke & Gabuzda (2008) Croke, S. M., & Gabuzda, D. C. 2008, MNRAS, 386, 619
- Fey et al. (1997) Fey, A. L., Eubanks, M., & Kingham, K. A. 1997, AJ, 114, 2284
- Fromm et al. (2015) Fromm, C. M., Perucho, M., Ros, E., Savolainen, T., & Zensus, J. A. 2015, A&A, 576, A43
- Ghisellini et al. (2005) Ghisellini, G., Tavecchio, F. & Chiaberge, M., 2005, A&A, 432, 401
- Gómez et al. (1997) Gómez, J. L., Martí, J. M., Marscher, A. P., Ibáñez, J. M., & Alberdi, A. 1997, ApJ, 482, L33
- Guetta et al. (2004) Guetta, D., Ghisellini, G., Lazzati, D. & Celotti, A., 2004, A&A, 421, 877
- Guirado et al. (1995) Guirado, J. C., Marcaide, J. M., Alberdi, A., et al. 1995, AJ, 110, 2586
- Hada et al. (2011) Hada, K., et al., 2011, Nature, 477, 185
- Hada et al. (2013) Hada, K., et al., 2013, ApJ, 775, 70
- Hada et al. (2014) Hada, K., Giroletti, M., Kino, M., et al. 2014, ApJ, 788, 165
- Hiroi et al. (2011) Hiroi, K. et al., 2011, Astron. Telegr., 3637, 1
- Honma et al. (2008a) Honma, M., Kijima, M., Suda, H., et al. 2008, PASJ, 60, 935
- Honma et al. (2008b) Honma, M., Tamura, Y., & Reid, M. J. 2008, PASJ, 60, 951
- Itoh et al. (2015) Itoh, R., Fukazawa, Y., Tanaka, Y. T., et al. 2015, arXiv:1502.06174
- Kellermann et al. (2004) Kellermann, K. I. et al., 2004, ApJ, 609, 539
- Kino & Takahara (2008) Kino, M. & Takahara, F., 2008, MNRAS, 383, 713
- Kirk & Mochol (2011) Kirk, J. G. & Mochol, I., 2011, ApJ, 729, 104
- Komatsu et al. (2011) Komatsu, E., et al., 2011, ApJS, 192, 18
- Koyama et al. (2015) Koyama, S., Kino, M., Doi, A., et al. 2015, arXiv:1501.03498
- Lico et al. (2012) Lico, R., et al., 2012, A&A, 545, A117
- Lico et al. (2014) Lico, R., Giroletti, M., Orienti, M., et al. 2014, A&A, 571, AA54
- Lister et al. (2009) Lister, M. L., et al., 2009, AJ, 138, 1874
- Lister et al. (2013) Lister, M. L., et al., 2013, AJ, 146, 120
- Marcaide & Shapiro (1983) Marcaide, J. M., & Shapiro, I. I. 1983, AJ, 88, 1133
- Marscher et al. (2008) Marscher, A. P., et al., 2008, Nature, 452, 966
- Marscher et al. (2010) Marscher, A. P., et al., 2010, ApJ, 710, L126
- Martí-Vidal et al. (2011) Martí-Vidal, I., Marcaide, J. M., Alberdi, A., et al. 2011, A&A, 533, A111
- McKinney et al. (2013) McKinney, J. C., Tchekhovskoy, A. & Blandford, R. D., 2013, Science, 339, 49
- Niinuma et al. (2012) Niinuma, K., et al., 2012, ApJ, 759, 84
- Orienti et al. (2013) Orienti, M., et al., 2013, MNRAS, 428, 2418
- Piner et al. (2010) Piner, B. G., Pant, N. & Edwards, P. G., 2010, ApJ, 723, 1150
- Potter & Cotter (2013) Potter, W. J. & Cotter, G., 2013, MNRAS, 436, 304
- Punch et al. (1992) Punch, M., et al., 1992, Nature, 358, 477
- Rees (1971) Rees, M. J., 1971, Nature, 229, 312
- Rieger & Aharonian (2012) Rieger, F. M. & Aharonian, F., 2012, Mod. Phys. Lett. A, 27, 30030
- Ros et al. (1999) Ros, E., Marcaide, J. M., Guirado, J. C., et al. 1999, A&A, 348, 381
- Shepherd (1997) Shepherd, M. C. 1997, Astronomical Data Analysis Software and Systems VI, 125, 77
- Spada et al. (2001) Spada, M., Ghisellini, G., Lazzati, D. & Celotti, A., 2001, MNRAS, 325, 1559.
- Urry & Padovani (1995) Urry, C. M. & Padovani, P., 1995, PASP, 107, 803 (1995).
- Wagner (2008) Wagner, R. M., 2008, MNRAS, 385, 119