CGRO/BATSE Data Support the New Paradigm for GRB Prompt Emission and the New L–E relation
Abstract
The paradigm for the Gamma Ray Burst (GRB) prompt emission is changing. Since early in the Compton Gamma Ray Observatory (CGRO) era, the empirical Band function has been considered a good description of the keV-MeV -ray prompt emission spectra despite the fact that its shape was very often inconsistent with the theoretical predictions especially these expected in the pure synchrotron emission scenarios. We have recently established a new observational model analyzing data of the NASA Fermi Gamma-ray Space Telescope. In this model, GRB prompt emission would be a combination of three main emission components: (i) a thermal-like component that we interpreted so far as emission from the jet photosphere, (ii) a non-thermal component that we interpreted so far as synchrotron radiation from the propagating and accelerated charged particles within the jet, and (iii) an additional non-thermal (cutoff) power-law extending from low to high energies in -rays and most likely of inverse Compton origin. In this article we reanalyze some of the bright GRBs observed with the Burst And Transient Source Experiment (BATSE) on-board CGRO with the new model, namely GRBs 941017, 970111 and 990123. We conclude that BATSE data are fully consistent with the recent results obtained with Fermi: some bright BATSE GRBs exhibit three separate components during the prompt phase with similar spectral parameters as these reported from Fermi data. In addition, the analysis of the BATSE GRBs with the new prompt emission model results in a relation between the time-resolved energy flux of the non-thermal component, F, and its corresponding Fν spectral peak energy, E (i.e., F–E) that has a similar index—when fitted to a power law—as the one initially derived from Fermi data. For GRBs with known redshift (z) this results in a possible universal relation between the luminosity of the non-thermal component, L, and its corresponding Fν spectral peak energy in the rest frame, E (i.e., L–E). We estimated the redshifts of GRBs 941017 and 970111 using GRB 990123—with z=1.61—as a reference. The estimated redshift for GRB 941017 is typical for long GRBs and the estimated redshift for GRB 970111 is right in the range of the expected values for this burst.
Subject headings:
Gamma-ray bursts – Radiation mechanisms: thermal – Radiation mechanisms: non-thermal – Acceleration of particles1. Introduction
During the past years, a new paradigm has emerged for Gamma Ray Burst (GRB) prompt emission111See Pe’er (2015) for a recent review on GRB prompt emission. in which multiple component models seem to be favored compared to single component ones (see for instance Guiriec et al., 2015a). Until recently, the empirical Band function—a smoothly broken power law (PL) described with four free parameters: and for the indices of the low and high energy PLs, respectively, for the Fν spectral peak energy (Gehrels, 1997), and an amplitude parameter (Band et al., 1993; Greiner et al., 1995)—was considered as an adequate description of the keV–MeV -ray prompt emission spectra. However, an additional PL was required in a few cases to account for spectral deviations at high energies (González et al., 2003, 2012; Guiriec et al., 2010, 2015a; Abdo et al., 2009b; Ackermann et al., 2010, 2011). Moreover, despite their compatibility with non-thermal processes, the values of were usually too high to be consistent with the predictions from the pure synchrotron emission scenarios from electrons in the slow and fast cooling regimes that require index values -2/3 and -3/2, respectively (Cohen et al., 1997; Crider et al., 1997; Preece et al., 1998; Ghisellini et al., 2000), as expected in the framework of the popular fireball model (Cavallo & Rees, 1978; Paczynski, 1986; Goodman, 1986; Shemi & Piran, 1990; Rees & Mészáros, 1992, 1994; Mészáros & Rees, 1993).
The recent discovery of a thermal-like component, CTh, together with a non-thermal one, CnTh, in the prompt emission of both long (Guiriec et al., 2011a, 2015a, 2015c; Axelsson et al., 2012) and short (Guiriec et al., 2013) GRBs observed with the Fermi Gamma-ray Space Telescope (hereafter, Fermi), challenges the well established Band function paradigm. The CTh spectral shape is usually compatible with a Planck function—based on the quality of the Fermi data. Although a broader spectral shape more compatible with the GRB jet photospheric models was recently reported in Guiriec et al. (2015c) who analyzed the spectra of GRB 131014A and showed that it exhibited an intense CTh component. Indeed, while a pure Planck function is well approximated with a cutoff PL (CPL) with an index =+1, the thermal-like component of GRB 131014A is best described with a CPL with an index +0.6. The CnTh spectral shape is adequately described with a Band function but with spectral parameters usually very different from those resulting from fits to a Band function alone. For instance, is systematically lower than and, therefore, more compatible with the synchrotron emission scenarios, is -3 and compatible with an exponential cutoff (i.e., the Band function can be replace with a CPL with no change in the fit statistics), and is systematically shifted to higher values compared to (Guiriec et al., 2011a, 2013, 2015a, 2015c). In the case of short GRB 120323A, in fits to CnTh+CTh the indices drop from positive values—in fits to a Band function alone—down to values low enough to be compatible with the pure fast-cooling synchrotron scenario (i.e., -1.2)(Guiriec et al., 2013). Conversely to the genuine fireball model, which predicts a thermal-like component from the jet photosphere that overpowers the non-thermal one (Zhang & Pe’er, 2009), the observed CTh is usually energetically subdominant compared to CnTh as predicted by Daigne & Mochkovitch (2002), Nakar et al. (2005), Zhang & Pe’er (2009) and Hascoët et al. (2013) in the case of highly magnetized outflows. The diversity of CTh relative contribution to the total energy from burst to burst indicates that the magnetization parameter can vary over a large range of values (Guiriec et al., 2011a, 2013, 2015a, 2015c). Although we interpreted CnTh as synchrotron emission, it is also possible that this component corresponds to a comptonized photosphere (Pe’er, 2008; Beloborodov, 2010; Beloborodov et al., 2014; Vurm & Beloborodov, 2014).
Guiriec (2011b); Guiriec et al. (2013, 2015a) went a step further by identifying simultaneously the three known components—namely CnTh, CTh and the additional (cutoff) PL (i.e., CnTh+CTh+(C)PL)—in the prompt emission of some bright Fermi GRBs. This completely changed the view we had of GRB 080916C considered before as adequately fitted to a single Band function from 8 keV up to GeVs (Abdo et al., 2009a). While the spectral and temporal behaviors of GRBs 080916C and 090926A were very different when fitted to a Band function alone for the former (Abdo et al., 2009a) and to a combination of a Band function and a additional CPL for the latter (Ackermann et al., 2011), the two GRBs are like “twins” in the context of the CnTh+CTh+(C)PL model. We note here, however, that the three components of the CnTh+CTh+(C)PL model are not systematically present or detectable in all GRBs.
Guiriec et al. (2013, 2015a, 2015c) reported a strong correlation between the time-resolved energy flux of CnTh, F, and its corresponding Fν spectral peak energy, E intrinsic to each burst (hereafter, F–E relation where “i” counts time intervals). Interestingly, the F–E relations for all GRBs are adequately described by PLs with very similar index values indicating a possible common physical process in jets of both short and long GRBs to explain the CnTh component. Moreover, when accounting for the redshift and the K-correction, a strong correlation appears between the time-resolved luminosity of CnTh, L, and its corresponding Fν spectral peak energy in the GRB central engine rest frame, E (hereafter, L–E relation); this relation is not only intrinsic to each GRB but it is also common to all GRBs and points, therefore, towards a possible universal physical mechanism intrinsic to all GRB jets, which may eventually be used, for instance, (i) to measure the distance of GRBs using solely their -ray prompt emission and (ii) to constrain the cosmological parameters complementary to the type IA supernova sample.
While all the parameters of the Band function are highly variable—within each burst and from burst to burst—when a Band function alone is fitted to -ray prompt emission data, , , and the index of the additional (C)PL, , do not vary much with time or from burst to burst when fitting either CnTh+CTh or CnTh+CTh+(C)PL to the data (Guiriec et al., 2013, 2015a). Indeed, indices have values that are either -0.7 or -1.2 depending on the burst (Guiriec et al., 2013, 2015a, 2015c), index values are usually -3.5 and compatible with exponential cutoffs in many cases, indices are usually +0.6, and values are usually -1.5. Therefore, by freezing some parameters of the CnTh+CTh and CnTh+CTh+(C)PL models to their typical values, we reduce the number of free parameters to 4 and 5, respectively, without degrading significantly the fit quality, and the new models become statistically competitive with the Band function in terms of free parameters. Moreover, thanks to the F–E and L–E relations it is possible to reduce again the number of free parameters to 3 and 4 for CnTh+CTh and CnTh+CTh+(C)PL, respectively.
In this article we reanalyzed three famous bright long GRBs (namely, GRBs 941017, 970111 and 990123) observed with the Burst And Transient Source Experiment (BATSE) on-board the Compton Gamma Ray Observatory (CGRO)—that was operating in low Earth orbit from 1991 to 2000—in the context of the new paradigm to verify its consistency with these archival data. In Sections 2 and 3 we discuss the data selection criteria and our analysis methodology. Finally in Section 4 we present our results. We will see how the view we had of those GRBs—that attracted a lot of attention in the scientific community—may be completely refreshed in the framework of the new model.
2. Data Selection
We focus this first article of a series on a limited sample of three famous bright long GRBs detected with BATSE. These GRBs are of particular interest because they have often been and still are cited to support or discard theoretical interpretations for GRB prompt emission.
GRB 990123 was the first GRB to be simultaneously detected during its prompt phase in the -ray and optical bands (-ray reference here, Akerlof et al., 1999). The prompt emission spectra of this burst in the keV-MeV energy range was considered as adequately fitted to a single Band function (Briggs et al., 1999). A redshift estimate for the burst of 1.61 was reported by Kelson et al. (1999) and Hjorth et al. (1999).
GRB 941017—which was also observed with the Energetic Gamma Ray Experiment (EGRET) on board CGRO—was the first burst of the pre-Fermi era for which a strong deviation at high energy from the Band function was reported (González et al., 2003). GRB 941017 was considered as adequately fitted to a combination of a Band function fading with time and an additional PL remaining constant and incompatible with the synchrotron models. Unfortunately no redshift was measured for this GRB.
Finally, we also analyzed GRB 970111 that was thought to be adequately fitted to a Band function but with positive values of at early times. The photometric redshift of this burst was estimated to be 0.2z1.4 based on its probable association with host galaxies at this redshift range (Gorosabel et al., 1998). Unfortunately, many fainter galaxies may lie in the same region of the sky and the association with the detected objects is not secure, which jeopardizes the validity of this photometric redshift.
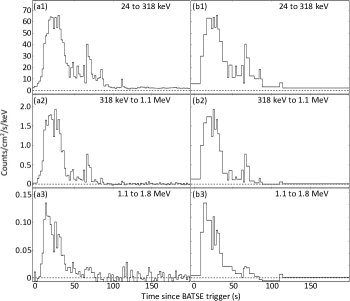
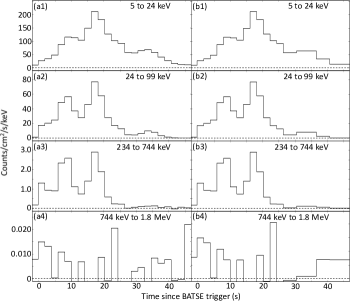
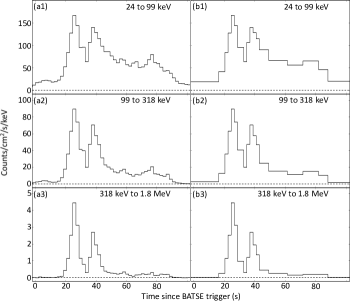
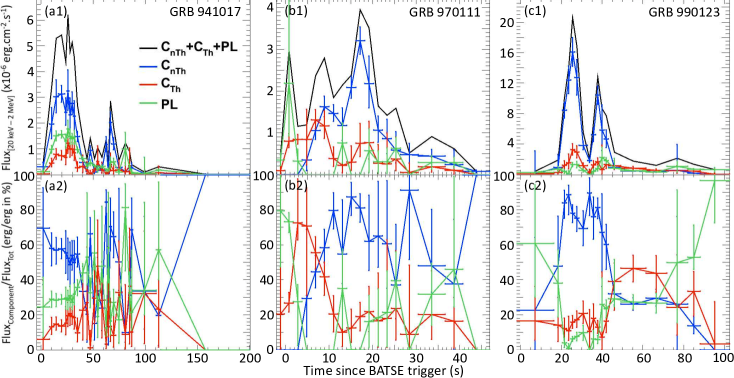
The light curves of GRBs 941017, 970111 and 990123 are presented in Figures 1, 2 and 3, respectively.
Detailed descriptions of the BATSE instrument are given in several references such as Fishman et al. (1989), Pendleton et al. (1995), Preece et al. (2000) and Kaneko et al. (2006); therefore, only a brief description sufficient to understand the data selection is given below.
BATSE consisted of 8 individual identical detector modules located at each corner of the CGRO spacecraft comprising the faces of a regular octahedron. Each module was built of two NaI(Tl) scintillation detectors coupled with photomultiplier tubes (PMTs): a Large Area Detector (LAD) optimized for sensitivity and directional response, and a Spectroscopy Detector (SD) optimized for energy coverage and resolution. While the LADs had a constant energy range extending from 20 keV up to 1.9 MeV, the SDs had an adjustable energy range between 10 keV and 100 MeV depending on the gain of the PMTs. Despite their significantly better spectral capabilities, the SDs had a collecting area 16 times smaller than the LADs reducing considerably their sensitivity. The data collected by each of the 16 BATSE detectors can be analyzed either individually or simultaneously in joint fits.
| Models | Base Component | Additional Component | Cstat/dof | |||
| CPL or Band | BB | PL | ||||
| Parameters | Epeak | kT | Index | |||
| (keV) | (keV) | |||||
| GRB 941017 from T0-4.096 s to T0+118.784 s | ||||||
| Band | 3305 | -0.780.01 | -2.350.03 | – | – | 205.8/9 |
| CnTh+PL | 2704 | +0.120.07 | – | – | -1.620.01 | 75.3/8 |
| CnTh+PL | 2729 | +0.010.25 | -2.290.15 | – | -1.990.33 | 28.2/7 |
| CnTh+CTh | 78444 | -1.330.02 | – | 56.00.66 | – | 25.1/8 |
| CnTh+CTh | 67475 | -1.300.03 | -2.410.22 | 56.30.73 | – | 23.6/7 |
| CnTh+CTh+PL | 45152 | -0.620.27 | – | 51.82.3 | -1.700.03 | 18.3/6 |
| GRB 970111 from T0-2.304 s to T0+42.752 s | ||||||
| CPL | 1601 | -0.760.01 | – | – | – | 98.7/10 |
| Band | 1591 | -0.760.02 | -4.550.62 | – | – | 96.7/9 |
| CnTh+PL | 1631 | -0.200.08 | – | – | -2.260.06 | 38.5/8 |
| CnTh+CTh | 1513 | -1.210.06 | – | 42.01.0 | – | 24.3/8 |
| CnTh+CTh+PL | 1448 | -1.140.48 | – | 43.22.1 | -1.720.80 | 23.0/6 |
| GRB 990123 from T0 to T0+100.352 s | ||||||
| Band | 60910 | -0.890.01 | -2.660.09 | – | – | 382.4/9 |
| CnTh+PL | 4328 | -0.100.05 | – | – | -1.580.01 | 123.3/8 |
| CnTh+CTh | 99941 | -1.200.02 | – | 81.71.1 | – | 99.6/8 |
| CnTh+CTh+PL | 61460 | -0.400.20 | – | 63.84.4 | -1.680.03 | 68.3/6 |
In our analysis, we only used LAD data because the sensitivity of the SEDs was too low for the type of analysis presented here (i.e., time-resolved analysis using multiple spectral components). We used the LAD Continuous (CONT) data for which the energy range is divided into 16 energy channels with an accumulation time of 2.048s. For each of the three GRBs, we used the LAD detector with the smallest angle to the source (i.e., LAD4 for GRB 941017 and LAD0 for GRBs 970111 and 990123). The response matrices were generated using the best source locations for the three GRBs.
3. Analysis Methodology
We followed here the same procedure as described in detail in Guiriec et al. (2011a, 2013, 2015a, 2015c). We first performed a time-integrated analysis of the bursts to identify the main spectral components of the prompt emission. Then we analyzed the bursts on fine time scales to follow the evolution of the various components and to verify that the observed spectral features are not merely artifacts due, for instance, to strong spectral evolution.
For this analysis, we used the fitting package Rmfit and we determined the best parameters of the various tested models as well as their 1- uncertainties by minimizing Castor C-Statistic (hereafter, Cstat). Cstat is a likelihood technique converging to a for a specific data set when there is “enough” data.
As proposed in Guiriec et al. (2011a, 2013, 2015a, 2015c) we fitted our CnTh+CTh+CnTh2 model to the three GRBs where: (i) CnTh is a component with a non-thermal spectral shape that we approximated with either a CPL or Band function; (ii) CTh is either or a thermal-like component that we approximated with a black body (BB) spectrum in the current analysis; and (iii) CnTh2 is either or a second non-thermal component that we approximated with a PL. While we left all the parameters of CnTh+CTh+CnTh2 free in the time-integrated spectral analysis we froze to -0.7, to -5 (i.e., CPL) and to -1.5 as proposed in Guiriec et al. (2015a) in the time-resolved one (i.e., CnTh+CTh+PL5params).
4. Results
4.1. Time-Integrated Spectral Analysis
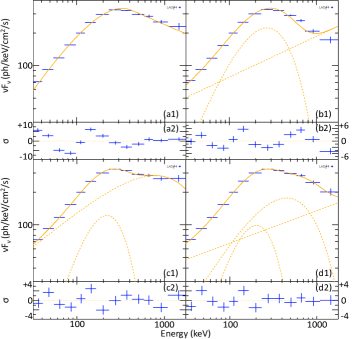
Table 1 summarizes the results of the time-integrated analysis for the three GRBs and the more relevant models are presented in Figures 4 to 6. It is clear from the Cstat values that a Band function alone is not a good description of the time-integrated spectra; this is also supported by the strong wavy pattern observed in the residuals of the Band-only fits as shown in panels (a2) of Figures 4 to 6.
CnTh+CTh significantly improves the Band-only fits by 181, 72 and 283 units of Cstat for only one additional free parameter for GRBs 941017, 970111 and 990123, respectively. For the three GRBs, CnTh is adequately approximated with a CPL in the CnTh+CTh scenario.
Although not as good as CnTh+CTh, CnTh+PL is also significantly better than Band-alone. It is not surprising because the additional PL usually overpowers CnTh below few tens of keV and above few MeV as reported from Fermi data (Abdo et al., 2009b; Ackermann et al., 2010, 2011; Guiriec et al., 2010, 2015a). Indeed, since the energy range of BATSE only extends from 20 keV up to 2 MeV, the additional PL, if it exists, is most likely highly subdominant in this energy band compared to the other components. With a broader energy range, which extends from 8 keV up to 40 MeV, firm identifications of the additional PL are much easier with the Fermi/Gamma-ray Burst Monitor (GBM) as shown in Guiriec et al. (2010, 2015a). Therefore, we do not expect to usually have an as strong Cstat improvement with the additional PL over the BATSE energy range as with CTh, but its possible existence cannot be discarded.
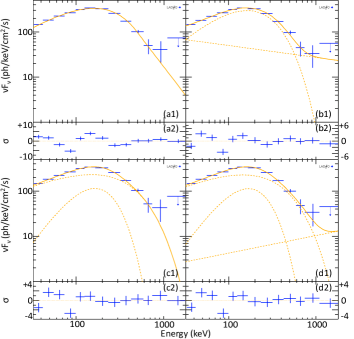
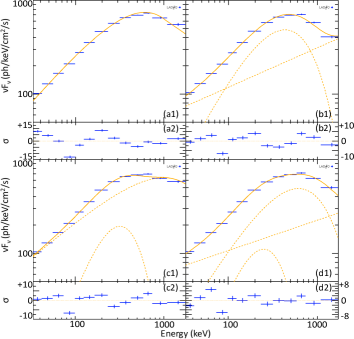
A Cstat improvement of 31 units for two additional free parameters is obtained when adding a PL to CnTh+CTh for GRB 990123 (i.e., CnTh+CTh+PL) suggesting the simultaneous presence of the three components as presented in several Fermi GRBs in Guiriec et al. (2015a). For GRB 941017, only a limited Cstat improvement is obtained with CnTh+CTh+PL, but since the additional PL is supported by the joint analysis of BATSE and EGRET data in González et al. (2003), we can, therefore, be confident about its existence. Claiming the possible presence of an additional PL component is much more speculative in the case of GRB 970111. Indeed, even if CnTh+CTh+PL can be fitted to the data of this GRB, the parameters of the additional PL are not well constrained and its flux is compatible with 0; however, we will see that the time-resolved analysis may support the presence of the additional PL albeit weaker than in the two other GRBs.
In addition to the discussion above, Figures 4 to 6 show a clear flattening of the residuals in the multi-component scenarios and the systematic wavy patterns observed in the residuals of the Band-only fits are replaced by much more random ones with CnTh+CTh+PL; therefore, the resulting spectral shape of this three component model appears as a valid option to describe the spectra of the three GRBs.
4.2. Time-Resolved Spectral Analysis
In this Section we only discuss the most relevant models resulting from the time-integrated spectral analysis: Band, CnTh+CTh and CnTh+CTh+PL. Here, CnTh is approximated with a CPL for both CnTh+CTh and CnTh+CTh+PL. With 7 free parameters, it is often challenging to fit CnTh+CTh+PL to the data in the fine time-intervals and to get meaningful constrains on the values of the spectral parameters; therefore, we fixed the spectral index values of CnTh and of the additional PL to -0.7 and -1.5, respectively, as proposed in Guiriec et al. (2015a). Although these parameter estimates may not be the most accurate ones, they are good enough in the context of our analysis, which does not plan to study the detailed spectral shape of the various components, but their global shape and evolution. A more accurate estimate of these parameters based on a larger sample of GRBs will be the topic of a future article.
The results of the time-resolved spectral analysis are presented in Tables A1 to A3 as well as in Figures A1 to A6.
4.2.1 Band versus CnTh+CTh
The Fν spectra resulting from the Band-only and CnTh+CTh fits to the time-resolved data of GRBs 941017, 970111 and 990123 are overplotted in Figures A1, A2 and A3, respectively.
For only one additional free parameter, the Cstat values obtained when fitting CnTh+CTh to the data are overall much lower than these resulting from the fit to a Band function alone (see Tables A1 to A3.)
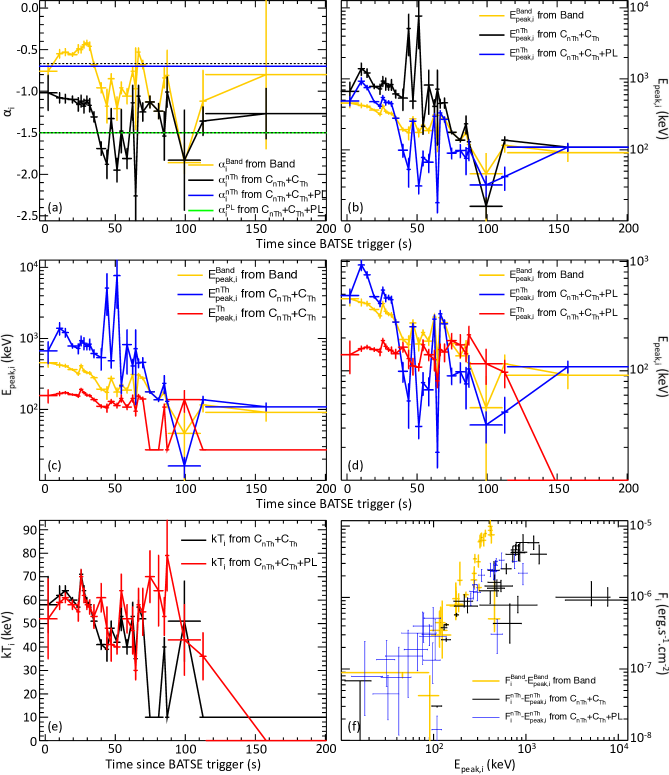
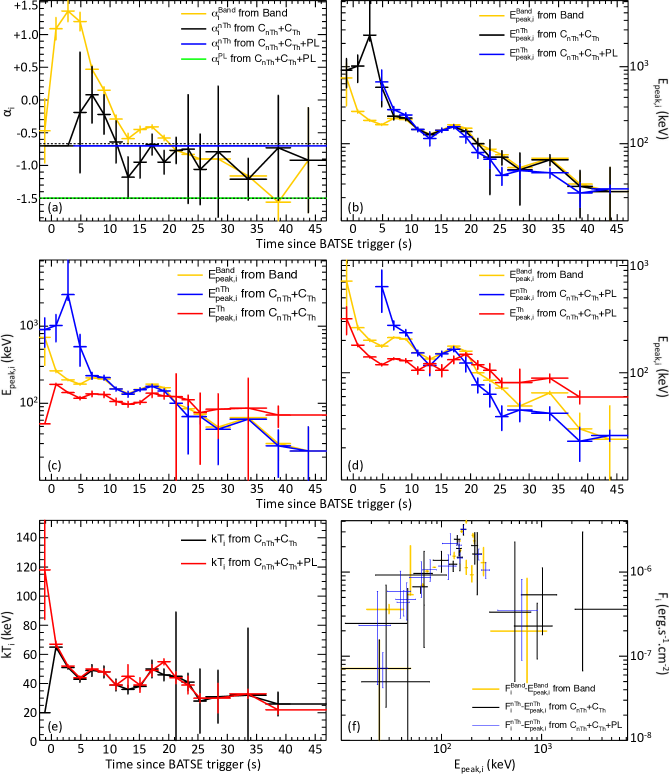
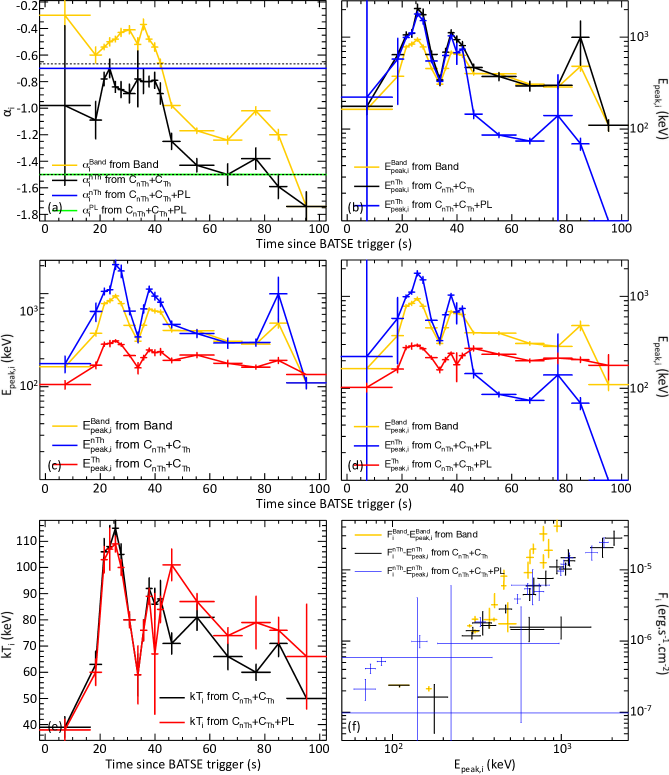
The similarities of BATSE and Fermi results are striking when comparing Band and CnTh+CTh. Indeed, is systematically lower than (panels (a) of Figures 7 to 9) and E is systematically higher than E (panels (c) of Figures 7 to 9) as reported in Guiriec et al. (2011a, 2013, 2015a, 2015c)222The index i indicates that we are discussing time-resolved values. i is the time-interval index..
The values exhibit strong evolution and discontinuities. While usually incompatible with synchrotron scenario limits during the first few tens of seconds, they become consistent with synchrotron emission from electrons in the slow (i.e., -2/3) and even in the fast (i.e., -3/2) cooling regimes at late times. Similarly to the results presented in Guiriec et al. (2013, 2015c), the values of are clearly positive and incompatible with non-thermal processes during the first 10 s of GRB 970111; this also corresponds to the time period during which CTh overpowers CnTh and therefore the spectral parameters of Band-alone are biased towards those of CTh (see the several first time-resolved spectra of GRB 970111 in Figure A2).
Conversely to , the values of are always compatible with at least the synchrotron slow cooling scenario (i.e., -2/3). As we will see in the next Section, the discontinuity of for GRB 990123—whose values drop from -0.8 down to -1.5 after T0+40 s—is consistent with the presence of an intense additional PL at late times (see Figure 9a).
Overall, the temperature of CTh (i.e., kTE/2.7; we choose to plot E instead of kT for an easier comparison to E and E) varies much less than E (see panels (c) of Figures 7 to 9.) While the temperature kT of the CTh varies between 40 and 120 keV for GRB 990123, its evolution is much more limited for GRBs 941017 and 970111 in which kT varies from 30 to 70 keV and from 20 to 65 keV, respectively (see panels (e) of Figures 7 to 9.).
E is usually lower than E. As noted in Guiriec et al. (2011a, 2013, 2015a, 2015c), the discrepancies between E and E are strongest at early times when the intensity of CTh is the highest; at later times, when the CTh contribution decreases, the values of E and E become extremely similar. This is particularly striking in the case of GRB 970111 (see Figure 8c): from T0 to T0+6 s, E evolves like E and not like E, while after T0+6 s E and E are perfectly identical. It is also interesting to note that the values of E seem to fall below those of E after T0+20 s as also reported in (Guiriec et al., 2015a) for Fermi GRBs; this trend will be clearer in the CnTh+CTh+PL analysis presented in the next Section.
4.2.2 CnTh+CTh versus CnTh+CTh+PL
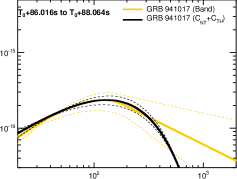
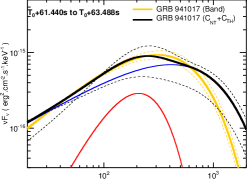
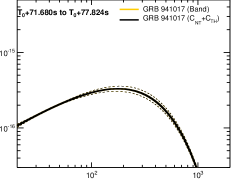
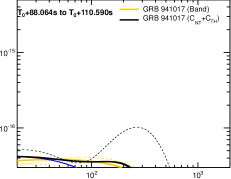
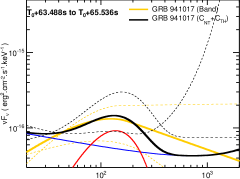
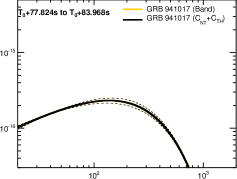
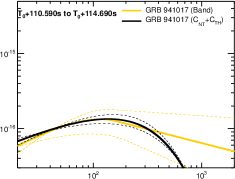
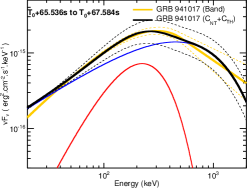
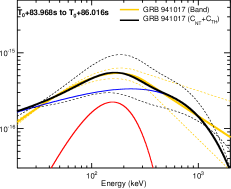
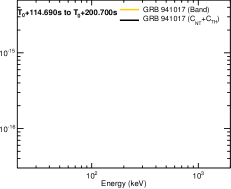
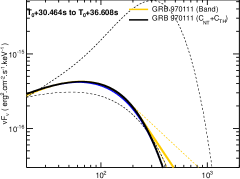
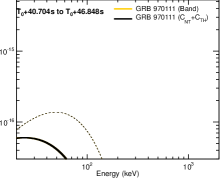
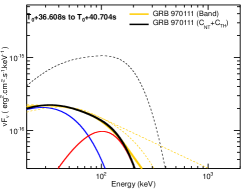
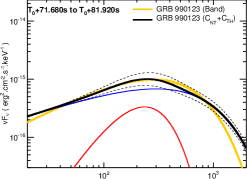
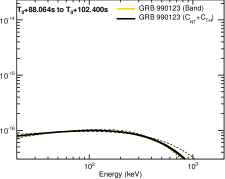
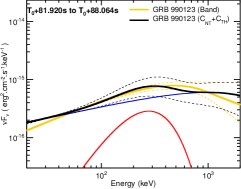
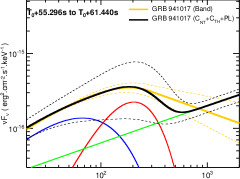
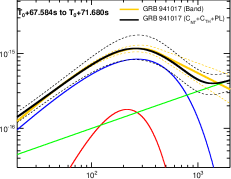
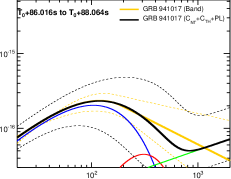
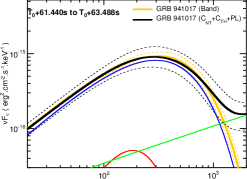
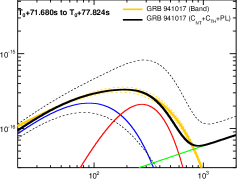
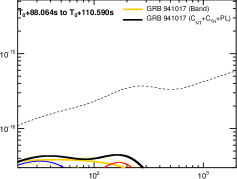
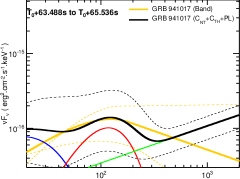
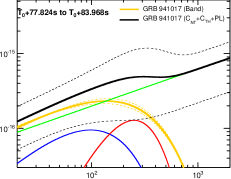
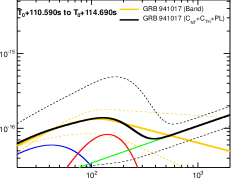
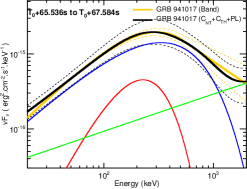
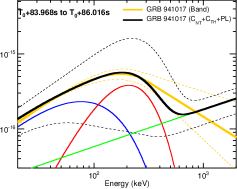
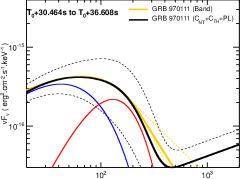
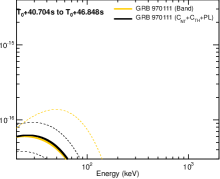
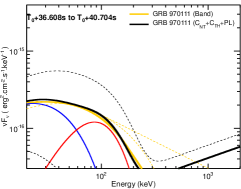
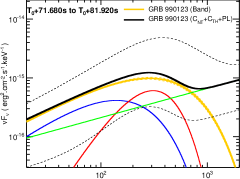
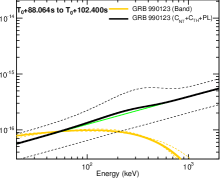
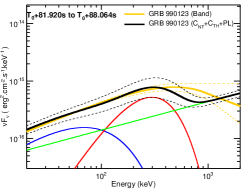
The Fν spectra resulting from the CnTh+CTh+PL fits to the time-resolved data of GRBs 941017, 970111 and 990123 are displayed in Figures A4, A5 and A6, respectively—together with the Band-only fit results.
In Guiriec et al. (2015a), we showed that the distributions of and peaked at -0.7 and at -1.5, respectively, for a sample of Fermi GRBs fitted to CnTh+CTh+PL. When fixing and of CnTh+CTh+PL to these typical values for all the time intervals of our current analysis of BATSE data, CnTh+CTh and CnTh+CTh+PL result in similar Cstat values, overall, for the same number of free parameters (see Tables A1 to A3).
When CnTh+CTh is fitted to the data of the three GRBs without the additional PL, the values of cluster around -1 that is an average of -0.7 and -1.5 (see panels (a) of Figures 7 to 9); this result is similar to the one reported in Guiriec et al. (2015a) that showed the impact of the extension at low energy of the additional PL on the values of . For GRB 970111, which exhibits a weaker additional PL component (see Section 4.1), the values remains closer to -0.7 with CnTh+CTh.
As also reported in Guiriec et al. (2015a), the values of E obtained when fitting CnTh+CTh+PL to the data are usually lower than those resulting from the CnTh+CTh fits (see panels (b) of Figures 7 to 9); this is particularly striking for GRB 941017 as well as for GRB 990123 after T0+45 s. This can easily be explained if we consider that the contribution of the additional PL at high energy (i.e., 1 MeV) is included in CnTh when fitting CnTh+CTh to the data and makes, therefore, the spectra of CnTh harder and their E values higher.
We mentioned in Section 4.1 the difficulty to clearly identify the additional PL in the time-integrated spectrum of GRB 970111. It is interesting to note that the CTh+PL fit—with =-1.5 and without any CnTh component—to the data of GRB 970111 provides an adequate description of the spectra during the first few seconds of the burst. This has two important consequences: first, the use of CTh+PL at early time results in an initial monotonic cooling of the thermal-like component, CTh, while it was not the case for the first time interval when fitting CnTh+CTh (see Figure 8e); second, this would indicate that similarly to the cases of GRBs 080916C and 090926A published in Guiriec et al. (2015a), the additional PL would be initially strong in GRB 970111 while CnTh is either weak or absent. The additional PL would then be present from the very beginning or even before the other components conversely to previous reports where the additional PL was considered to start with a delay compared to the other main non-thermal component (see for instance Ackermann et al., 2010, 2011).
4.3. The CnTh+CTh+PL Scenario
In Section 4.1 we discussed the presence of three spectral components in the time-integrated spectra of GRBs 941017, 970111 and 990123, and we followed their evolution with time in Section 4.2. We compared the differences in the spectral parameters when fitting the simplest model and the more complex ones, and we found strong similarities with the results reported in Guiriec et al. (2011a, 2013, 2015a, 2015c) from Fermi data. Since the time-resolved analysis of BATSE data is consistent with the new paradigm proposed in Guiriec et al. (2015a), we focussed on the CnTh+CTh+PL scenario later on.
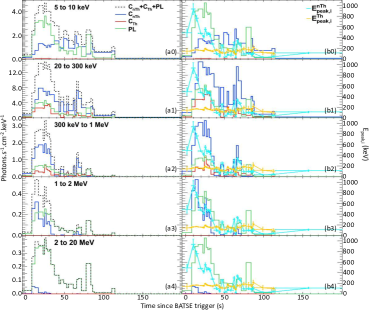
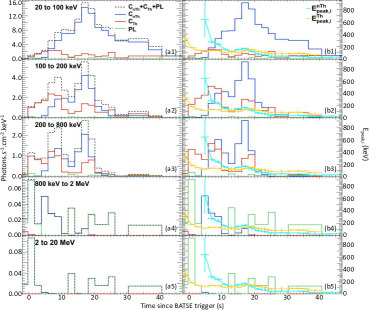
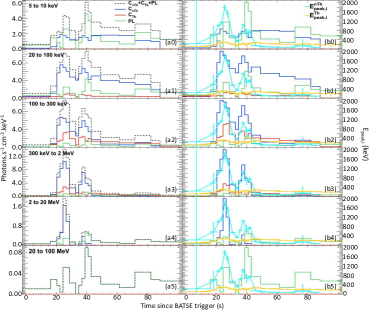
Figures 10 to 12 show the reconstructed photon light curves in various energy bands resulting from the time-resolved spectral analysis using CnTh+CTh+PL for GRBs 941017, 970111 and 990123. The energy light curves between 20 keV and 2 MeV as well as the relative contribution of each component to the total energy are presented in Figure 13.
The CnTh Component
Overall, CnTh overpowers the other components in the BATSE energy range from 20 keV to 2 MeV for the three GRBs (see Figures 10 to 12). Its contribution is usually higher than 50% of the total energy released between 20 keV and 2 MeV during the most intense part of the prompt emission (see Figure 13). The hardness of CnTh strongly evolves with time during each burst; indeed, E can vary from tens of keV up to several MeV in only a few seconds (see panels (d) of Figures 7 to 10).
The light curves of the CnTh component usually exhibit multiple intensity peaks whose hardness is correlated to the flux; this is clearly evident with the E values tracking the photon fluxes as shown in panels (b) of Figures 10 to 12. The correlation between the energy flux of CnTh, F, and E will be studied in detail in Section 4.4.
The CTh Component
The contribution of the CTh component to the total energy between 20 keV and 2 MeV is globally 20% of the total emission during most of the burst duration, which is consistent with the results reported from Fermi data in Guiriec et al. (2013, 2015a, 2015c). CTh is usually more intense at early times. The temperature of CTh—approximated with E for an easier comparison with E—does not vary over the same amplitude as E (see panels (b) of Figures 10 to 12.); indeed, kTi varies between 30 and 80 keV, between 20 and 140 keV and between 40 and 110 keV for GRBs 941017, 970111 and 990123, respectively (see panels (e) of Figures 7 to 9). Although a limited correlation may exist between the flux of CTh and its temperature, kTi remains more or less constant with time for GRBs 941017 and 990123; this result is similar to the one reported from the observations of GRBs 080916C and 090926A in Guiriec et al. (2015a).
The behavior of GRB 970111 is peculiar compared to the two other GRBs of this study but very similar to Fermi GRB 131014A published in Guiriec et al. (2015c). Indeed, GRB 970111 exhibits a initial nearly purely thermal episode333This is is consistent with Ryde (2004) that reported a pure BB spectrum at early times for GRB 970111.—despite the presence of the additional PL at early times—with a monotonic cooling from 120 keV down to 45 keV during the first five seconds of the burst (see Figures 8e and 11b). After T0+5 s, kTi continues to cool slowly from 45 down to 25 keV during the remaining 40 s of the studied emission period although there is very slight reheating consistent with the light curve peaks of the thermal-like component.
Despite some similarities in the light curve structures, there is no evidence for a perfect correlation either between the flux variations of CnTh and CTh nor between the variations of E and E (see panels (d) of Figures 7 to 9 and panels (b) of Figures 10 to 12). It is particularly striking that while E is usually much higher than E at early times for all three GRBs, its values drop below E at late times.
The Additional PL Component
The overall contribution of the additional PL to the total energy between 20 keV and 2 MeV is roughly few tens of percents although it can be 70% at early and late times (see Figure 13).
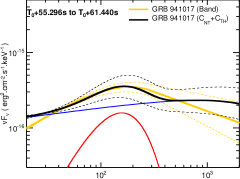
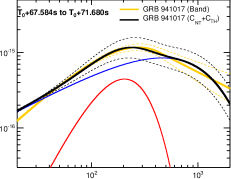
It has been reported many times from Fermi data that the additional PL usually extends from a few keV up to tens to hundreds of MeV and maybe even up to GeVs; the additional PL usually overpowers CnTh below few tens of keV and above several MeVs (Abdo et al., 2009b; Ackermann et al., 2010, 2011; Guiriec et al., 2011a, 2015a). Because of the limited energy range of BATSE, the additional PL is mostly subdominant compared to CnTh over the whole observed energy band, and it only starts to be the dominant component at the very high-end of the spectrum (see Figures A4 to A6). Although CnTh clearly outshines the additional PL below 20 keV in GRB 970111 (see Figure 11), there is evidence for an extension of the additional PL at low and high energies with a flux higher than in the other components in GRBs 941017 and 990123 (see Figures 10 and 12). For a better comparison to the Fermi data, we extrapolated the CnTh+CTh+PL model derived from the 20 keV to 2 MeV BATSE data down to 5 keV—to mimic the low end of the energy range of the GBM NaI detectors—and beyond 2 MeV—to mimic the high energy coverage of GBM BGO detectors up to 40 MeV as well as the 20 to 100 MeV energy range of the Fermi/Large Area Telescope (LAT). If Fermi had observed GRBs 941017 and GRB990123—without considering the instrumental sensitivities nor possible 100 MeV breaks in the additional PL as suggested in Guiriec et al. (2015a)—, it would have detected an additional PL outshining the other components at low and high energies similarly to the other bursts with additional PL detected by Fermi:
-
•
If observed with Fermi, the additional PL in GRB 941017 would correspond to a broad pulse in the light curves with a fast rise and exponential decay type shape (see Figure 10); despite the similarities in the timing of the most intense part of the additional PL with the other components, their evolution with time are quite different. The additional PL emission would be the most intense between T0+10 s and T0+30 s, then the emission would quickly decay but it would remain present until at least T0+100 s; this is in perfect agreement with the 1 MeV light curves of the data from the Total Absorption Shower Counter (TASC), which is the calorimeter of the Energetic Gamma-Ray Experiment Telescope (EGRET) on board CGRO, presented in Figure 1 in González et al. (2003). The broad shape of the additional PL light curve is similar to the one reported for Fermi GRB 090902B in Abdo et al. (2009b).
-
•
The case of GRB 990123 is particularly interesting with respect to the additional PL. In Guiriec et al. (2015a) we reported that the additional PLs identified in Fermi GRBs 080916C and 090926A, were, overall, low intensity components that sometimes strongly outshine the other ones during short periods of time of the order of a few seconds—short duration excesses associated with the additional PL were also reported in Ackermann et al. (2011) and González et al. (2012) for Fermi GRB 090926A and BATSE GRB 980923. The same behavior is observed in GRB 990123 (see Figure 12). Indeed, if Fermi had observed this GRB, it would have detected a strong intensity peak at low energies below 10 keV around T0+40 s and lasting 5 s perfectly correlated in time with an intense peak in the light curve above a few MeV. As shown in Figure 12, this intensity peak in the light curves would be mostly related to the additional PL. However, the contribution of the additional PL would be mostly hidden by the intense CnTh component between a few tens of keV and several MeV as in GRB 080916C (Guiriec et al., 2015a).
4.4. F–E and L–E relations, and distance estimates
The F–E Relation
When fitting the -ray prompt emission of both short and long GRBs to a Band function, a correlation is often observed between the evolution of the -ray energy flux, F, and the evolution of the corresponding E within each burst (i.e., F–E relation – see for instance Golenetskii et al., 1983; Borgonovo & Ryde, 2001; Liang et al., 2004; Guiriec et al., 2010, 2015a; Ghirlanda et al., 2011a, b; Lu et al., 2012). Although this correlation globally follows a PL, there is often large scatter in the data of each burst and the PL indices can be dramatically different from burst to burst. More importantly, there are many bursts that do not exhibit this correlation.
In Guiriec et al. (2013, 2015a, 2015c) we introduced a new relation between the -ray energy flux and the spectral hardness. Indeed, by isolating the non-thermal component of the spectra from the thermal-like one—in fitting CnTh+CTh or CnTh+CTh+PL to the data—we showed that a very strong correlation, intrinsic to the non-thermal component only, appears between the evolution of its energy flux, F, and the evolution of its Fν -ray spectral peak, E (i.e., F– E relation). Conversely to the F–E relations, the F– E relations have extremely similar indices for all GRBs when fitted to PLs.
Moreover, in the central engine frame, the F– E relations translate into a unique L–E relation—with the same index as the F–E relation—that seems to be universal for all short and long GRBs (Guiriec et al., 2013, 2015a, 2015c).
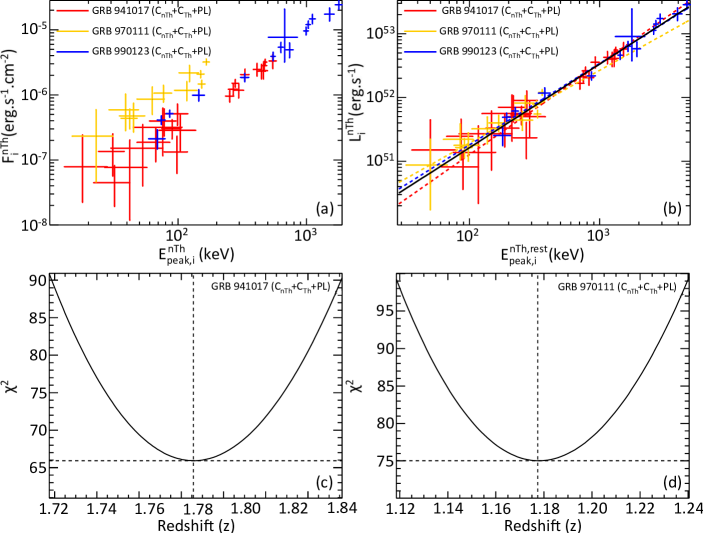
The panels (f) of Figures 7 to 9 show the F–E and F– E relations for the Band, CnTh+CTh and CnTh+CTh+PL models. As already reported in Guiriec et al. (2013, 2015a, 2015c) for other GRBs, the energy flux and Epeak values are typically anti-correlated at very early times in the burst, which also usually corresponds to the highest values of Epeak. The indices of the PLs fitted to these relations—after excluding the anti-correlated early phase—are reported in Table 2. Apart from GRB 970111, the indices of the F–E relations are inconsistent with the F– E ones; the indices of the F–E relations are also dramatically different from one burst to the other (i.e., from +1.4 to +3.2). Conversely, the indices of the F– E relations are all clustered with the CnTh+CTh+PL model (between +1.3 and +1.5 – see Figure 14a); these values are perfectly consistent with the indices of +1.330.06, +1.380.04 and +1.430.03 reported in Guiriec et al. (2013, 2015a, 2015c), respectively.
| F–E or F–E relation PL-indices for | |||
| Band | CnTh+CTh | CnTh+CTh+PL | |
| GRB 941017 | +3.070.12 | +1.350.06 | +1.400.10 |
| GRB 970111 | +1.430.04 | +1.610.32 | +1.330.23 |
| GRB 990123 | +2.680.09 | +1.720.09 | +1.280.05 |
Redshift Estimates Using the L–E Relation
In our three BATSE-burst sample, GRB 990123 has an accurate redshift measurement of z1.61. There are no redshift measurements available for GRB 941017 and GRB 970111, although host galaxies possibly associated to GRB 970111 resulted in a initial redshift range of 0.2z1.4 (Gorosabel et al., 1998). Assuming that the L– E relation is universal—as suggested in Guiriec et al. (2013, 2015a)—, we estimated the distance of GRBs 941017 and 970111 using GRB 990123 as the reference; the L– E relation for GRB 990123 is displayed in Figure 14b (dashed blue line). We varied the redshift to determine the values that minimize the distances between the dashed blue line and the data of GRBs 941017 and 970111. To do so, we performed a linear fit in the log–log space to account for the uncertainties on both the L and E quantities; the resulting profiles are displayed in panels (c) and (d) of Figure 14 for GRBs 941017 and 970111, respectively. The redshift estimates using this technique are reported in Table 3. Interestingly, the distance estimate for GRB 970111 (i.e., z=1.180.06) is compatible with the redshifts of the galaxies (i.e., 0.2z1.4) identified as possible hosts for this burst in Gorosabel et al. (1998); however, this result should not be interpreted as a proof of the technique nor as a proof that the host galaxy is one of the objects identified between z=0.2 and z=1.4 since it may be a coincidence. The redshift estimate for GRB 941017 (i.e., z=1.790.07) is a typical value for a long GRB (i.e., z2.16 – Jakobsson et al., 2012).
Figure 14b shows the L– E relations for the three bursts using the redshift measurement for GRB 990123 and the redshift estimates for the two other bursts. The PL fits to each burst are displayed in dashed color lines. The solid black line is the fit to the whole data together, and it results in a PL index of +1.310.03, which is in perfect agreement with the results published in Guiriec et al. (2013, 2015a, 2015c) using Fermi data.
| Measured z | z estimates | |
|---|---|---|
| GRB 941017 | – | 1.790.07 |
| GRB 970111 | 0.2z1.4444This photometric redshift estimate, based on possible host-galaxy identifications reported in Gorosabel et al. (1998), is not secure because fainter objects are present in this region of the sky and one of them may be the actual host galaxy of GRB 970111. | 1.180.06 |
| GRB 990123 | 1.61 | – |
5. Conclusion
In this article we tested the new paradigm for GRB prompt emission proposed in Guiriec et al. (2011a, 2013, 2015a, 2015c) to three bright and famous BATSE GRBs; according to this new model, GRB prompt emission is composed of three main components: (i) a thermal-like component, CTh, that we interpret as emission from the jet photosphere, (ii) a non-thermal component, CnTh, interpreted as synchrotron emission from charged particles propagating and accelerated within the GRB jet, and (iii) a second non-thermal component adequately fitted to a PL with or without cutoff, which extends from below few tens of keV up to tens or hundreds of MeV, and most likely of inverse Compton origin. The three components are not systematically present or detectable in all GRBs, especially the second non-thermal component, which is clearly identified only in a limited number of GRBs.
This new model is perfectly consistent with the prompt emission data of GRBs 941017, 970111 and 990123 recorded with BATSE. We identified the signature of the three components in the time-integrated spectra of the three bursts and followed their evolution through fine time-resolved analysis. The results are similar to those reported from Fermi GRBs:
-
•
CnTh is the most intense component from 20 keV to 2 MeV and accounts for 50–60% of the total collected energy in this energy range. The Fν peak energy of CnTh, E, exhibits strong variations perfectly correlated with the energy flux variations of this component, F (i.e., F–E relation).
-
•
The CTh contribution to the total energy between 20 keV and 2 MeV is usually 20%. CTh is present from the beginning of the burst and its intensity globally decreases with time. The temperature of CTh is either globally constant during the whole burst duration (i.e., GRBs 941017 and 990123) or it globally decreases with time with a strong cooling phase during the first seconds (i.e., GRB 970111). In GRB 970111, CTh contributes for 70% of the total energy during an initial nearly purely thermal episode lasting for a few seconds similarly to Fermi GRB 131014A (Guiriec et al., 2015c).
-
•
The flux of the additional PL is very significant for GRBs 941017 and 990123, but only marginal for GRB 970111. This component is present from the very beginning to the very end of the burst, and contributes to 30% of the total energy between 20 keV and 2 MeV. Extrapolation of the CnTh+CTh+PL model over a broader energy range covered by Fermi (i.e., 5 keV to 100 MeV) shows that the PL would overpower the other components below a few tens of keV and above a few MeV; this is striking for GRB 941017. In addition, for GRB 990123, intense and short duration light-curve structures associated to the additional PL would be present in the low and high energy bands (10 keV and 20 MeV, respectively) and perfectly correlated in time such as reported for Fermi GRBs (Guiriec et al., 2015a).
The relative contribution of each component to the total energy strongly evolves with time showing that there is no perfect correlation between the three components. There is also no clear correlation between E and E.
The PL indices of the F–E relations are very similar for the three GRBs (i.e., 1.3–1.4) and they are also similar to the values reported from Fermi GRBs in Guiriec et al. (2013, 2015a, 2015c).
Assuming that the L–E relation is universal as suggested in Guiriec et al. (2013, 2015a), and using GRB 990123—which has a measured redshift z1.61—as reference, we estimated the redshift of GRBs 970111 and 941017 to be z=1.180.06 and z=1.790.07, respectively. The redshift estimate for GRB 970111 is compatible with the redshifts of the galaxies identified as possible hosts in (0.2z1.4 – Gorosabel et al., 1998); however, the actual host may be a fainter galaxy not yet identified. Despite the lack of constraints for the distance of GRB 941017, the redshift estimate for this burst has a value perfectly typical for long GRBs.
6. Acknowledgments
S.G. was supported by the NASA Postdoctoral Program (NPP) at the NASA/Goddard Space Flight Center, administered by Oak Ridge Associated Universities through a contract with NASA as well as by the NASA grants NNH11ZDA001N and NNH13ZDA001N awarded to S.G. during the cycles 5 and 7 of the NASA Fermi Guest Investigator Program. M.M.G was supported by DGAPA UNAM grant number IG100414-3.
References
- Abdo et al. (2009a) Abdo, A. A., Ackermann, M., Arimoto, M., et al.: 2009a, Science, 323, 1688
- Abdo et al. (2009b) Abdo, A. A., Ackermann, M., Ajello, M., et al.: 2009b, ApJ, 706, L138
- Ackermann et al. (2010) Ackermann, M., Asano, K., Atwood, W. B., et al.: 2010, ApJ, 716, 1178
- Ackermann et al. (2011) Ackermann, M., Ajello, M., Asano, K., et al.: 2011, ApJ, 729, 114
- Akerlof et al. (1999) Akerlof, C., Balsano, R., Barthelmy, S., et al.: 1999, Nature, 398, 400
- Axelsson et al. (2012) Axelsson, M., Baldini, L., Barbiellini, G., et al.: 2012, ApJ, 757, L31
- Band et al. (1993) Band, D., Matteson, J., Ford, L., et al.: 1993, ApJ, 413, 281
- Beloborodov (2010) Beloborodov, A. M.: 2010, MNRAS, 407, 1033
- Beloborodov et al. (2014) Beloborodov, A. M., Hascoët, R., & Vurm, I.: 2014, ApJ, 788, 36
- Borgonovo & Ryde (2001) Borgonovo, L., & Ryde, F.: 2001, ApJ, 548, 770
- Briggs et al. (1999) Briggs, M. S., Band, D. L., Kippen, R. M., et al.: 1999, ApJ, 524, 82
- Cavallo & Rees (1978) Cavallo, G., & Rees, M. J.: 1978, MNRAS, 183, 359
- Cohen et al. (1997) Cohen, E., Katz, J. I., Piran, T., et al.: 1997, ApJ, 488, 330
- Crider et al. (1997) Crider, A., Liang, E. P., Smith, I. A., et al.: 1997, ApJ, 479, L39
- Daigne & Mochkovitch (2002) Daigne, F., & Mochkovitch, R.: 2002, MNRAS, 336, 1271
- Fishman et al. (1989) Fishman, G. J., Meegan, C. A., Wilson, R. B., et al.: 1989, BAAS, 21, 860
- Gehrels (1997) Gehrels, N.: 1997, Nuovo Cimento B Serie, 112, 11
- Ghirlanda et al. (2011a) Ghirlanda, G., Ghisellini, G., Nava, L., & Burlon, D.: 2011a, MNRAS, 410, L47
- Ghirlanda et al. (2011b) Ghirlanda, G., Ghisellini, G., & Nava, L.: 2011b, MNRAS, 418, L109
- Ghisellini et al. (2000) Ghisellini, G., Celotti, A., & Lazzati, D.: 2000, MNRAS, 313, L1
- Golenetskii et al. (1983) Golenetskii, S. V., Mazets, E. P., Aptekar, R. L., & Ilinskii, V. N.: 1983, Nature, 306, 451
- González et al. (2003) González, M. M., Dingus, B. L., Kaneko, Y., et al.: 2003, Nature, 424, 749
- González et al. (2009) González, M. M., Carrillo-Barragán, M., Dingus, B. L., et al.: 2009, ApJ, 696, 2155
- González et al. (2012) González, M. M., Sacahui, J. R., Ramirez, J. L., Patricelli, B., & Kaneko, Y.: 2012, ApJ, 755, 140
- Goodman (1986) Goodman, J.: 1986, ApJ, 308, L47
- Gorosabel et al. (1998) Gorosabel, J., Castro-Tirado, A. J., Wolf, C., et al.: 1998, A&A, 339, 719
- Greiner et al. (1995) Greiner, J., Sommer, M., Bade, N., et al.: 1995, A&A, 302, 121
- Guiriec et al. (2010) Guiriec, S., Briggs, M. S., Connaughton, V., et al.: 2010, ApJ, 725, 225
- Guiriec et al. (2011a) Guiriec, S., Connaughton, V., Briggs, M. S., et al.: 2011a, ApJ, 727, L33
- Guiriec (2011b) Guiriec, S.: 2011b, AAS/HEAD, 12, 01.04
- Guiriec et al. (2013) Guiriec, S., Daigne, F., Hascoët, R., et al.: 2013, ApJ, 770, 32
- Guiriec et al. (2015a) Guiriec, S., Kouveliotou, C., Daigne, F., et al.: 2015a, ApJ, 807, 148
- Guiriec et al. (2015c) Guiriec, S., et al.: 2015c, Submitted
- Hjorth et al. (1999) Hjorth, J., Andersen, M. I., Cairos, L. M., et al.: 1999, GRB Coordinates Network, 219, 1
- Hascoët et al. (2013) Hascoët, R., Daigne, F., & Mochkovitch, R.: 2013, A&A, 551, A124
- Jakobsson et al. (2012) Jakobsson, P., Hjorth, J., Malesani, D., et al.: 2012, ApJ, 752, 62
- Kaneko et al. (2006) Kaneko, Y., Preece, R. D., Briggs, M. S., et al.: 2006, ApJS, 166, 298
- Kelson et al. (1999) Kelson, D. D., Illingworth, G. D., Franx, M., Magee, D., & van Dokkum, P. G.: 1999, IAU Circ., 7096, 3
- Liang et al. (2004) Liang, E. W., Dai, Z. G., & Wu, X. F.: 2004 ApJ, 606, L29
- Lu et al. (2012) Lu, R.-J., Wei, J.-J., Liang, E.-W., et al.: 2012, ApJ, 756, 112
- Mészáros & Rees (1993) Mészáros, P., & Rees, M. J.: 1993, ApJ, 418, L59
- Nakar et al. (2005) Nakar, E., Piran, T., & Sari, R.: 2005, ApJ, 635, 516
- Paczynski (1986) Paczynski, B.: 1986, ApJ, 308, L43
- Pe’er (2008) Pe’er, A.: 2008, ApJ, 682, 463
- Pe’er (2015) Pe’er, A.: 2015, arXiv:1504.02626
- Pendleton et al. (1995) Pendleton, G. N., Paciesas, W. S., Mallozzi, R. S., et al.: 1995, Nuclear Instruments and Methods in Physics Research A, 364, 567
- Preece et al. (1998) Preece, R. D., Briggs, M. S., Mallozzi, R. S., et al.: 1998, ApJ, 506, L23
- Preece et al. (2000) Preece, R. D., Briggs, M. S., Mallozzi, R. S., et al.: 2000, ApJS, 126, 19
- Rees & Mészáros (1992) Rees, M. J., & Mészáros, P.: 1992, MNRAS, 258, 41P
- Rees & Mészáros (1994) Rees, M. J., & Mészáros, P.: 1994, ApJ, 430, L93
- Ryde (2004) Ryde, F.: 2004, ApJ, 614, 827
- Shemi & Piran (1990) Shemi, A., & Piran, T.: 1990, ApJ, 365, L55
- Vurm & Beloborodov (2014) Vurm, I., & Beloborodov, A. M.: 2015, Submitted
- Zhang & Pe’er (2009) Zhang, B., & Pe’er, A.: 2009, ApJ, 700, L65
Appendix A Spectral Analysis Results
Appendix B Fine Time-Resolved Analysis
Figure A1 and A2 show the results of the fine time-resolved analysis of GRB 941017 with a Band function alone and the CnTh+CTh or the CnTh+CTh+PL models, respectively, as presented in Section 4.2.
Figure A3 and A4 show the results of the fine time-resolved analysis of GRB 970111 with a Band function alone and the CnTh+CTh or the CnTh+CTh+PL models as presented in Section 4.2.
Figure A5 and A6 show the results of the fine time-resolved analysis of GRB 990123 with a Band function alone and the CnTh+CTh or the CnTh+CTh+PL models as presented in Section 4.2.
![[Uncaptioned image]](/html/1507.04081/assets/x15.png)
![[Uncaptioned image]](/html/1507.04081/assets/x16.png)
![[Uncaptioned image]](/html/1507.04081/assets/x17.png)
![[Uncaptioned image]](/html/1507.04081/assets/x18.png)
![[Uncaptioned image]](/html/1507.04081/assets/x19.png)
![[Uncaptioned image]](/html/1507.04081/assets/x20.png)
![[Uncaptioned image]](/html/1507.04081/assets/x21.png)
![[Uncaptioned image]](/html/1507.04081/assets/x22.png)
![[Uncaptioned image]](/html/1507.04081/assets/x23.png)
![[Uncaptioned image]](/html/1507.04081/assets/x24.png)
![[Uncaptioned image]](/html/1507.04081/assets/x25.png)
![[Uncaptioned image]](/html/1507.04081/assets/x26.png)
![[Uncaptioned image]](/html/1507.04081/assets/x27.png)
![[Uncaptioned image]](/html/1507.04081/assets/x28.png)
![[Uncaptioned image]](/html/1507.04081/assets/x29.png)
![[Uncaptioned image]](/html/1507.04081/assets/x42.png)
![[Uncaptioned image]](/html/1507.04081/assets/x43.png)
![[Uncaptioned image]](/html/1507.04081/assets/x44.png)
![[Uncaptioned image]](/html/1507.04081/assets/x45.png)
![[Uncaptioned image]](/html/1507.04081/assets/x46.png)
![[Uncaptioned image]](/html/1507.04081/assets/x47.png)
![[Uncaptioned image]](/html/1507.04081/assets/x48.png)
![[Uncaptioned image]](/html/1507.04081/assets/x49.png)
![[Uncaptioned image]](/html/1507.04081/assets/x50.png)
![[Uncaptioned image]](/html/1507.04081/assets/x51.png)
![[Uncaptioned image]](/html/1507.04081/assets/x52.png)
![[Uncaptioned image]](/html/1507.04081/assets/x53.png)
![[Uncaptioned image]](/html/1507.04081/assets/x54.png)
![[Uncaptioned image]](/html/1507.04081/assets/x55.png)
![[Uncaptioned image]](/html/1507.04081/assets/x56.png)
![[Uncaptioned image]](/html/1507.04081/assets/x60.png)
![[Uncaptioned image]](/html/1507.04081/assets/x61.png)
![[Uncaptioned image]](/html/1507.04081/assets/x62.png)
![[Uncaptioned image]](/html/1507.04081/assets/x63.png)
![[Uncaptioned image]](/html/1507.04081/assets/x64.png)
![[Uncaptioned image]](/html/1507.04081/assets/x65.png)
![[Uncaptioned image]](/html/1507.04081/assets/x66.png)
![[Uncaptioned image]](/html/1507.04081/assets/x67.png)
![[Uncaptioned image]](/html/1507.04081/assets/x68.png)
![[Uncaptioned image]](/html/1507.04081/assets/x69.png)
![[Uncaptioned image]](/html/1507.04081/assets/x70.png)
![[Uncaptioned image]](/html/1507.04081/assets/x71.png)
![[Uncaptioned image]](/html/1507.04081/assets/x72.png)
![[Uncaptioned image]](/html/1507.04081/assets/x73.png)
![[Uncaptioned image]](/html/1507.04081/assets/x74.png)
![[Uncaptioned image]](/html/1507.04081/assets/x78.png)
![[Uncaptioned image]](/html/1507.04081/assets/x79.png)
![[Uncaptioned image]](/html/1507.04081/assets/x80.png)
![[Uncaptioned image]](/html/1507.04081/assets/x81.png)
![[Uncaptioned image]](/html/1507.04081/assets/x82.png)
![[Uncaptioned image]](/html/1507.04081/assets/x83.png)
![[Uncaptioned image]](/html/1507.04081/assets/x84.png)
![[Uncaptioned image]](/html/1507.04081/assets/x85.png)
![[Uncaptioned image]](/html/1507.04081/assets/x86.png)
![[Uncaptioned image]](/html/1507.04081/assets/x87.png)
![[Uncaptioned image]](/html/1507.04081/assets/x88.png)
![[Uncaptioned image]](/html/1507.04081/assets/x89.png)
![[Uncaptioned image]](/html/1507.04081/assets/x90.png)
![[Uncaptioned image]](/html/1507.04081/assets/x91.png)
![[Uncaptioned image]](/html/1507.04081/assets/x92.png)
![[Uncaptioned image]](/html/1507.04081/assets/x105.png)
![[Uncaptioned image]](/html/1507.04081/assets/x106.png)
![[Uncaptioned image]](/html/1507.04081/assets/x107.png)
![[Uncaptioned image]](/html/1507.04081/assets/x108.png)
![[Uncaptioned image]](/html/1507.04081/assets/x109.png)
![[Uncaptioned image]](/html/1507.04081/assets/x110.png)
![[Uncaptioned image]](/html/1507.04081/assets/x111.png)
![[Uncaptioned image]](/html/1507.04081/assets/x112.png)
![[Uncaptioned image]](/html/1507.04081/assets/x113.png)
![[Uncaptioned image]](/html/1507.04081/assets/x114.png)
![[Uncaptioned image]](/html/1507.04081/assets/x115.png)
![[Uncaptioned image]](/html/1507.04081/assets/x116.png)
![[Uncaptioned image]](/html/1507.04081/assets/x117.png)
![[Uncaptioned image]](/html/1507.04081/assets/x118.png)
![[Uncaptioned image]](/html/1507.04081/assets/x119.png)
![[Uncaptioned image]](/html/1507.04081/assets/x123.png)
![[Uncaptioned image]](/html/1507.04081/assets/x124.png)
![[Uncaptioned image]](/html/1507.04081/assets/x125.png)
![[Uncaptioned image]](/html/1507.04081/assets/x126.png)
![[Uncaptioned image]](/html/1507.04081/assets/x128.png)
![[Uncaptioned image]](/html/1507.04081/assets/x129.png)
![[Uncaptioned image]](/html/1507.04081/assets/x130.png)
![[Uncaptioned image]](/html/1507.04081/assets/x131.png)
![[Uncaptioned image]](/html/1507.04081/assets/x132.png)
![[Uncaptioned image]](/html/1507.04081/assets/x133.png)
![[Uncaptioned image]](/html/1507.04081/assets/x134.png)
![[Uncaptioned image]](/html/1507.04081/assets/x135.png)
![[Uncaptioned image]](/html/1507.04081/assets/x136.png)
![[Uncaptioned image]](/html/1507.04081/assets/x137.png)
| Time from T0 | Models | Base Component | Additional Components | Cstat/dof | ||||
| CPL or Band | BB | PL | ||||||
| Tstart | Tstop | Parameters | Epeak | kT | ||||
| (s) | (s) | (keV) | (keV) | |||||
| -4.096 | +8.192 | Band | 45662 | -0.760.09 | -2.841.04 | – | – | 20.7/9 |
| CnTh+CTh | 669224 | -1.020.21 | – | 5813 | – | 18.7/8 | ||
| CnTh+CTh+PL | 48869 | -0.7 (fix) | – | 5210 | -1.5 (fix) | 19.0/8 | ||
| +8.192 | +12.288 | Band | 42229 | -0.550.05 | -1.930.06 | – | – | 16.0/9 |
| CnTh+CTh | 1391272 | -1.080.06 | – | 624 | – | 5.5/8 | ||
| CnTh+CTh+PL | 929102 | -0.7 (fix) | – | 593 | -1.5 (fix) | 5.7/8 | ||
| +12.288 | +16.384 | Band | 41118 | -0.530.04 | -2.070.05 | – | – | 15.6/9 |
| CnTh+CTh | 1212161 | -1.090.05 | – | 642 | – | 14.6/8 | ||
| CnTh+CTh+PL | 75548 | -0.7 (fix) | – | 612 | -1.5 (fix) | 13.8/8 | ||
| +16.384 | +22.528 | Band | 3648 | -0.560.02 | -2.350.05 | – | – | 50.6/9 |
| CnTh+CTh | 78352 | -1.100.04 | – | 601 | – | 17.6/8 | ||
| CnTh+CTh+PL | 47713 | -0.7 (fix) | – | 582 | -1.5 (fix) | 14.9/8 | ||
| +22.528 | +24.576 | Band | 31814 | -0.490.05 | -2.410.10 | – | – | 26.5/9 |
| CnTh+CTh | 722113 | -1.160.08 | – | 572 | – | 10.9/8 | ||
| CnTh+CTh+PL | 41226 | -0.7 (fix) | – | 554 | -1.5 (fix) | 15.5/8 | ||
| +24.576 | +26.624 | Band | 41218 | -0.500.04 | -2.430.10 | – | – | 21.4/9 |
| CnTh+CTh | 930145 | -1.120.07 | – | 712 | – | 6.4/8 | ||
| CnTh+CTh+PL | 54734 | -0.7 (fix) | – | 703 | -1.5 (fix) | 5.8/8 | ||
| +26.624 | +28.672 | Band | 35015 | -0.440.04 | -2.500.11 | – | – | 39.1/9 |
| CnTh+CTh | 859161 | -1.180.08 | – | 642 | – | 12.1/8 | ||
| CnTh+CTh+PL | 46334 | -0.7 (fix) | – | 623 | -1.5 (fix) | 15.6/8 | ||
| +28.672 | +30.720 | Band | 3309 | -0.420.03 | -2.430.07 | – | – | 40.6/9 |
| CnTh+CTh | 77278 | -1.110.05 | – | 592 | – | 17.7/8 | ||
| CnTh+CTh+PL | 46921 | -0.7 (fix) | – | 582 | -1.5 (fix) | 13.6/8 | ||
| +30.720 | +32.768 | Band | 32514 | -0.460.05 | -2.380.09 | – | – | 21.4/9 |
| CnTh+CTh | 832142 | -1.170.08 | – | 582 | – | 8.7/8 | ||
| CnTh+CTh+PL | 44732 | -0.7 (fix) | – | 573 | -1.5 (fix) | 6.7/8 | ||
| +32.768 | +36.864 | Band | 2809 | -0.680.03 | -2.490.08 | – | – | 26.0/9 |
| CnTh+CTh | 61476 | -1.310.06 | – | 512 | – | 11.8/8 | ||
| CnTh+CTh+PL | 27915 | -0.7 (fix) | – | 535 | -1.5 (fix) | 11.7/8 | ||
| +36.864 | +43.008 | Band | 1939 | -0.960.06 | -2.480.11 | – | – | 19.9/9 |
| CnTh+CTh | 537177 | -1.690.08 | – | 412 | – | 11.3/8 | ||
| CnTh+CTh+PL | 9920 | -0.7 (fix) | – | 616 | -1.5 (fix) | 7.7/8 | ||
| +43.008 | +45.056 | Band | 17435 | -1.180.20 | -2.340.32 | – | – | 8.4/9 |
| CnTh+CTh | 51243000 | -1.880.17 | – | 395 | – | 8.2/8 | ||
| CnTh+CTh+PL | 5323 | -0.7 (fix) | – | 489 | -1.5 (fix) | 5.2/8 | ||
| +45.056 | +49.152 | Band | 27418 | -0.850.06 | -2.550.21 | – | – | 16.3/9 |
| CnTh+CTh | 485101 | -1.330.12 | – | 483 | – | 8.7/8 | ||
| CnTh+CTh+PL | 25318 | -0.7 (fix) | – | 454 | -1.5 (fix) | 7.8/8 | ||
| +49.152 | +53.248 | Band | 17624 | -1.210.14 | -2.380.25 | – | – | 25.0/9 |
| CnTh+CTh | 76795000 | -1.950.14 | – | 423 | – | 14.5/8 | ||
| CnTh+CTh+PL | 317 | -0.7 (fix) | – | 403 | -1.5 (fix) | 11.6/8 | ||
| +53.248 | +55.296 | Band | 22412 | -0.960.07 | -5 | – | – | 13.5/9 |
| CnTh+CTh | 21549 | -1.480.26 | – | 536 | – | 8.0/8 | ||
| CnTh+CTh+PL | 7818 | -0.7 (fix) | – | 647 | -1.5 (fix) | 7.8/8 | ||
| +55.296 | +61.440 | Band | 18716 | -1.060.09 | -2.510.23 | – | – | 17.6/9 |
| CnTh+CTh | 818500 | -1.810.12 | – | 403 | – | 12.7/8 | ||
| CnTh+CTh+PL | 6719 | -0.7 (fix) | – | 526 | -1.5 (fix) | 12.3/8 | ||
| +61.440 | +63.488 | Band | 31017 | -0.760.06 | -5 | – | – | 12.7/9 |
| CnTh+CTh | 41095 | -1.140.21 | – | 536 | – | 8.2/8 | ||
| CnTh+CTh+PL | 29726 | -0.7 (fix) | – | 4710 | -1.5 (fix) | 6.9/8 | ||
| +63.488 | +65.536 | Band | 12429 | -0.970.49 | -2.500.52 | – | – | 11.2/9 |
| CnTh+CTh | 717600 | -2.260.30 | – | 355 | – | 3.7/8 | ||
| CnTh+CTh+PL | 18 | -0.7 (fix) | – | 304 | -1.5 (fix) | 5.0/8 | ||
| +65.536 | +67.584 | Band | 30613 | -0.530.05 | -3.000.30 | – | – | 20.4/9 |
| CnTh+CTh | 45163 | -1.060.13 | – | 573 | – | 13.2/8 | ||
| CnTh+CTh+PL | 33224 | -0.7 (fix) | – | 587 | -1.5 (fix) | 13.0/8 | ||
| +67.584 | +71.680 | Band | 27612 | -0.680.05 | -2.720.20 | – | – | 15.2/9 |
| CnTh+CTh | 46173 | -1.250.11 | – | 523 | – | 6.5/8 | ||
| CnTh+CTh+PL | 26922 | -0.7 (fix) | – | 5510 | -1.5 (fix) | 6.4/8 | ||
| +71.680 | +77.824 | Band | 1778 | -1.130.07 | -5 | – | – | 7.3/9 |
| CnTh+CTh | 1778 | -1.130.07 | – | 102 | – | 6.0/8 | ||
| CnTh+CTh+PL | 9015 | -0.7 (fix) | – | 7011 | -1.5 (fix) | 7.3/8 | ||
| +77.824 | +83.968 | Band | 1377 | -1.240.09 | -5 | – | – | 7.3/9 |
| CnTh+CTh | 1377 | -1.240.09 | – | 102 | – | 6.1/8 | ||
| CnTh+CTh+PL | 9820 | -0.7 (fix) | – | 6415 | -1.5 (fix) | 5.4/8 | ||
| +83.968 | +86.016 | Band | 17513 | -0.840.12 | -2.920.46 | – | – | 6.2/9 |
| CnTh+CTh | 23365 | -1.540.29 | – | 404 | – | 5.2/8 | ||
| CnTh+CTh+PL | 7631 | -0.7 (fix) | – | 538 | -1.5 (fix) | 4.1/8 | ||
| +86.016 | +88.064 | Band | 11913 | -0.810.30 | -2.720.40 | – | – | 5.0/9 |
| CnTh+CTh | 1309 | -1.010.18 | – | 102 | – | 4.5/8 | ||
| CnTh+CTh+PL | 10433 | -0.7 (fix) | – | 7915 | -1.5 (fix) | 5.0/8 | ||
| +88.064 | +110.590 | Band | 4642 | -1.86 | -5 | – | – | 16.5/9 |
| CnTh+CTh | 165 | -1.830.06 | – | 5117 | – | 13.0/8 | ||
| CnTh+CTh+PL | 3210 | -0.7 (fix) | – | 4315 | -1.5 (fix) | 11.9/8 | ||
| +110.590 | +114.690 | Band | 11623 | -1.120.37 | -2.370.27 | – | – | 13.7/9 |
| CnTh+CTh | 13715 | -1.360.17 | – | 102 | – | 12.0/8 | ||
| CnTh+CTh+PL | 4215 | -0.7 (fix) | – | 3610 | -1.5 (fix) | 11.2/8 | ||
| +114.690 | +200.700 | Band | 9122 | -0.800.89 | -2.360.27 | – | – | 7.2/9 |
| CnTh+CTh | 10913 | -1.270.30 | – | 102 | – | 6.5/8 | ||
| CnTh+CTh+PL | 10913 | -1.270.30 | – | 102 | – | 6.5/8 |
| Time from T0 | Models | Base Component | Additional Components | Cstat/dof | ||||
| CPL or Band | BB | PL | ||||||
| Tstart | Tstop | Parameters | Epeak | kT | ||||
| (s) | (s) | (keV) | (keV) | |||||
| -2.034 | -0.256 | Band | 715403 | -0.470.49 | -5 | – | – | 13.0/9 |
| CnTh+CTh | 903369 | -0.7 (fix) | – | 202 | – | 12.0/9 | ||
| CnTh+CTh+PL | – | – | – | 11834 | -1.5 (fix) | 12.6/10 | ||
| -0.256 | +1.792 | Band | 26312 | +1.090.17 | -2.870.26 | – | – | 7.6/9 |
| CnTh+CTh | 1019391 | -0.7 (fix) | – | 652 | – | 7.7/9 | ||
| CnTh+CTh+PL | – | – | – | 672 | -1.5 (fix) | 12.6/10 | ||
| +1.792 | +3.840 | Band | 2015 | +1.360.16 | -3.940.61 | – | – | 11.3/9 |
| CnTh+CTh | 2565400 | -0.7 (fix) | – | 511 | – | 9.8/9 | ||
| CnTh+CTh+PL | – | – | – | 511 | -1.5 (fix) | 12.7/10 | ||
| +3.840 | +5.888 | Band | 1774 | +1.200.14 | -3.520.30 | – | – | 11.4/9 |
| CnTh+CTh | 540237 | -0.190.92 | – | 432 | – | 10.4/8 | ||
| CnTh+CTh+PL | 635269 | -0.7 (fix) | – | 441 | – | 11.1/9 | ||
| +5.888 | +7.936 | Band | 2133 | +0.470.06 | -5.221.68 | – | – | 2.5/9 |
| CnTh+CTh | 22823 | +0.080.43 | – | 494 | – | 2.5/8 | ||
| CnTh+CTh+PL | 27726 | -0.7 (fix) | – | 501 | – | 6.3/9 | ||
| +7.936 | +9.984 | Band | 2063 | +0.150.05 | -5 | – | – | 12.7/9 |
| CnTh+CTh | 21515 | -0.220.30 | – | 484 | – | 10.9/8 | ||
| CnTh+CTh+PL | 23616 | -0.7 (fix) | – | 482 | – | 14.0/9 | ||
| +9.984 | +12.032 | Band | 1542 | -0.290.06 | -5 | – | – | 14.5/9 |
| CnTh+CTh | 1539 | -0.640.32 | – | 394 | – | 13.2/8 | ||
| CnTh+CTh+PL | 1539 | -0.7 (fix) | – | 393 | – | 13.2/9 | ||
| +12.032 | +14.080 | Band | 1343 | -0.590.08 | -3.750.53 | – | – | 12.5/9 |
| CnTh+CTh | 13111 | -1.180.31 | – | 363 | – | 10.8/8 | ||
| CnTh+CTh+PL | 11723 | -0.7 (fix) | – | 458 | -1.5 (fix) | 10.8/8 | ||
| +14.080 | +16.128 | Band | 1512 | -0.450.05 | -5 | – | – | 14.3/9 |
| CnTh+CTh | 1508 | -0.950.24 | – | 382 | – | 9.2/8 | ||
| CnTh+CTh+PL | 1509 | -0.7 (fix) | – | 395 | -1.5 (fix) | 10.6/8 | ||
| +16.128 | +18.176 | Band | 1772 | -0.410.03 | -5 | – | – | 13.2/9 |
| CnTh+CTh | 1669 | -0.680.16 | – | 506 | – | 4.9/8 | ||
| CnTh+CTh+PL | 1669 | -0.7 (fix) | – | 494 | – | 4.9/8 | ||
| +18.176 | +20.224 | Band | 1592 | -0.580.04 | -5 | – | – | 15.8/9 |
| CnTh+CTh | 1449 | -0.950.18 | – | 464 | – | 5.1/8 | ||
| CnTh+CTh+PL | 12321 | -0.7 (fix) | – | 552 | -1.5 (fix) | 6.4/8 | ||
| +20.224 | +22.272 | Band | 1001 | -0.770.05 | -5 | – | – | 10.3/9 |
| CnTh+CTh | 10017 | -0.770.20 | – | 4510 | – | 10.4/8 | ||
| CnTh+CTh+PL | 7712 | -0.7 (fix) | – | 444 | -1.5 (fix) | 7.6/8 | ||
| +22.272 | +24.320 | Band | 852 | -0.830.09 | -5 | – | – | 13.8/9 |
| CnTh+CTh | 6745 | -0.750.83 | – | 416 | – | 12.7/8 | ||
| CnTh+CTh+PL | 6315 | -0.7 (fix) | – | 396 | -1.5 (fix) | 11.8/8 | ||
| +24.320 | +26.368 | Band | 722 | -0.900.13 | -3.930.54 | – | – | 16.8/9 |
| CnTh+CTh | 6714 | -1.060.54 | – | 2815 | – | 19.1/8 | ||
| CnTh+CTh+PL | 3910 | -0.7 (fix) | – | 303 | -1.5 (fix) | 15.8/8 | ||
| +26.368 | +30.464 | Band | 493 | -0.900.17 | -5 | – | – | 9.1/9 |
| CnTh+CTh | 4630 | -0.791.00 | – | 3118 | – | 9.0/8 | ||
| CnTh+CTh+PL | 4510 | -0.7 (fix) | – | 3010 | – | 9.0/9 | ||
| +30.464 | +36.608 | Band | 652 | -1.160.09 | -4.140.81 | – | – | 6.8/9 |
| CnTh+CTh | 6210 | -1.210.32 | – | 3212 | – | 7.0/8 | ||
| CnTh+CTh+PL | 426 | -0.7 (fix) | – | 333 | -1.5 (fix) | 6.2/8 | ||
| +36.608 | +40.704 | Band | 3012 | -1.560.29 | -4.041.35 | – | – | 12.2/9 |
| CnTh+CTh | 2817 | -0.730.80 | – | 268 | – | 12.4/8 | ||
| CnTh+CTh+PL | 238 | -0.7 (fix) | – | 223 | -1.5 (fix) | 7.0/8 | ||
| +40.704 | +46.848 | Band | 2423 | -0.920.80 | -5 | – | – | 23.1/9 |
| CnTh+CTh | 2420 | -0.920.80 | – | 268 | – | 20.0/8 | ||
| CnTh+CTh+PL | 263 | -0.7 (fix) | – | – | – | 21.8/8 | ||
| Time from T0 | Models | Base Component | Additional Components | Cstat/dof | ||||
| CPL or Band | BB | PL | ||||||
| Tstart | Tstop | Parameters | Epeak | kT | ||||
| (s) | (s) | (keV) | (keV) | |||||
| -2.048 | +16.384 | Band | 1645 | -0.300.11 | -5 | – | – | 3.7/9 |
| CnTh+CTh | 17735 | -0.980.60 | – | 39 | – | 2.2/8 | ||
| CnTh+CTh+PL | 632 | -0.7 (fix) | – | 44.8 | -1.5 (fix) | 2.2/8 | ||
| +16.384 | +20.480 | Band | 37525 | -0.600.06 | -2.600.27 | – | – | 18.0/9 |
| CnTh+CTh | 645142 | -1.090.14 | – | 635 | – | 11.3/8 | ||
| CnTh+CTh+PL | 577392 | -0.7 (fix) | – | 605 | -1.5 (fix) | 12.9/8 | ||
| +20.480 | +22.528 | Band | 78330 | -0.540.02 | -2.920.39 | – | – | 67.6/9 |
| CnTh+CTh | 105985 | -0.780.05 | – | 106 | – | 49.2/8 | ||
| CnTh+CTh+PL | 99438 | -0.7 (fix) | – | 1035 | -1.5 (fix) | 49.0/8 | ||
| +22.528 | +24.576 | Band | 84142 | -0.500.03 | -2.760.40 | – | – | 38.8/9 |
| CnTh+CTh | 1101104 | -0.700.07 | – | 1088 | – | 31.6/8 | ||
| CnTh+CTh+PL | 111555 | -0.7 (fix) | – | 1078 | -1.5 (fix) | 31.6/8 | ||
| +24.576 | +26.624 | Band | 94435 | -0.480.02 | -2.170.09 | – | – | 91.6/9 |
| CnTh+CTh | 2053231 | -0.840.04 | – | 1153 | – | 31.1/8 | ||
| CnTh+CTh+PL | 1789106 | -0.7 (fix) | – | 1093 | -1.5 (fix) | 25.2/8 | ||
| +26.624 | +28.672 | Band | 78336 | -0.430.03 | -2.180.10 | – | – | 54.5/9 |
| CnTh+CTh | 1756267 | -0.860.06 | – | 1054 | – | 24.6/8 | ||
| CnTh+CTh+PL | 1516123 | -0.7 (fix) | – | 1003 | -1.5 (fix) | 22.3/8 | ||
| +28.672 | +32.768 | Band | 45612 | -0.410.03 | -3.310.32 | – | – | 46.8/9 |
| CnTh+CTh | 64954 | -0.890.07 | – | 802 | – | 15.4/8 | ||
| CnTh+CTh+PL | 55021 | -0.7 (fix) | – | 803 | -1.5 (fix) | 16.4/8 | ||
| +32.768 | +34.816 | Band | 30811 | -0.520.05 | -5 | – | – | 6.3/9 |
| CnTh+CTh | 34244 | -0.780.21 | – | 598 | – | 4.7/8 | ||
| CnTh+CTh+PL | 33123 | -0.7 (fix) | – | 5911 | – | 4.9/8 | ||
| +34.816 | +36.864 | Band | 45717 | -0.370.04 | -2.780.18 | – | – | 19.8/9 |
| CnTh+CTh | 68767 | -0.800.09 | – | 764 | – | 14.1/8 | ||
| CnTh+CTh+PL | 63227 | -0.7 (fix) | – | 764 | -1.5 (fix) | 13.8/8 | ||
| +36.864 | +38.912 | Band | 68221 | -0.480.02 | -2.380.09 | – | – | 54.8/9 |
| CnTh+CTh | 111981 | -0.800.04 | – | 924 | – | 33.8/8 | ||
| CnTh+CTh+PL | 103439 | -0.7 (fix) | – | 893 | -1.5 (fix) | 32.3/8 | ||
| +38.912 | +40.960 | Band | 65229 | -0.540.03 | -2.530.18 | – | – | 27.7/9 |
| CnTh+CTh | 94186 | -0.790.06 | – | 866 | – | 21.1/8 | ||
| CnTh+CTh+PL | 677171 | -0.7 (fix) | – | 6723 | -1.5 (fix) | 20.8/8 | ||
| +40.960 | +43.008 | Band | 63531 | -0.660.03 | -3.120.62 | – | – | 59.9/9 |
| CnTh+CTh | 81083 | -0.890.08 | – | 887 | – | 41.6/8 | ||
| CnTh+CTh+PL | 74047 | -0.7 (fix) | – | 845 | -1.5 (fix) | 30.9/8 | ||
| +43.008 | +49.152 | Band | 40215 | -0.980.02 | -3.731.25 | – | – | 32.7/9 |
| CnTh+CTh | 46839 | -1.250.06 | – | 714 | – | 13.3/8 | ||
| CnTh+CTh+PL | 14515 | -0.7 (fix) | – | 1016 | -1.5 (fix) | 30.6/8 | ||
| +49.152 | +61.440 | Band | 39914 | -1.170.02 | -5 | – | – | 57.6/9 |
| CnTh+CTh | 37336 | -1.430.05 | – | 815 | – | 11.3/8 | ||
| CnTh+CTh+PL | 865 | -0.7 (fix) | – | 873 | -1.5 (fix) | 42.2/8 | ||
| +61.440 | +71.680 | Band | 30813 | -1.240.03 | -5 | – | – | 24.0/9 |
| CnTh+CTh | 29536 | -1.500.08 | – | 665 | – | 5.5/8 | ||
| CnTh+CTh+PL | 745 | -0.7 (fix) | – | 743 | -1.5 (fix) | 28.6/8 | ||
| +71.680 | +81.920 | Band | 2867 | -1.020.03 | -5 | – | – | 36.9/9 |
| CnTh+CTh | 29926 | -1.380.08 | – | 603 | – | 10.0/8 | ||
| CnTh+CTh+PL | 140 | -0.7 (fix) | – | 7910 | -1.5 (fix) | 10.2/8 | ||
| +81.920 | +88.064 | Band | 48255 | -1.200.04 | -2.710.70 | – | – | 22.8/9 |
| CnTh+CTh | 997500 | -1.590.09 | – | 715 | – | 6.4/8 | ||
| CnTh+CTh+PL | 6910 | -0.7 (fix) | – | 765 | -1.5 (fix) | 12.0/8 | ||
| +88.064 | +102.400 | Band | 11015 | -1.740.11 | -5 | – | – | 15.1/9 |
| CnTh+CTh | 11015 | -1.740.11 | – | 501 | – | 13.5/8 | ||
| CnTh+CTh+PL | 101 | -0.7 (fix) | – | 6620 | -1.5 (fix) | 12.0/8 | ||