Prompt Emission of GRB100418AImatani et al.
gamma rays: bursts — gamma rays: observations — gamma-ray burst: individual(GRB 100418A)
Soft X-ray Observation of the Prompt Emission of GRB 100418A
Abstract
We have observed the prompt emission of GRB 100418A from its beginning by the MAXI/SSC (0.7-7 keV) on board the International Space Station followed by the Swift/XRT (0.3-10 keV) observation. The light curve can be fitted by a combination of a power law component and an exponential component (decay constant is sec). The X-ray spectrum is well expressed by the Band function with 8.3 keV. This is the brightest GRB showing a very low value of . It satisfies the Yonetoku-relation (-). It is also consistent with the Amati relation (-) in 2.5 level.
1 Introduction
The observation of gamma-ray bursts (GRBs) with a very soft spectrum, so called X-ray flashes (XRFs), provides a unique information for understanding the nature of GRBs. The bright GRBs observed by Ginga have values of around a few keV (Strohmayer et al., 1998), where is a photon peak energy in the spectral form of Fν at the rest frame. XRFs are observed both by BeppoSAX (Heise & in’t Zand, 2004) and by HETE-2 (Sakamoto et al., 2005). About one-third of GRBs observed by HETE-2 are classified as XRFs. Various theoretical models have been proposed for XRFs. They include the external shock emission from low bulk Lorentz factor shells (e.g., Dermer et al. (1999)), the off-axis jet viewing scenarios (e.g., Yamazaki et al. (2002)), the X-ray emission from the hot cocoon of the GRB jets (e.g., Mészáros et al. (2002)), the very high redshift GRBs (Heise & in’t Zand (2004)), the inhomogeneous jet model (e.g., Toma et al. (2005)) and the internal shock emission from the high bulk Lorentz factor shells (e.g., Barraud et al. (2005)). After the launch of Swift (Gehrels et al. (2004)), the observations of GRBs have been dramatically improved thanks to its rapid and accurate position information. However, due to a relatively high energy threshold (around 15 keV) of the Burst Alert Telescope (BAT; Barthelmy et al. (2005)) on-board Swift, a very small number of XRFs are observed by Swift (Sakamoto et al., 2008). Furthermore, it is difficult to constrain of XRFs based on the BAT data alone. The observation of the prompt emission in X-ray is definitely needed to provide a crucial spectral information of XRFs.
Swift X-Ray Telescope (XRT; Burrows et al. (2005)) has detected the X-ray emission of the early phase of the Swift GRBs (e.g., Nousek et al. (2006); Zhang et al. (2006)). Some of the GRBs show steep decay components in the X-ray light curve (LC). The origin of this steep decay component is believed to be a result of the delayed prompt emission from different viewing latitudes of the jet, so called a high latitude emission (e.g., Kumar & Panaitescu (2000)). O’Brien et al. (2006) studied the steep decay emission combining the BAT and the XRT LCs for 40 GRBs. They found that the LC could be well described by an exponential decay relaxing into a power-law. Willingale et al. (2010) modeled a pulse profile, a spectral evolution and a high latitude emission of the prompt emission. They found that the most of the steep decay component seen in the XRT could be described by the internal shock model. One of the difficulties in those studies is to generate the composite LC in the fixed energy band. They extrapolated the BAT data to the XRT energy band of 0.3-10 keV. Without knowing the spectral information in the X-ray band, the extrapolation may introduce a systematic error (see Sakamoto et al. (2007)). The prompt emission observation in X-ray will be an ideal tool to connect the early GRB X-ray emission seen by the XRT.
When the BAT detects a precursor of the GRB, the XRT can observe its main part from the beginning. Romano et al. (2006) performed the XRT observation of the main part of GRB 060124. They reported that was 636 keV (=2.297) with significant spectral evolution. This is a very rare case that the XRT observation is carried out from its beginning of the main part.
GRB 100418A detected by the BAT belongs to a long GRB that is believed to be the death of massive stars based on the associations with supernovae (SN). The XRT started the observation 71 sec after the BAT trigger time (Marshall et al., 2011). The optical afterglow was also detected by the Ultra Violet Optical Telescope (UVOT;Roming et al. (2005)) on-board Swift while it reached the maximum brightness several hours after the burst in spite that the typical GRBs reach the maximum tens of seconds after the burst (Panaitescu & Vestrand, 2008). A precise redshift z=0.6239 was determined by the follow-up observation (de Ugarte Postigo et al., 2011) showing that it was relatively a nearby source as the GRB. This was also detected by the pre-ALMA observation being the third brightest burst in the mm/submm range (de Ugarte Postigo et al., 2012). Niino et al. (2012) could not identify any SN feature using FOCAS on the Subaru telescope. The upper limit of the absolute magnitude was comparable to the faintest type Ic SN. Since GRB 100418A occurred in the field of view (FOV) of the MAXI SSC and stayed for about 50 sec, we observed its prompt emission prior to the XRT observation in the X-ray band (0.7-7 keV). In this paper, we report the prompt emission of GRB 100418A.
2 Observation
MAXI (Matsuoka et al., 2009) onboard the International Space Station is an all-sky X-ray monitor that consists of an array of gas proportional counters (GSC, Mihara et al. (2011)) covering the energy range of 2-40 keV and an array of X-ray CCD (SSC, Tsunemi et al. (2010); Tomida et al. (2011)) covering the energy range of 0.5-12 keV. GRB 100418A occurred when the MAXI was close to the high background region (latitude was in the South Pacific Ocean) where GSC was already turned off for safety.
The SSC consists of two identical cameras, SSC-H and SSC-Z, each has CCD array with different FOV, a horizontal view (SSC-H) and a zenith view (SSC-Z). The SSC scans the sky along a large circle of the ISS orbit in every 90 min. It has a fan beam FOV of (full width at half maximum, FWHM) where CCD functions as one-dimensional imager so that we can localize the source. We usually read out 16 CCDs at every 6 sec. Two CCDs detected GRB 100418A for an integration time of 6 sec with 3 sec time difference. The maximum on-source area of the SSC is 1.35 cm2.
MAXI/SSC monitors X-ray sources every day just as MAXI/GSC does. We are monitoring the Crab nebula for its point spread function (PSF) of which uncertainty is about 5%. The charged particles hitting on the copper-made collimator generate Cu-K lines (8.04 keV and 8.94 keV) on all the CCDs. They reduce the source detection efficiency at high energy that limits our effective energy range up to 7 keV. Calibration sources of 55Fe irradiate X-rays onto two CCDs out of 16. The Cygnus Loop is also a strong source below 2 keV (Kimura et al., 2013) that helps us to monitor the efficiency of CCD at low energy. Due to the thermal noise development, we find that the effective energy range is above 0.7 keV at the time of observation of GRB 100418A. In this way, we estimate the systematic uncertainty of the SSC spectral parameters for Crab-like source to be less than 10% (Kimura, 2012) . These systematic uncertainties are less than the statistical uncertainties for GRB 100418A.
The BAT trigger time of GRB 100418A was 2010/04/18, 21:10:08 (UT) that was 2 sec after the source got into the FOV of the SSC-Z. The source was in the FOV for about 50 sec. Due to the program timer of the MAXI, the SSC got into the idle mode (bias voltage of the CCD was set to zero) at 21:10:53, just before the source left the FOV.
3 Analysis and Results
3.1 Light curve (LC)
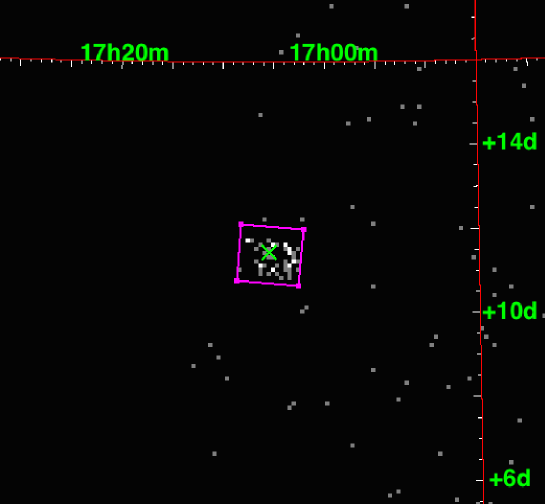
As the apparent peak intensity of the GRB 100418A was an order of magnitude higher than that of the Crab nebula, we collected 50 photons with background free. Figure 1 shows the X-ray image where 50 photons form PSF of the SSC-Z (). The cross in the figure shows the position of GRB 100418A, that is shifted about 0.3∘ from the center of gravity of photons. This is due to the fact that the source intensity rapidly varies during the SSC-Z observation. We select the energy range of 0.7-7 keV and remove hot/flickering pixels. We collect 135 photons in the region centered on GRB 100418A. Among them, 50 photons are in the SSC PSF. With taking into account the fact that the SSC is turned off after the GRB 100418A moved out of the PSF, the expected background count rate is 0.9 photons/PSF.
We correct the count rate by using the average collimator response for each 6 sec.
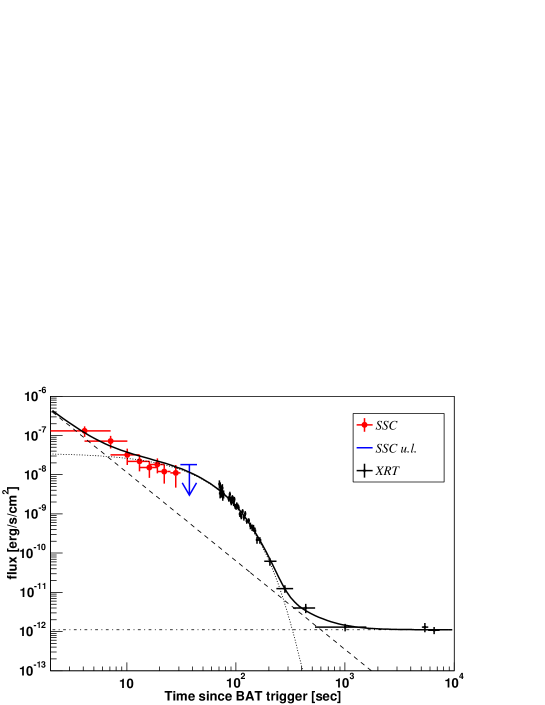
We extract all the Swift data of GRB 100418A from the web site (http://www.swift.ac.uk/burst_analyser/00419797/). Figure 2 shows the LC of GRB 100418A obtained both by the SSC (Time 50 sec) and by the XRT (71 sec Time). In this LC, we calculate the flux (0.7-7 keV) from the XRT data to fit the SSC energy range using the WebPIMMS ver.4.7d in HEASARC. We see that the LC does not follow a simple power law of time.
Instead, we employ an exponential with a constant, which gives us C-statistics value (C-stat) of 77.7
with 49 degrees of freedom (dof). We add a power law component, which gives us C-stat of 50.4 with 47 dof. The final model is given in the equation below,
where is the time after the BAT trigger, is a time constant, is a temporal index and , , are normalizations . The solid line in figure 2 is the best fit curve of which the parameters are given in table 1 where errors are given in 90% confidence based on the C-statistics.
| erg/cm2/sec | sec | |||
Errors (90% confidence) obtained with C-statistics
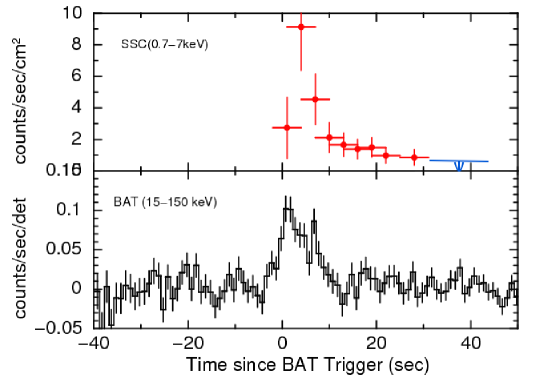
Figure 3 shows the GRB 100418A LC around the BAT trigger time. Data points of the SSC come from two CCD chips. Each integrates data for 6 sec with 3 sec difference in integration start time. The LC in the BAT energy band shows its maximum a little earlier than that of the SSC. This is consistent with the spectral lag usually seen in the prompt emission of GRBs (Norris et al., 1996). The BAT LC shows two peaks whereas the SSC LC does not, probably due to the low time resolution.
3.2 Spectrum
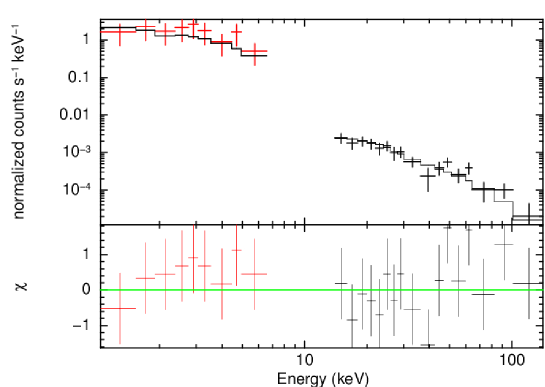
In the prompt emission of GRB 100418A, the BAT LC has a (the time interval containing 90% of the flux) value of sec (Marshall et al., 2011). Therefore, most of the photons arrive in the first 10 sec. We employ the HEAsoft version 6.16 and CALDB version v4.3.1 in the BAT data analysis. We collect SSC and BAT data for 18 sec, starting 2 sec before the BAT trigger time. The time span is selected by the SSC read-out time. Figure 4 shows the spectrum of GRB 100418A, where SSC data are red crosses and BAT data are black crosses. The spectrum of the BAT (15-150 keV) can be fitted with a single power law of photon index (Marshall et al., 2011) that clearly indicates that lies below or near the low-energy threshold of the BAT. In our spectral fitting, we fix a cross-normalization factor between SSC and XRT to be unity. We also fix the absorption features to the values derived by the XRT : the Galactic absorption feature, (galactic), is fixed to the value of 4.8 cm-2 and the intrinsic (intrinsic) is fixed to the value of 3.3 cm-2(Marshall et al., 2011). The spectrum of the SSC can be fitted with a single power law with a photon index where C-stat is 4.02 with 7 dof. Then we combine these two spectra and fit them with a single power law model. We obtain that the best fit value of the photon index is 2.1 where C-stat is 19.1 with 24 dof in table 2. These results also indicate that the value of must be below the BAT energy range.
We fit the data by using the Band function (Band et al., 1993). The low energy (below ) photon index, , is typically while that of the high energy (above ), , is about (Kaneko et al., 2006). Since must be very low, we fix to be due to the insufficient data points while is left free. The solid line in the figure is the best fit curve. We also calculate the one-second peak luminosity, and the isotropic equivalent energy, in the 1 - keV energy range with the assumption of the cosmological parameters of , , km/sec/Mpc. The results are summarized in table 2 where the errors are 90% confidence level based on the C-statistics.
As we obtain the small value of the upper limit of , we check our fitting assumption. If we set = and , we find the upper limits of to be 7.6 keV and 9.2 keV where the most plausible values are 4-4.5 keV. Therefore, we expect that the small value of the upper limit of is very reliable.
Marshall et al. (2011) reported that they obtained a steep photon index () for the data between 84 sec and 174 sec after the BAT trigger time. This is in stark contrast to our result for the very prompt emission. We divide our data into two periods (the first 12 sec and the rest) so that each period contains a similar number of photons detected. Then we calculate the hardness ratio, R, (photon number ratio between the 0.7-4 keV band and the 4-7 keV band). We obtain R=4.22.1 (1) and R=1.00.4 (1) for two periods, suggesting a spectral softening. However, it is not clear from the statistical point of view. Therefore, we can say that the rapid softening should have occurred before the XRT observation.
Power law function
| (galactic)(fix) | (intrinsic)(fix) | z(fix) | SSC | SSC+BAT | ||
|---|---|---|---|---|---|---|
| H/cm2 | H/cm2 | C-stat/dof | C-stat/dof | |||
| 0.6239 | 1.30.6 | 4.02 / 7 | 19.1 / 24 | |||
Band function
| (fix) | C-stat/dof | ||||
| keV | erg | erg/sec | |||
| 8.3 keV | 16.6/23 |
(galactic), (intrinsic) and are the same to those in power law fit.
is the photon energy at the rest frame.
4 Discussion and summary
We have detected the prompt emission of GRB 100418A in the soft X-ray energy range (0.7-7 keV) before the XRT started the observation 71 sec after the BAT trigger time. Marshall et al. (2011) reported that the prompt emission of the LC of the XRT could be expressed by a power law of time with an index of . By adding the SSC data to the XRT data, we find that the prompt emission LC of GRB 100418A in soft X-ray is well fitted not by a power law but by a combination of a power law and an exponential decay. The exponential component dominates the emission between 7 sec and 300 sec after the BAT trigger time. Then the flat component becomes dominant.
The LC of the prompt emission of GRBs have been reported as being well described by an exponential decay (BAT LC) relaxing into a power law (XRT LC) (O’Brien et al. (2006)). Sakamoto et al. (2007) investigated the rapid decay phase of the prompt emission for various GRBs and confirmed that the prompt emission LC could be expressed by a combination of a power law with an exponential decay. However, in these analyses, the LC of the prompt emission in the XRT energy range must be extrapolated from the BAT LC. Our analysis of GRB 100418A combining the SSC and the XRT data confirms those previous claims without extrapolation of data points beyond the observed energy range.
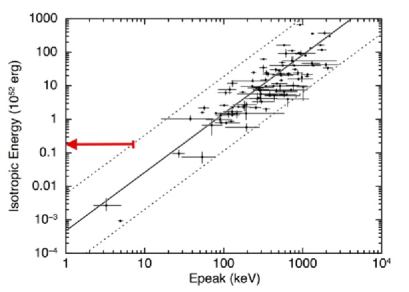
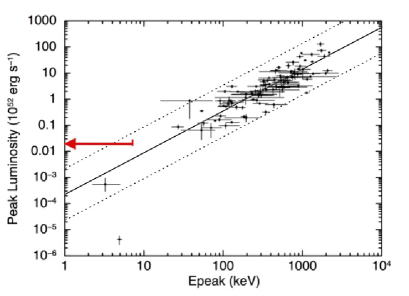
The values of of GRBs scatter in a wide energy range, from a few tens of keV to a few MeV (Yonetoku et al., 2010). Furthermore, there are two well known correlations: one is between and (Amati relation: Amati et al. (2002)) and the other is between and (Yonetoku relation: Yonetoku et al. (2004)). These are studied well for long GRBs. Recently, they are also applicable to the short GRBs (Zhang et al. (2012); Tsutsui et al. (2013)). There are very few GRBs reported that have 10 keV because it is very difficult to observe the prompt phase of GRB below 10 keV by using the Swift data alone.
We obtain a very low value of the upper limit of of GRB 100418A in table 2. We plot the results of GRB 100418A on the Amati-relation (-) and the Yonetoku-relation (-) in figure 5 where dotted lines indicate the 3 systematic error regions (Yonetoku et al., 2010). We notice that there are very few data points showing that is below 10keV. The upper limit point of the GRB 100418A satisfies the Yonetoku-relation. In the Amati-relation, it lies in the consistent level of 2.5 with taking into account the fact that we set the 90% upper limit and that the Amati-relation in figure 5 shows 3 systematic error region. These relations may not be applicable at low energy . It may be due to the fact that there are very few data points in 10 keV region. We need more data points whether or not these relations are really applicable at low energy region.
We find that the upper limit of of GRB 100418A is one of the lowest value actually obtained. Other than GRB 100418A( 8.3 keV), there are only two GRBs showing its 10 keV. They are XRF 020903 ( keV) and GRB 060218 ( keV). XRF 020903 is an extremely soft X-ray flash (Sakamoto et al., 2004). In fact, there is no photon above 10 keV. Since the data points of XRF 020903 satisfies both relations, they claim that the X-Ray Flash, the X-ray-rich GRB, belongs to the same class of classical GRBs. Campana et al. (2006) analyzed GRB 060218 classified as the Low Luminosity GRB (LL GRB) that was also unusual, showing a long of 2.1 ks. Its spectrum contained a thermal component as well as a power law component. They also argued that this burst was dominated by a shock breakout. The typical GRB emission is dominated by normal jet and afterglow components, therefore, LL GRB may show a different feature. It may be the reason that GRB 060218 satisfies the Amati-relation while it does not the Yonetoku-relation. On the other hand, GRB 100418A satisfies the Yonetoku-relation. It is also consistent with the Amati-relation in 2.5 level. Therefore, we need collect more samples to study the GRBs showing 10 keV region.
In summary, we have observed the prompt emission of GRB 100418A in the SSC energy range (0.7-7 keV) from the very beginning of the BAT trigger time. The LC is expressed not in a power law decay but in a combination of a power law and an exponential decay with a decay constant of sec. The X-ray spectrum shows 8.3 keV. It satisfies the Yonetoku-relation. It is also consistent with the Amati-relation in 2.5 level. GRB 100418A is a long GRB having a very low value of reported.
Acknowledgment
We thank all members of the MAXI operation and calibration teams. This work is supported by Japan Society for the Promotion of Science (JSPS) KAKENHI Grant Number 23000004, 24103002.
References
- Amati et al. (2002) Amati, L., Frontera, F., Tavani, M., et al. 2002, A&A, 390, 81
- Band et al. (1993) Band, D., Matteson, J., Ford, L., et al. 1993, ApJ, 413, 281
- Barraud et al. (2005) Barraud, C., Daigne, F., Mochkovitch, R., & Atteia, J. L. 2005, A&A, 440, 809
- Barthelmy et al. (2005) Barthelmy, S. D., Barbier, L. M., Cummings, J. R., et al. 2005, Space Sci. Rev., 120, 143
- Burrows et al. (2005) Burrows, D. N., Hill, J. E., Nousek, J. A., et al. 2005, Space Sci. Rev., 120, 165
- Campana et al. (2006) Campana, S., Mangano, V., Blustin, A. J., et al. 2006, Nature, 442, 1008
- de Ugarte Postigo et al. (2011) de Ugarte Postigo, A., Thöne, C. C., Goldoni, P., Fynbo, J. P. U., & X-shooter GRB Collaboration. 2011, Astronomische Nachrichten, 332, 297
- de Ugarte Postigo et al. (2012) de Ugarte Postigo, A., Lundgren, A., Martín, S., et al. 2012, A&A, 538, A44
- Dermer et al. (1999) Dermer, C. D., Chiang, J., & Böttcher, M. 1999, ApJ, 513, 656
- Gehrels et al. (2004) Gehrels, N., Chincarini, G., Giommi, P., et al. 2004, ApJ, 611, 1005
- Heise & in’t Zand (2004) Heise, J., & in’t Zand, J. 2004, Nuclear Physics B Proceedings Supplements, 132, 263
- Kaneko et al. (2006) Kaneko, Y., Preece, R. D., Briggs, M. S., et al. 2006, ApJS, 166, 298
- Kimura (2012) Kimura, M. 2012, PhD thesis, OSAKA UNIVERSITY.
- Kimura et al. (2013) Kimura, M., Tsunemi, H., Tomida, H., et al. 2013, PASJ, 65, 14
- Kumar & Panaitescu (2000) Kumar, P., & Panaitescu, A. 2000, ApJ, 541, L51
- Marshall et al. (2011) Marshall, F. E., Antonelli, L. A., Burrows, D. N., et al. 2011, ApJ, 727, 132
- Matsuoka et al. (2009) Matsuoka, M., Kawasaki, K., Ueno, S., et al. 2009, PASJ, 61, 999
- Mészáros et al. (2002) Mészáros, P., Ramirez-Ruiz, E., Rees, M. J., & Zhang, B. 2002, ApJ, 578, 812
- Mihara et al. (2011) Mihara, T., Nakajima, M., Sugizaki, M., et al. 2011, PASJ, 63, 623
- Niino et al. (2012) Niino, Y., Hashimoto, T., Aoki, K., et al. 2012, PASJ, 64, 115
- Norris et al. (1996) Norris, J. P., Nemiroff, R. J., Bonnell, J. T., et al. 1996, ApJ, 459, 393
- Nousek et al. (2006) Nousek, J. A., Kouveliotou, C., Grupe, D., et al. 2006, ApJ, 642, 389
- O’Brien et al. (2006) O’Brien, P. T., Willingale, R., Osborne, J., et al. 2006, ApJ, 647, 1213
- Panaitescu & Vestrand (2008) Panaitescu, A., & Vestrand, W. T. 2008, MNRAS, 387, 497
- Romano et al. (2006) Romano, P., Campana, S., Chincarini, G., et al. 2006, A&A, 456, 917
- Roming et al. (2005) Roming, P. W. A., Kennedy, T. E., Mason, K. O., et al. 2005, Space Sci. Rev., 120, 95
- Sakamoto et al. (2004) Sakamoto, T., Lamb, D. Q., Graziani, C., et al. 2004, ApJ, 602, 875
- Sakamoto et al. (2005) Sakamoto, T., Lamb, D. Q., Kawai, N., et al. 2005, ApJ, 629, 311
- Sakamoto et al. (2007) Sakamoto, T., Hill, J. E., Yamazaki, R., et al. 2007, ApJ, 669, 1115
- Sakamoto et al. (2008) Sakamoto, T., Hullinger, D., Sato, G., et al. 2008, ApJ, 679, 570
- Strohmayer et al. (1998) Strohmayer, T. E., Fenimore, E. E., Murakami, T., & Yoshida, A. 1998, ApJ, 500, 873
- Toma et al. (2005) Toma, K., Yamazaki, R., & Nakamura, T. 2005, ApJ, 635, 481
- Tomida et al. (2011) Tomida, H., Tsunemi, H., Kimura, M., et al. 2011, PASJ, 63, 397
- Tsunemi et al. (2010) Tsunemi, H., Tomida, H., Katayama, H., et al. 2010, PASJ, 62, 1371
- Tsutsui et al. (2013) Tsutsui, R., Yonetoku, D., Nakamura, T., Takahashi, K., & Morihara, Y. 2013, MNRAS, 431, 1398
- Willingale et al. (2010) Willingale, R., Genet, F., Granot, J., & O’Brien, P. T. 2010, MNRAS, 403, 1296
- Yamazaki et al. (2002) Yamazaki, R., Ioka, K., & Nakamura, T. 2002, ApJ, 571, L31
- Yonetoku et al. (2004) Yonetoku, D., Murakami, T., Nakamura, T., et al. 2004, ApJ, 609, 935
- Yonetoku et al. (2010) Yonetoku, D., Murakami, T., Tsutsui, R., et al. 2010, PASJ, 62, 1495
- Zhang et al. (2006) Zhang, B., Fan, Y. Z., Dyks, J., et al. 2006, ApJ, 642, 354
- Zhang et al. (2012) Zhang, F.-W., Shao, L., Yan, J.-Z., & Wei, D.-M. 2012, ApJ, 750, 88