11email: t.yamazaki@rs.tus.ac.jp
Non-equilibrium behavior of the magnetization
in the helimagnetic phases of the rare earth alloys Yx ( Gd, Tb, Dy)
Abstract
We have performed DC and AC magnetization measurements for the rare-earth magnetic alloy systems Gd0.62Y0.38, Tb0.86Y0.14, and Dy0.97Y0.03. These materials commonly exhibit a proper helical magnetic structure, and a ferromagnetic structure at lower temperatures. In all of these materials, a difference between zero-field-cooled (ZFC) magnetization and field-cooled (FC) magnetization and a hysteresis loop in the - curve have been observed in the helimagnetic phases. The non-equilibrium behavior is possibly caused by a common nature, e. g., chiral domain structures. In addition to the above behavior, strong non-linearity of the magnetization and slow spin dynamics have been observed around the Néel temperature only in Gd0.62Y0.38. The spin-glass like behavior observed in Gd0.62Y0.38 could be related to a novel glassy state such as a helical-glass state.
keywords:
halimagnetic structure, non-equilibrium, rare-earth alloy0.1 Introduction
The magnetic alloy system Gd1-xYx shows a para-helimagnetic phase transition at a Néel temperature, and a heli-ferromagnetic phase transition at a Curie temperature, in the Y-concentration range of [1]. In the helimagnetic phase, a proper helical magnetic structure is realized. (i.e., The propagation vector is parallel to the -axis and the spin direction is perpendicular to the -axis.) In our previous study, we measured the AC magnetization of Gd0.62Y0.38, and observed the following two kinds of non-equilibrium behavior in the helimagnetic phase, in spite of the helimagnetic order being a long-range antiferromagnetic order [2]: One is an enhancement of the imaginary part of the AC susceptibility over the whole helimagnetic temperature range and also for temperatures slightly above and below . The enhancement becomes more remarkable with decreasing measurement frequency between 0.01 and 10 Hz over the helimagnetic temperature range, strongly suggestive of anomalous slow dynamics occurring [2]. The other is strong non-linearity of the magnetization around . This non-linearity was more clearly observed when the measurement was performed with the magnetic field applied along the -direction compare with along the -direction. On the other hand, such non-equilibrium behavior was not observed in Ho1-xYx[2].
Tb, Dy, and their diluted alloy systems,Tb1-xYx and Dy1-xYx, exhibit similar magnetic structures, a proper helimagneic structure for , and a ferromagnetic one below , in the low concentration range [3, 4]. A rather characteristic hysteresis loop was observed in the magnetization curve of Tb0.63Y0.37 [6]. Recently, temperature hysteresis of the propagation vector has been also observed in the helimagnetic phase of Dy[5]. From these experimental facts, intriguing non-equilibrium state is probably realized commonly in the helimagnetic phases in these systems.
In this study, we have investigated the DC magnetization of Gd0.62Y0.38 and also the DC and AC magnetization of the analogous materials Tb0.86Y0.14 and Dy097Y0.03, intending to search for non-equilibrium behavior. We have observed a clear difference between field-cooled (FC) and zero-field-cooled (ZFC) magnetization in the helimagnetic phase of Gd0.62Y0.38, and as well as in Tb0.86Y0.14 and Dy097Y0.03. Additionally, we have observed strong non-linearity of the magnetization around only in Gd0.62Y0.38. We propose that the strong nonlinearity could be related to the very weak anisotropy of the Gd3+-ion, and is possibly due to a glassy state such as a helical-glass state [9, 10].
0.2 Experimental
The single-crystalline sample of Gd0.62Y0.38 used in this study was grown by the Czochralski pulling method with a tetra-arc furnace. The polycrystalline samples of Tb0.86Y0.14 and Dy0.97Y0.03 used were prepared by arc melting with a mono-arc furnace. In order to prevent inhomogeneity of the Y-concentration in the samples, quenching was done. The samples were wrapped in tantalum foils and sealed in evacuated quartz ampoule under atmosphere of 25-cmHg argon and annealed at 973 K for one week and quenched in iced water.
The DC and AC magnetization was measured using a superconducting quantum interference device (SQUID) magnetometer (MPMS Quantum Design). The dimensions of Gd0.62Y0.38 single crystal sample used for measurements were 0.68 mm 0.15 mm 1.34 mm. (For magnetization measurements, the applied field was along the direction, corresponding to the direction of the 0.68-mm length.) Those of Tb0.86Y0.14 and Dy0.97Y0.03 polycrystalline samples were 4.22 mm 0.78 mm 0.17 mm and 4.55 mm 0.89 mm 0.41 mm, respectively. (For these samples, the applied magnetic field was along the the longest dimension.) For DC magnetization measurements, we used magnetic field of up to 1 kOe since non-equilibrium behavior in Gd0.62Y0.38 was observed only at rather low magnetic fields. For AC magnetization measurements, the applied AC field was 3 Oe and the frequency was between 1 and 1000 Hz. Care was taken to ensure that the remnant field at the sample position was cancelled such that the accuracy of the applied field was within 0.2 Oe. (We estimated the remnant field by measuring the magnetization of a paramagnetic sample of Dy2O3 at low magnetic fields.)
0.3 Results and Discussion

The DC magnetization divided by the magnetic field, , along the -direction of Gd0.62Y0.38 is shown as a function of temperature in Figs. 1 (a)-(d). The measurements were performed in field-cooled (FC) and zero-field-cooled (ZFC) conditions from 300K̇. For each condition, data were taken in warming process after cooling the sample (a) down to 50 K (well below ; i.e, in the ferromagnetic phase), and (b) - (d) down to 186 K (between and ; i.e., in the helimagnetic phase). Peaks corresponding to the para-helimagnetic phase transition temperature are clearly seen at of 200 K. An increase in magnetization corresponding to the heli-ferromagnetic phase transition around is also seen whereas we are unable to determine using these measurements. In Fig. 1 (a), a marked difference between the FC and ZFC magnetization was observed in the helimagnetic temperature range while the FC and ZFC magnetization is almost constant in the ferromagnetic temperature range in a low magnetic field of 2 Oe. The difference between ZFC and FC data was suppressed with increasing field, and no difference was observed in fields above 100 Oe. Moreover, in Fig. 1 (d), the magnitude of in the ZFC condition is seen to be rapidly suppressed by magnetic field of 50 or 100 Oe in particular around , indicating strong non-linearity of the magnetization. In higher magnetic fields, the peak associated with the para-helimagnetic phase transition at is shifted to lower temperatures and at the peak is considerably enhanced at 1000 Oe again.
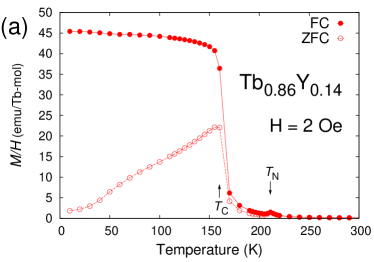
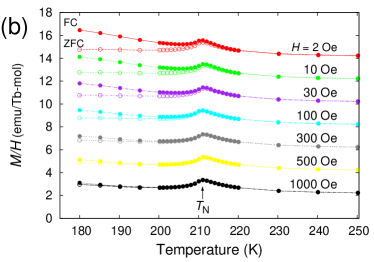
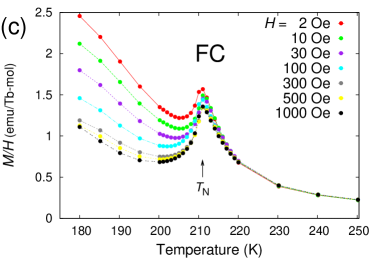
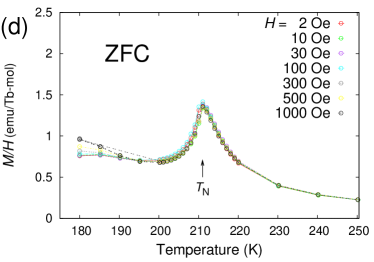

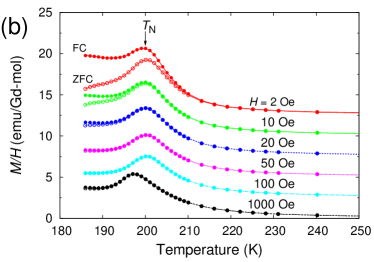
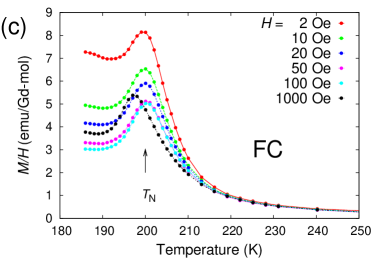
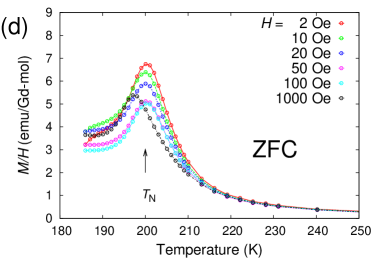
We have also performed similar measurements on Tb0.86Y0.14 (Figs. 2 (a), (c), and (d)). The measurements were performed in FC and ZFC conditions from 300K. Data were acquired in warming process after cooling the sample (a) down to 10 K (well below ; i.e, in the ferromagnetic phase), and (b)-(d) down to 186 K (between and ; i.e., in the helimagnetic phase). In Fig. 2 (a), peaks corresponding to the para-helimagnetic phase transition at of 211 K are seen in similar manners for both of the FC and ZFC measurements. By contrast, the way an increase in magnetization corresponding to heli-ferromagnetic phase transition occurs around differs between the FC and ZFC data. In the ferromagnetic temperature range, the ZFC magnetizaion is significantly smaller than the FC magnetization. With decreasing temperature, the ZFC magnetization suddenly increases around , and gradually decreases. This is typical behavior of ferromagnets involving domain formation process in low magnetic field. Moreover, in Fig. 2 (b), a large difference between the FC and ZFC magnetization is also evident in the helimagnetic temperature range, whereas it is smaller than that in the ferromagnetic temperature range as seen in Fig. 2 (a).
measured in the FC condition is strongly suppressed with increasing magnetic field below . On the other hand, in the ZFC condition hardly changes with magnetic field, and the linearity of the magnetization is preserved around (see Fig. 2 (d)). The magnetization curves obtained at 180 and 250 K are shown in Fig. 2 (e). The measurements were performed by changing the magnetic field in the sequence of (i) 0 Oe 100 Oe, (ii) 100 Oe Oe, and (iii) Oe 100 Oe. At 180 K, in the helimagnetic phase, a hysteresis loop with a finite coercivity was observed. This hysteresis loop should be closely related to the suppression of in the FC condition by magnetic field below seen in Fig. 2 (c). The ZFC condition in the - measurements corresponds to the process (i) in the - curve. In this process, the linearity is preserved and in the ZFC condition remains constant. On the other hand, the state in the FC condition in the - measurements should be close to that of the process (ii) in the - measurements. In this process, should become larger as the applied field approaches to zero owing to the finite remnant magnetization. In other words, the difference between the ZFC and FC magnetization is observed because of the finite coercivity.
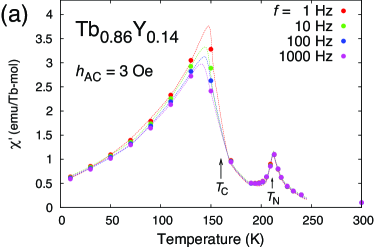
The real and imaginary parts of the AC susceptibility, and , of Tb0.86Y0.14 are plotted against temperature in Fig. 3 (a) and (b), respectively. Peaks corresponding to and were observed in the real part of the AC susceptibility. In the imaginary part of the susceptibility, peaks around were observed, suggestive of critical slowing down in common to Gd0.62Y0.38 [2]. However, no discernible enhancement of the imaginary part around was observed in Tb0.86Y0.14. This contrasts with Gd0.62Y0.38, in which an enhancement of the imaginary part was observed around as mentioned in Introduction [2].
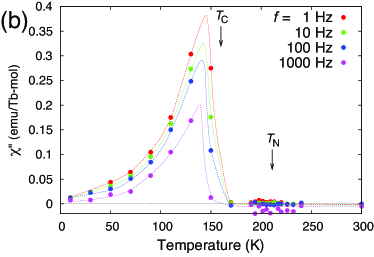
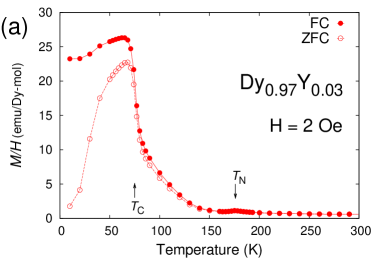
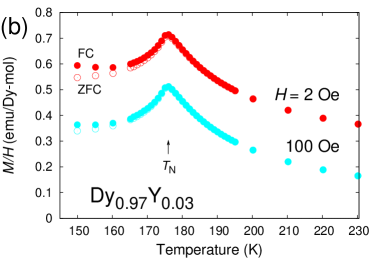
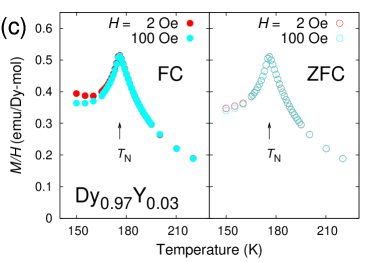
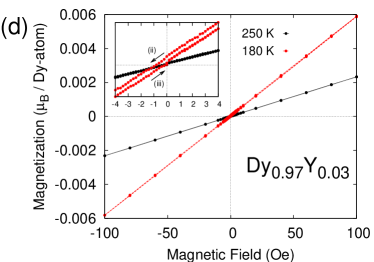
The temperature dependence of of Dy0.97Y0.03 is shown in Figs. 4 (a)-(c). The measurements were performed in warming process after cooling the sample down to the ferromagnetic temperature of 10 K from 300 K (Fig. 4(a)), and down to the helimagnetic temperature of 150 K in FC and ZFC conditions from 300 K (Figs. 4(b),(c)). Peaks corresponding to the para-helimagnetic phase transition at of 176 K and an increase of magnetization corresponding to heli-ferromagnetic phase transition at 75 K are seen. In Fig. 4 (b), a difference between the FC and ZFC magnetization below was also observed, although it was smaller than that observed in Tb0.86Y0.14. A suppression of in the FC condition with increasing magnetic field was also observed, and that in the ZFC condition was hardly observed in Fig. 4 (c). The magnetization curves measured after cooling the sample from 300 K to 150 K or 250 K in zero field are shown in Fig. 4 (d). A hysteresis loop with a finite coercivity was also observed at the helimagnetic phase temperature of 150 K. The manner of the non-equilibrium behavior was qualitatively the same as that in Tb0.86Y0.14. Therefore, the difference between the FC and ZFC magnetization and the suppression of in the FC condition by magnetic field observed in Dy0.97Y0.03 is probably owing to the appearance of a finite coercivity in the helimagnteic phase as well as in Tb0.86Y0.14.
Let us finally discuss possible origins of the non-equilibrium behavior observed in the helimagnetic phase of Gd0.62Y0.38, Tb0.86Y0.14, and Dy0.97Y0.03, placing emphasis on behavior of Gd0.62Y0.38 among them.
The non-equilibrium behavior commonly observed in the helimagnetic phases of all of these materials may be itemized as follows: (1) a difference between the FC and ZFC magnetization, and (2) a suppression of in the FC condition with increasing applied magnetic field. As stated above, the behavior should be related to the appearance of the finite coercivity and the hysteresis loop seen in Figs. 2 (e) and 4 (d). Non-equilibrium behavior in physical properties in helimagnetic phases in rare-earth alloys has been, from quite a while before, discussed in terms of a helical domain structure, which is formed by the left- and right-handed spin chirality domains, in ref. [7, 8]. In ref. [7], hysteretic behavior of the elastic constant of Tb0.50Ho0.50 was observed in the up-sweep-field process and down-sweep-field process, and the value of at zero field was changed from the initial one. Consequently, it is naturally inferred that the hysteresis loop and the finite coercivity in the - curve could be caused by an influence of the chiral domain structure as well. Alternatively, the propagation wave vector (i. e., the period of the helix) could be changed after the application of magnetic field. In fact, recent neutron scattering experiments for Dy have observed temperature hysteresis of [5].
In addition to the above mentioned non-equilibrium behavior (1) and (2), we have observed the following non-equilibrium behavior only in the Gd0.62Y0.38 in the present study. (3) strong non-linearity of the magnetization around , (4) an enhancement of the imaginary part of the AC susceptibility over the whole helimagnetic phase temperature range [2], indicating anomalous slow dynamics. These features are similar to those observed generally in spin-glass systems. This similarity suggests that a novel state such as a helical-glass state that is theoretically proposed might be realized in the helimagnetic phase of Gd0.62Y0.38[9, 10]. We propose that the spin-glass-like behavior in the Gd1-xYx could be closely related to the very weak magnetic anisotropy of Gd3+-ion owing to lack of the orbital angular momentum, .
In summary, we have investigated the DC and AC magnetizations of the rare-earth alloy systems Gd0.62Y0.38, Tb0.86Y0.14, and Dy0.97Y0.03. All of these materials commonly have a helimagnetic phase and, at lower temperatures, a ferromagnetic phase. We have observed several kinds of non-equilibrium behavior in the helimagnetic phase. A difference between the FC and ZFC magnetization and a hysteresis loop with a finite coercivity, which are rather unusual, should be caused by the same nature, e. g., helical domain structures, in the systems. Among them, strong non-linearity of the magnetization around and slow dynamics were particularly unusual, and observed only in Gd0.62Y0.38. These features are somewhat reminiscent of a spin-glass, and perhaps could be accounted for by the formation of a helical glass state due to the very weak anisotropy of the Gd3+-ion.
Acknowledgement
We thank Y. Tabata and H. Nakamura for helpful discussions, and K. Motoya for allowing us to use equipment for sample synthesis.
References
- [1] S. Bates et al., Phys. Rev. Lett. 55 (1985) 2968.
- [2] T. Yamazaki et al., J. Phys: Conf. Ser. 320 (2011) 012068.
- [3] W. C. Koehler et al., J. Appl. Phys. bf 34 (1963) 1335.
- [4] H. R. Child, C. Koehler et al., Phys. Rev. 138 (1965) A1655
- [5] J. Yu, et al., Phys. Rev. B 91 (2015) 014404.
- [6] S. A. Nikitin and N. P. Arutyuyan, Sov. Phys. JETP 48 (1978) 1098.
- [7] S. B. Palmer, J. Phys. F: Metal Phys. 5 (1975) 2370.
- [8] J. Baruchel, et al., J. de Phys. 42 (1981) 1279.
- [9] L. B. Ioffe et al., Sov. Phys. JETP 61 (1985) 354.
- [10] S. J. Thomson et al., Phys. Rev. B 87 (2013) 224203.