Pressure-Induced Phase Transition in La1-xSmxO0.5F0.5BiS2
Abstract
Electrical resistivity measurements on La1-xSmxO0.5F0.5BiS2 ( = 0.1, 0.3, 0.6, 0.8) have been performed under applied pressures up to 2.6 GPa from 2 K to room temperature. The superconducting transition temperature Tc of each sample significantly increases at a Sm-concentration dependent pressure Pt, indicating a pressure-induced phase transition from a low-Tc to a high-Tc phase. The compounds that have higher Sm concentrations have higher Tc values at ambient pressure; however, the Tc values at Pt decrease with and Pt shifts to higher pressures with Sm substitution. In the normal state, semiconducting-like behavior is suppressed and metallic conduction is induced with increasing pressure in all of the samples. These results suggest that the pressure dependence of Tc for the BiS2-based superconductors is related to the lattice parameters at ambient pressure and enable us to estimate the evolution of Tc for SmO0.5F0.5BiS2 under pressure.
pacs:
61.50.Ks, 74.25.F-, 74.62.Fj, 74.70.DdI INTRODUCTION
The application of external pressure to materials has led to the discovery of many new superconductors and has apparently raised the record of the highest superconducting transition temperature, Tc, to 190 K in H2S.Drozdov et al. (2014) Due to its substantial impact on the crystalline and electronic structure of solids, applied pressure is recognized as a powerful tool to tune the Tc, critical fields, and other physical properties of superconductors.Shimizu et al. (2005); Sefat (2011) Recently, superconductivity with Tc values ranging from 2.7 to 10.6 K at ambient pressure has been reported for BiS2-based compounds including Bi4O4S3, LnO1-xFxBiS2 (Ln = La, Ce, Pr, Nd, Yb), La1-xMxOBiS2 (M = Ti, Zr, Hf, Th), and Sr1-xLaxFBiS2.Mizuguchi et al. (2012a); Singh et al. (2012); Awana et al. (2013); Demura et al. (2013); Mizuguchi et al. (2012b); Xing et al. (2012); Yazici et al. (2013a); Mizuguchi (2014); Deguchi et al. (2013); Yazici et al. (2013b); Lin et al. (2013) Similar to the cuprate and Fe-based superconductors, the structure of these compounds is characterized by alternate stacking of superconducting BiS2 layers and charge-reservoir blocking layers, both of which are tunable by using chemical substitution or applying external pressure.Mizuguchi et al. (2012a); Singh et al. (2012); Mizuguchi (2014); Lin et al. (2013); Yazici et al. (2015); Mizuguchi (2015) Therefore, there is plenty of phase space to search for the optimal conditions for superconductivity in this family of compounds.
The compound LaO0.5F0.5BiS2, synthesized under high pressure, was reported to have the highest Tc of 10.6 K in contrast to the Tc 3 K of the same compound when it is synthesized at ambient pressure.Mizuguchi et al. (2014); Deguchi et al. (2013) Although the crystal structure of both the sample annealed at ambient pressure (AP) and the one synthesized under applied high pressure (HP) have the same space group P4/nmm, the strongly reduced lattice parameters and are considered to be related to the enhancement in Tc of HP samples.Mizuguchi et al. (2014); Deguchi et al. (2013); Pallecchi et al. (2014) On the other hand, LaO0.5F0.5BiS2 (AP), which has a low Tc, undergoes a structural phase transition from tetragonal to monoclinic at a pressure of 0.7 GPa, and Tc is enhanced to 10.7 K.Tomita et al. (2014) Similar abrupt increases in Tc were also observed in the compounds LnO0.5F0.5BiS2 (Ln = Ce, Pr, Nd) and Eu3Bi2S4F4 under pressure.Wolowiec et al. (2013a, b); Luo et al. (2014) A gradual increase in Tc up to 5.4 K was observed at ambient pressure in La1-xSmxO0.5F0.5BiS2 with increasing Sm concentration until the solubility limit near = 0.8.Fang et al. (2015) The lattice parameter in La0.2Sm0.8O0.5F0.5BiS2 is significantly smaller compared with other BiS2 based compounds; however, further optimization of superconductivity in this system is prevented by the presence of a solubility limit.Fang et al. (2015) Hence, it would be interesting to explore the electrical transport properties of the system La1-xSmxO0.5F0.5BiS2 under pressure. Such an experiment will not only provide a broad picture of how Tc evolves at extreme conditions, but will also help to determine which parameters are essential to promote superconductivity in the BiS2-based compounds. Additionally, pressure may be particularly well suited to induce certain types of phase transitions in La0.2Sm0.8O0.5F0.5BiS2 due to its extraordinarily small lattice parameters in ambient conditions.
II EXPERIMENTAL DETAILS
The synthesis and crystal structure analysis of polycrystalline samples of La1-xSmxO0.5F0.5BiS2 are described elsewhere.Yazici et al. (2013a); Fang et al. (2015) The chemical composition of each sample presented in this paper is nominal; impurity phases, including La(Sm)F3, La(Sm)O, and Bi2S3, typically 4 wt. for = 0.1, 0.3, 0.6 and 8 wt. for = 0.8, were found in these samples.Fang et al. (2015) Geometric factors for each sample were measured before applying pressure and used to calculate the electrical resistivity from measurements of resistance. Electrical resistance measurements from ambient pressure to 2.6 GPa were performed on samples with nominal Sm concentrations = 0.1, 0.3, 0.6, 0.8 between 2 and 280 K using a standard four-probe method in a pumped 4He dewar. Hydrostatic pressures were generated by using a clamped piston-cylinder cell in which a 1:1 by volume mixture of n-pentane and isoamyl alcohol was used as the pressure transmitting medium. The pressures applied to the samples were inferred from the Tc of a high purity (>99.99 %) Sn disk inside the sample chamber of the cell using the well-established behavior of Tc() in high purity Sn.Smith et al. (1969)
III RESULTS AND DISCUSSION
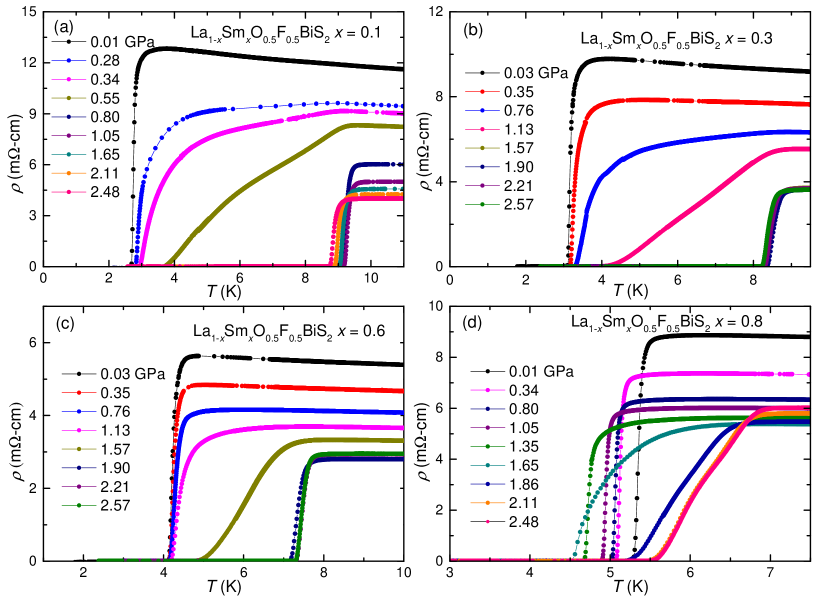
Measurements of the low-temperature electrical resistivity () for La1-xSmxO0.5F0.5BiS2 ( = 0.1, 0.3, 0.6, 0.8) samples in zero magnetic field under applied pressures are depicted in Fig. 1. Superconducting (SC) transitions in which abruptly drops from a finite value to zero were observed in each sample from ambient pressure to the highest pressure (2.6 GPa) applied in this study. We defined Tc as the temperature where the electrical resistivity () falls to 50% of its normal-state value, and the width of the transition is characterized by identifying the temperatures where the electrical resistivity decreases to 90% and 10% of its normal state value. Superconducting transitions are very sharp at low pressures for all of the samples. However, as can be seen in Fig. 1, the width of the SC transition is quite broad within a narrow range of pressures (0.5 GPa), after which, Tc is remarkably enhanced and the transitions become sharp again for the samples with nominal = 0.1, 0.3, 0.6. In the case of the = 0.8 sample, however, the width of the SC transition remains broad at high pressures after the enhancement in Tc; this might be related to the = 0.8 sample being so close to the solubility limit and possible chemical inhomogeneity of the sample.Fang et al. (2015) This behavior reveals pressure-induced transitions from a low-Tc superconducting phase (SC1) to a high-Tc superconducting phase (SC2) in each sample.
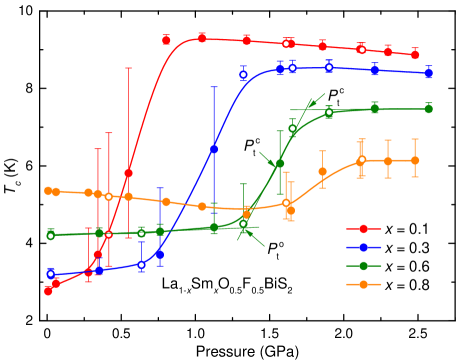
The abrupt change in Tc under pressure is particularly apparent in the temperature-pressure phase diagram (see Fig. 2), in which Pto is the onset of the phase transition, Ptc is the pressure where the phase transition is complete, and Pt is the midpoint between Pto and Ptc. The broad superconducting transitions between Pto and Ptc indicate the emergence of the SC2 phase; the sample in this pressure range is presumably in a mixture of the SC1 and SC2 phases. The values of Tc obtained in measurements with decreasing pressure (open symbols) are consistent with those measured with increasing pressure (filled symbols), revealing that the pressure-induced phase transitions are fully reversible. Tomita et al. recently reported a similar enhancement of Tc at 0.7 GPa in polycrystalline samples of LaO0.5F0.5BiS2, which was attributed to a structural phase transition from tetragonal to monoclinic due to sliding between two neighboring BiS2-layers along the -axis.Tomita et al. (2014) Since both LaO0.5F0.5BiS2 and La1-xSmxO0.5F0.5BiS2 are characterized by the same crystal structure with space group group P4/nmm at ambient pressure and have similar chemical compositions, it seems likely that the pressure-induced enhancement of Tc for La1-xSmxO0.5F0.5BiS2 is also associated with a structural phase transition.
The Tc values of La1-xSmxO0.5F0.5BiS2 superconductors at ambient pressure gradually increase from 2.7 K for = 0.1 to 5.4 K for = 0.8 with increasing Sm substitution up to the solubility limit near = 0.8.Fang et al. (2015) However, the pressure dependence of Tc for all of the samples at P <Pto differ significantly from each other. For the = 0.1, 0.3, 0.6 samples, Tc is initially enhanced with increasing pressure almost linearly and Tc/P decreases with increasing Sm concentration as is shown in Fig. 3 (right axis). Although the value of Tc for = 0.8 is the highest among the four compositions at ambient pressure, Tc/P is negative with a value of roughly -0.45 K/GPa, which results in a decreasing Tc with pressure down to Pto. These results suggest that reduction of the lattice parameter , which is regarded to be essential to the enhancement of Tc for BiS2-based compounds at ambient pressure,Kajitani et al. (2015); Fang et al. (2015); Mizuguchi (2014); Kajitani et al. (2014) does not always result in an increase of Tc.
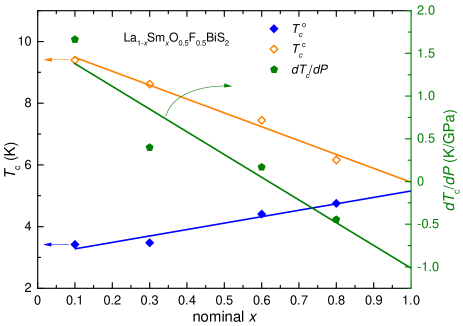
The Tc values at pressures just below and above the transition at Pt from SC1 to SC2 are plotted in Fig. 3 (left axis) and are denoted Tco and Tcc, respectively. Although Tco increases with Sm substitution, Tcc is suppressed almost linearly from 9.4 K for = 0.1 to 6.2 K for = 0.8, resulting in a reduction of the size of the jump in Tc below and above the phase transition (Tc) with increasing Sm concentration. This phenomenon is very similar to that which was observed for the compounds LnO0.5F0.5BiS2 (Ln = La, Ce, Pr, Nd), in which the Tc values above the phase transition decrease with increasing Ln atomic number.Wolowiec et al. (2013a) By linearly extrapolating both Tco and Tcc of La1-xSmxO0.5F0.5BiS2 to = 1, the estimated Tc of SmO0.5F0.5BiS2 is only 0.27 K, which is within the uncertainty of our estimate. If we plot Tc for LnO0.5F0.5BiS2, La1-xSmxO0.5F0.5BiS2, and the estimated Tc for SmO0.5F0.5BiS2 as a function of lattice parameter , they are located almost on the same line despite the differences in their chemical composition (see Fig. 4(a)).
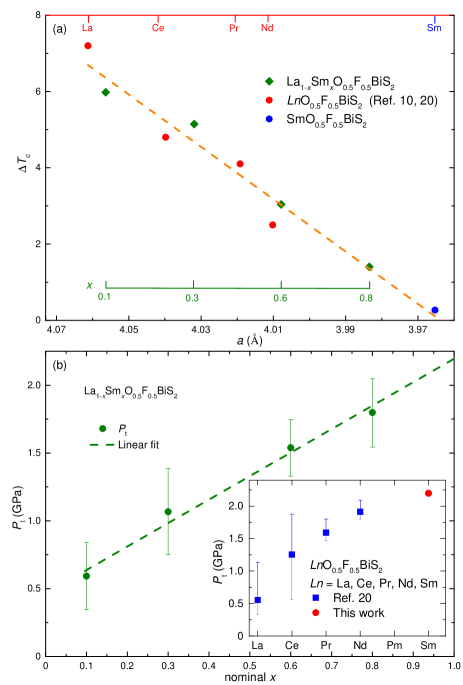
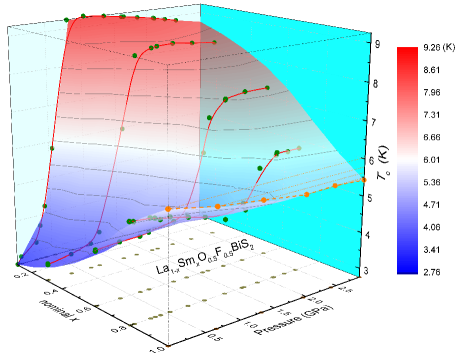
With Sm substitution for La, Pt increases from 0.59 GPa for = 0.1 to 1.80 GPa for = 0.8. The nearly linear evolution of Pt with Sm concentration (see Fig. 4(b)) enables one to estimate a Pt of 2.2 GPa for SmO0.5F0.5BiS2, which is consistent with the Pt values of other known LnO0.5F0.5BiS2 compounds as is shown in the inset of Fig. 4(b).Wolowiec et al. (2013a, b) Figure 5 shows the Tc of La1-xSmxO0.5F0.5BiS2 at different pressures and Sm concentrations together with the estimated Tc of SmO0.5F0.5BiS2 under pressure. The Tc at pressures below and above 2.2 GPa of SmO0.5F0.5BiS2 is estimated from a linear extrapolation of the Tc values of the four samples below and above the phase transition, respectively. It can be seen that higher Tc values for the SC1 phase are found at higher Sm concentrations and lower pressures; however, higher Tc values for the SC2 phase are located in the region with lower Sm concentration just above the phase transition. In fact, by further reducing the Sm concentration to = 0, a higher Tc value of 10.7 K could be obtained under pressure in LaO0.5F0.5BiS2, which has the largest lattice parameter among the LnO0.5F0.5BiS2 compounds at ambient pressure.Tomita et al. (2014) On the other hand, reducing enhances at ambient pressure; however, it also reduces Tc as discussed above. The pressure dependence of Tc below and above 2.2 GPa for SmO0.5F0.5BiS2 has a similar trend and is almost indistinguishable as is shown in Fig. 5. Thus, the possibility that SmO0.5F0.5BiS2 has the same phase at low and high pressures cannot be ruled out. Although it was reported that SmO0.5F0.5BiS2 can be synthesized by solid state reaction,Thakur et al. (2015) this result might be helpful in explaining why this parent compound could not be synthesized in other studies using the same method.Fang et al. (2015); Kajitani et al. (2015)
As is shown in Fig. 6, (T) of La1-xSmxO0.5F0.5BiS2 increases with decreasing temperature at low pressures in their normal state, indicating semiconducting-like behavior, which is suppressed by applied pressure. However, as the representative (T) data in the inset of Fig. 6(d) show, a minimum near 262 K (min) emerges at pressures above 0.4 GPa. Semiconducting-like behavior is observed in (T) for min. Tmin decreases with increasing pressure and then saturates at 1.8 GPa, reaching a value of roughly 40 K. Except for the = 0.1 sample, in which Tmin does not saturate until 2.5 GPa, similar behavior is observed in the other samples under high pressures. However, the relationship between Tmin and Sm concentration is still unclear. The appearance of a metallic-like to semiconducting-like cross over was also found in Eu3Bi2S4F4, Sr1-xLaxFBiS2 ( 0.45), LaOBiS2, and ThOBiS2 at ambient pressure. In the first example, this behavior was attributed to a self-doping effect arising from Eu intermediate valence, while in the second example, it was ascribed to Anderson localization.Zhai et al. (2014); Sakai et al. (2014); Yazici et al. (2013b) However, further work is required to identify the origin of the minimum in La1-xSmxO0.5F0.5BiS2 since the valence of Sm ions might change and sample defects might develop at high pressures.
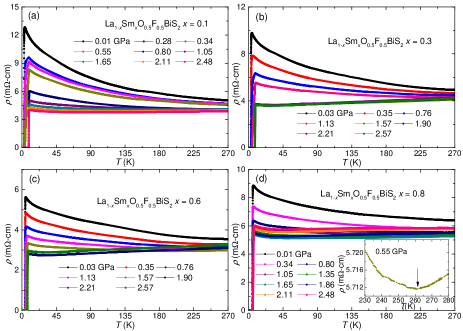
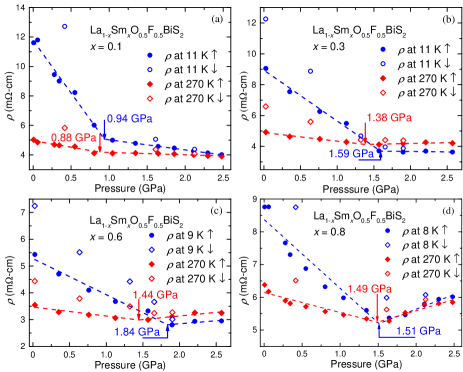
Figure 7 shows values at 270 K (270K) and at certain low temperatures (low), explicitly indicated in the figure, just higher than Tc for each sample. Both 270K and low first decrease with increasing pressure almost linearly. However, the slope of the () curve changes at the pressure indicated by the arrows in Fig. 7, resulting in a kink for each () curve. For the = 0.6 and 0.8 samples, a positive pressure coefficient of resistivity is observed at the pressures above the kink. Although the kink is located at pressures near Pt, it should be noted that the kink does not necessarily coincide with the appearance of the SC2 phase, since both the phase transition between SC1 to SC2 and the appearance of metallic-like behavior may contribute to the normal-state electrical resistivity of the samples.
Since the electrical transport behavior of single crystals of La1-xSmxO0.5F0.5BiS2 has not yet been reported, it is still difficult to determine whether the observed semiconducting-like behavior is related to poor intergain contact or whether it is an intrinsic property. If we assume that the semiconducting-like behavior is intrinsic, the energy gap can be estimated by using the simple activation-type relation:
| (1) |
where 0 is a constant, B is the Boltzmann constant, and is the energy gap.Kotegawa et al. (2012); Jeon et al. (2014) Because the relationship between 1/ and ln is not linear for the whole temperature range in the normal state, the (T) data were fitted using Eq. (1) in two different temperature ranges, 270-160 K and 22-10 K, similar to the analysis in Refs. Wolowiec et al., 2013a, b; Kotegawa et al., 2012; Jeon et al., 2014. The energy gaps 1/B and 2/B, which are extracted from the high temperature and low temperature ranges, respectively, are plotted in Fig. 8. The gap 1/B is not shown above the pressure at which metallic-like conduction is observed. It can be seen that both 1/B and 2/B are suppressed rapidly with increasing pressure; however, the value of 1/B does not change significantly above Ptc with increasing pressure for all of the samples. Hence, the SC2 phase probably has a different band structure which is less sensitive to pressure.
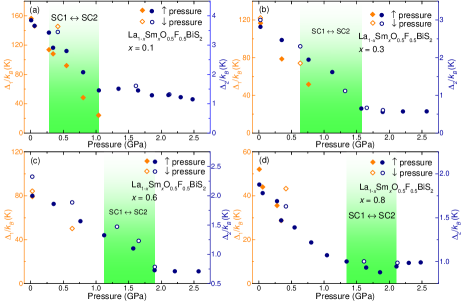
Although Tc is reversible (i.e., there is no difference in values measured for increasing and decreasing pressure), values of 1/B and 2/B are higher for decreasing pressure than increasing pressure, indicating an enhancement of semiconducting-like behavior for all of the samples. A similar phenomenon was also observed in LaO0.5F0.5BiS2 and CeO0.5F0.5BiS2.Wolowiec et al. (2013b) This behavior is associated with the pressure dependence of the electrical resistivity in which values of obtained at similar pressures in measurements in which the pressure cell was being unloaded are significantly higher than those measured upon loading as the representative data show in Fig. 7. However, irreversible defects and disorder as well as a reduction of the geometric factors might develop in the samples under high pressures, which could contribute to a reduction in the conductivity of the samples. Since the energy gap 1/B and 2/B are derived from the electronic structure, there is no obvious reason why these fundamental quantities should show hysteretic behavior as a function of pressure.
IV SUMMARY
Electrical resistivity measurements on polycrystalline samples of the BiS2-based superconductors La1-xSmxO0.5F0.5BiS2 ( = 0.1, 0.3, 0.6, 0.8) were performed from 2 K to room temperature under applied pressures. In the normal state, semiconducting-like behavior is suppressed with increasing pressure. A reversible low-Tc to high-Tc superconductor phase transition was observed in all of the samples at a pressure that is proportional to the Sm concentration. With increasing Sm concentration, Tc is suppressed and a larger pressure is necessary to induce the transition from the SC1 to the SC2 phase. It is also found that an optimal Tc could be tuned by decreasing the lattice parameter in the SC1 phase at ambient pressure or by increasing in the SC2 phase under pressure. These results indicate that the high-pressure behavior of Sm-substituted LaO0.5F0.5BiS2 is largely determined by Sm concentration or the lattice parameter at ambient pressure. Therefore, the evolution of Tc under pressure for the parent compound SmO0.5F0.5BiS2 can be estimated, and we find that the SC1 and SC2 phases exhibit almost indistinguishable Tc values.
Acknowledgements.
Electrical resistivity measurements under applied pressure were supported by the National Nuclear Security Administration under the Stewardship Science Academic Alliance Program through the US Department of Energy (DOE) under Grant No. DE-NA0001841. Sample synthesis and characterization at ambient pressure were supported by the U. S. Department of Energy, Office of Basic Energy Sciences, Division of Materials Sciences and Engineering under Grant No. DE-FG02-04-ER46105. Helpful discussions with I. Jeon and C. T. Wolowiec are gratefully acknowledged.References
- Drozdov et al. (2014) A. P. Drozdov, M. I. Eremets, and I. A. Troyan, arXiv preprint arXiv:1412.0460 (2014).
- Shimizu et al. (2005) K. Shimizu, K. Amaya, and N. Suzuki, J. Phys. Soc. Jpn 74, 1345 (2005).
- Sefat (2011) A. S. Sefat, Rep. Prog. Phys. 74, 124502 (2011).
- Mizuguchi et al. (2012a) Y. Mizuguchi, H. Fujihisa, Y. Gotoh, K. Suzuki, H. Usui, K. Kuroki, S. Demura, Y. Takano, H. Izawa, and O. Miura, Phys. Rev. B 86, 220510 (2012a).
- Singh et al. (2012) S. K. Singh, A. Kumar, B. Gahtori, G. Sharma, S. Patnaik, and V. P. S. Awana, J. Am. Chem. Soc. 134, 16504 (2012).
- Awana et al. (2013) V. P. S. Awana, A. Kumar, R. Jha, S. Kumar Singh, A. Pal, J. Saha, and S. Patnaik, Solid State Commun. 157, 21 (2013).
- Demura et al. (2013) S. Demura, Y. Mizuguchi, K. Deguchi, H. Okazaki, H. Hara, T. Watanabe, S. James Denholme, M. Fujioka, T. Ozaki, H. Fujihisa, G. Yoshito, M. Osuke, Y. Takahide, T. Hiroyuki, and T. Yoshihiko, J. Phys. Soc. Jpn. 82, 033708 (2013).
- Mizuguchi et al. (2012b) Y. Mizuguchi, S. Demura, K. Deguchi, Y. Takano, H. Fujihisa, Y. Gotoh, H. Izawa, and O. Miura, J. Phys. Soc. Jpn. 81, 114725 (2012b).
- Xing et al. (2012) J. Xing, S. Li, X. Ding, H. Yang, and H.-H. Wen, Phys. Rev. B 86, 214518 (2012).
- Yazici et al. (2013a) D. Yazici, K. Huang, B. D. White, A. H. Chang, A. J. Friedman, and M. B. Maple, Phil. Mag. 93, 673 (2013a).
- Mizuguchi (2014) Y. Mizuguchi, Physics Procedia 58, 94 (2014).
- Deguchi et al. (2013) K. Deguchi, Y. Mizuguchi, S. Demura, H. Hara, T. Watanabe, S. Denholme, M. Fujioka, H. Okazaki, T. Ozaki, H. Takeya, T. Yamaguchi, O. Miura, and Y. Takano, Europhys. Lett. 101, 17004 (2013).
- Yazici et al. (2013b) D. Yazici, K. Huang, B. D. White, I. Jeon, V. W. Burnett, A. J. Friedman, I. K. Lum, M. Nallaiyan, S. Spagna, and M. B. Maple, Phys. Rev. B 87, 174512 (2013b).
- Lin et al. (2013) X. Lin, X.-X. Ni, B. Chen, X.-F. Xu, X.-X. Yang, J.-H. Dai, Y.-K. Li, X.-J. Yang, Y.-K. Luo, Q. Tao, G.-H. Cao, and Z. Xu, Phy. Rev. B 87, 020504 (2013).
- Yazici et al. (2015) D. Yazici, I. Jeon, B. D. White, and M. B. Maple, Physica C 514, 218 (2015).
- Mizuguchi (2015) Y. Mizuguchi, J. Phys. Chem. Solids 84, 34 (2015).
- Mizuguchi et al. (2014) Y. Mizuguchi, T. Hiroi, J. Kajitani, H. Takatsu, H. Kadowaki, and O. Miura, J. Phys. Soc. Jpn. 83, 053704 (2014).
- Pallecchi et al. (2014) I. Pallecchi, G. Lamura, M. Putti, J. Kajitani, Y. Mizuguchi, O. Miura, S. Demura, K. Deguchi, and Y. Takano, Phys. Rev. B 89, 214513 (2014).
- Tomita et al. (2014) T. Tomita, M. Ebata, H. Soeda, H. Takahashi, H. Fujihisa, Y. Gotoh, Y. Mizuguchi, H. Izawa, O. Miura, S. Demura, K. Deguchi, and Y. Takano, J. Phys. Soc. Jpn. 83, 063704 (2014).
- Wolowiec et al. (2013a) C. T. Wolowiec, B. D. White, I. Jeon, D. Yazici, K. Huang, and M. B. Maple, J. Phys.: Condens. Matter 25, 422201 (2013a).
- Wolowiec et al. (2013b) C. T. Wolowiec, D. Yazici, B. D. White, K. Huang, and M. B. Maple, Phys. Rev. B 88, 064503 (2013b).
- Luo et al. (2014) Y. K. Luo, H.-F. Zhai, P. Zhang, Z.-A. Xu, G.-H. Cao, and J. D. Thompson, Phys. Rev. B 90, 220510 (2014).
- Fang et al. (2015) Y. Fang, D. Yazici, B. D. White, and M. B. Maple, Phys. Rev. B 91, 064510 (2015).
- Smith et al. (1969) T. Smith, C. W. Chu, and M. B. Maple, Cryogenics 9, 53 (1969).
- Kajitani et al. (2015) J. Kajitani, T. Hiroi, A. Omachi, O. Miura, and Y. Mizuguchi, J. Phys. Soc. Jpn. 84, 044712 (2015).
- Kajitani et al. (2014) J. Kajitani, A. Omachi, T. Hiroi, O. Miura, and Y. Mizuguchi, Physica C 504, 33 (2014).
- Thakur et al. (2015) G. S. Thakur, G. K. Selvan, Z. Haque, L. C. Gupta, S. L. Samal, S. Arumugam, and A. K. Ganguli, Inorg. Chem. 54, 1076 (2015).
- Zhai et al. (2014) H.-F. Zhai, P. Zhang, S.-Q. Wu, C.-Y. He, Z.-T. Tang, H. Jiang, Y.-L. Sun, J.-K. Bao, I. Nowik, I. Felner, Y.-W. Zeng, Y.-K. Li, X.-F. Xu, Q. Tao, Z.-A. Xu, and G.-H. Cao, J. Am. Chem. Soc. 136, 15386 (2014).
- Sakai et al. (2014) H. Sakai, D. Kotajima, K. Saito, H. Wadati, Y. Wakisaka, M. Mizumaki, K. Nitta, Y. Tokura, and S. Ishiwata, J. Phys. Soc. Jpn. 83, 014709 (2014).
- Kotegawa et al. (2012) H. Kotegawa, Y. Tomita, H. Tou, H. Izawa, Y. Mizuguchi, O. Miura, S. Demura, K. Deguchi, and Y. Takano, J. Phys. Soc. Jpn. 81, 103702 (2012).
- Jeon et al. (2014) I. Jeon, D. Yazici, B. D. White, A. J. Friedman, and M. B. Maple, Phys. Rev. B 90, 054510 (2014).