On the fragility of nuclear stellar discs against galaxy mergers: surviving photometric and kinematic signatures of nuclear discs
Abstract
Nuclear stellar discs (NSDs) can help to constrain the assembly history of their host galaxies, as long as we can assume them to be fragile structures that are disrupted during merger events. In this work we investigate the fragility of NSDs by means of N-body simulations reproducing the last phases of a galaxy encounter, when the nuclear regions of the two galaxies merge. For this, we exposed a NSD set in the gravitational potential of the bulge and supermassive black hole of a primary galaxy to the impact of the supermassive black hole from a secondary galaxy. We explored merger events of different mass ratios, from major mergers with a 1:1 mass ratio to intermediate and minor interactions with 1:5 and 1:10 ratios, while considering various impact geometries. We analyse the end results of such mergers from different viewing angles and looked for possible photometric and kinematic signatures of the presence of a disc in the remnant surface density and velocity maps, while adopting detection limits from real observations. Our simulations show that indeed NSDs are fragile against major mergers, which leave little trace of NSDs both in images and velocity maps, while signatures of a disc can be found in the majority of the intermediate to minor-merger remnants and in particular when looking at their kinematics. These results show that NSDs could allow to distinguish between these two modes of galaxy assembly, which may indeed pertain to different kinds of galaxies or galactic environments.
keywords:
galaxies: elliptical and lenticular, cD – galaxies: evolution, galaxies: nuclei, galaxies: interactions, galaxies: kinematics and dynamics1 Introduction
Nuclear stellar discs (NSDs) were first discovered in images taken with the Hubble Space Telescope (HST, e.g., Jaffe et al., 1994; van den Bosch et al., 1994), which allows for the detection of such structures that are often of only tens to hundreds of parsecs across and which reside mainly in the centre of early-type galaxies (Pizzella et al., 2002). Previous studies have focused on the properties of few of such discs e.g., Morelli et al., 2004, Pizzella et al., 2002, Scorza & van den Bosch, 1998 but now thanks to the census of Ledo et al. (2010, hereafter Paper I) we have a sufficiently large sample to study these features more systematically.
NSDs are not only interesting tools for determining the masses of supermassive black holes (SMBH, van den Bosch & de Zeeuw, 1996), but can also be a powerful tool to trace galaxy merging history. In Paper I we have shown evidence pointing to the destruction of these discs during a merger event, even though if there is gas involved during such an event, part of this gas can fall to the centre and form a new stellar disc. Therefore, when present, NSDs provide us with a look-back time to the last merger experienced by their host galaxies, a precise one if they were born at that moment, or at least a lower limit if they formed afterward. This look-back time can be used to test and improve galaxy formation scenarios and the predictions of semi-analytical models (e.g., Khochfar & Silk, 2006a; De Lucia et al., 2006). In fact, NSDs are particularly apt for this role since their stellar age can be determined very precisely. Typical degeneracies between the stellar age and metallicity that affect population studies can indeed be reduced using integral-field spectroscopic data and by knowing in advance (thanks to a photometric disc-bulge decomposition Scorza & Bender, 1995) the disc-light contribution (Sarzi et al., in preparation). What is still unknown to us is understanding more precisely to which extent these discs are fragile and what kind of merging events they actually trace. Do they trace only major mergers (as shown in the preliminary simulations published in Paper I), or do smaller satellite galaxies also have the ability to destroy them? If so, how small and in which circumstances?
The impact of mergers has previously been explored in the case of kinematically decoupled cores (KDC, see Bois et al., 2011) or metallicity gradients (Kobayashi, 2004), but so far little is known about the survival of NSDs. In fact, in this study we are primarily interested in establishing whether the presence of an NSD would still be detectable in the merger remnant by looking for the typical photometric and kinematic signatures of NSDs, such as discy isophotes and regular disc-like rotation, as observers would do on real galaxy images or velocity fields. At the same time, we will resort to our view of the disc particles at the end of our simulations to better understand the disc disrupting process as a function of the parameters that we will explore, checking also for false positive detections.
This work is organised as follows. In Sec. 2 we describe the set up of our initial conditions and the various kinds of merging simulations that we considered. In Sec. 3 we describe the construction of surface density and velocity maps for our merger remnants as seen from different viewing angles and our use of the technique called kinemetry (Krajnović et al., 2006) to analyse these maps and look for both photometric and kinematic signature of discs. In Sec. 4 we then assess how often such signatures would indicate the presence of a disc, and finally discuss our findings in Sec. 5.
2 Simulation thought and design
We are interested in understanding how a galaxy merger would affect the innermost parts of a galaxy with a small nuclear disc embedded at its center. This is likely to depend on the nature of the encounter, for instance on it being either a major or minor merger, on the geometry of the collision, such as prograde as opposed to retrograde, and finally on the mass of the central disc, given that more massive discs should be more stable. In this paper we deal only with the magnitude and geometry of the perturbing event, and focus on nuclear stellar discs, which can extend up to a few 100 pc (Paper I) and can have stellar masses comparable to that of their host galaxy SMBH (Scorza & van den Bosch, 1998). Furthermore, we conducted a series of simulations meant to look only at the final stages of a merging event, when the SMBH hole of the perturbing galaxy reach the central regions of the galaxy hosting the nuclear disc and a primary SMBH. Dynamical friction will indeed cause such a secondary black hole to sink towards the central regions of the primary galaxy or what would eventually become the merger remnant. Most of the stellar cusp around the secondary is likely to be stripped during the early stages of the galaxy pairing, even though the total stellar mass that would remain bound to the secondary could depend on a plethora of factors, such as the initial mass concentration of the secondary galaxy or the mass ratio between the merging galaxies, the orbital parameters of the mergers, and so on (Callegari et al., 2009; Van Wassenhove et al., 2014). At present we therefore decided to start by considering the simplest case of a naked secondary black hole.
| BH | Collision | BH softening |
| Mass ratio | angle (o) | (pc) |
| 1:1 | 0 | 0.5 |
| 1:1 | 30 | 0.5 |
| 1:1 | 60 | 0.5 |
| 1:1 | 90 | 0.5 |
| 1:1 | 120 | 0.5 |
| 1:1 | 150 | 0.5 |
| 1:1 | 180 | 0.5 |
| 1:5 | 0 | 0.5 |
| 1:5 | 30 | 0.5 |
| 1:5 | 60 | 0.5 |
| 1:5 | 90 | 0.5 |
| 1:5 | 120 | 0.5 |
| 1:5 | 150 | 0.5 |
| 1:5 | 180 | 0.5 |
| 1:10 | 0 | 0.5 |
| 1:10 | 30 | 0.5 |
| 1:10 | 60 | 0.5 |
| 1:10 | 90 | 0.5 |
| 1:10 | 120 | 0.5 |
| 1:10 | 150 | 0.5 |
| 1:10 | 180 | 0.5 |
After setting stable initial conditions for a nuclear disc with a radius of 100 pc that is embedded in a bulge with its own SMBH, we introduce in the simulations an additional massive particle at an initial distance of 80 pc from the centre, on a circular orbit. This particle mimics the presence of a perturbing SMBH (the secondary, hereafter) as it is reaching the centre of the primary galaxy during the last stages of a galaxy merger. Inevitably, this secondary SMBH interacts with the star particles of the primary nucleus and sinks toward the centre while perturbing the distribution of the stars. After the secondary had reached the centre, the simulations were let to evolve for several dynamical times as to allow the system to relax to a point where we would not expect further perturbations to the dynamics of the stars. It is at this point that we will proceed to analyse the merger remnant, looking in particular to detect the same photometric and kinematics signatures that observers would regard as indicative of the presence of a nuclear stellar disc.
The simulations were conducted using GADGET-2 (Springel, 2005), a parallel code designed for cosmological N-body/smoothed particle hydrodynamics simulations. Each simulation involved 600K stellar particles and two additional collisionless particles to model two SMBHs. The spatial resolution of our simulations is determined by the gravitational softening of the particles, which is equal to 0.5 pc for all the particles. 300K particles have been used to model the nuclear stellar disc of total mass and an initial outer radius of 100 pc. The disc surface density, , follows a Mestel (Mestel, 1963) profile where , and has an aspect ratio , similarly to previously used nuclear discs (e.g., Dotti et al., 2007; Dotti, Colpi, & Haardt, 2006; Escala et al., 2005) and to the nuclear discs outcome of cosmological simulations (e.g., Levine, 2008). Another 300k particles have been used to model the central regions of the spherical stellar bulge hosting the disc. The bulge follows a Plummer profile
| (1) |
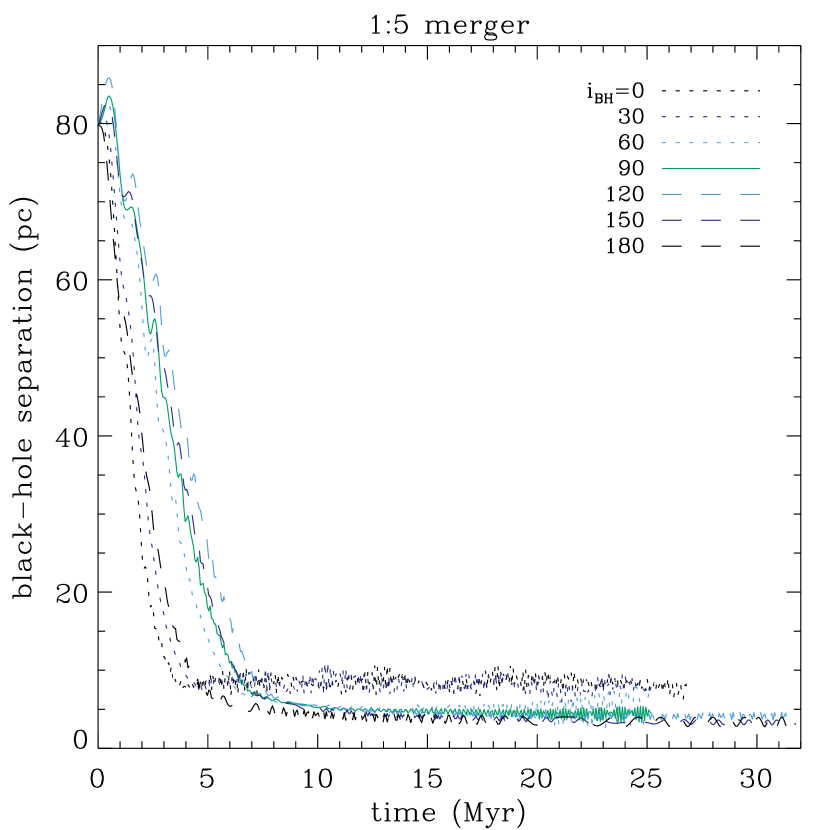
where is the core radius (), the radial coordinate and the total mass of the spheroid, with . Finally, the bulge and disc stellar structure hosts a SMBH. While the SMBH is initially at rest at the centre of the structure, the velocities of the star particles modelling the disc and the bulge are chosen to set the system in dynamical equilibrium. Since an analytic formulation of the distribution function of the composite structure is not available, we let the system to stabilise into dynamical equilibrium in isolation. We further verified that over the typical timescale of our simulated encounters (a few ten Myr, see Fig. 1) the stability of such initial condition was maintained. Individual simulations run time will vary slightly, depending on how fast the secondary BH sinks toward the centre and forms a binary with the primary (see Fig. 1). After this happens we let the simulations continue for a few () dynamical times to let the system relax. Only then we analyse the results.
We designed and ran a set of simulations wide enough to probe a variety of merging scenarios with different mass ratios and orbital inclinations (see Tab. 1). In these runs we vary the mass ratio between the primary and secondary SMBH from 1:1 to 1:10 to explore the cosmologically relevant parameter space. This argument assumes a constant mass ratio between the SMBHs and the host galaxies (Häring & Rix, 2004), so that a 1:1 ratio in SMBH masses simulates a 1:1 galaxy merger. Even if this is the case at the beginning of a merger, the SMBHs can accrete a significant amount of gas, changing their initial mass ratio. Since the smaller secondary galaxy is more perturbed by the merger and suffers a higher gas inflow toward its centre, the secondary can accrete more (relatively to its initial mass, Callegari et al., 2011; Van Wassenhove et al., 2012). This results in the formation of more equal mass SMBH pairs when they reach the nucleus of the merger remnant. For these reasons we consider our 1:10 encounters as providing a lower limit to the actual SMBH mass ratio in such small mergers. There is no consensus on what constitutes a major merger, which we have represented by a 1:1 mass ratio. Different authors set limits as high as 1:2 (e.g., Brook et al., 2012) or as low as 1:4 (e.g., López-Sanjuan et al., 2012; Bundy et al., 2009; Maller et al., 2006). Therefore we chose to simulate a large minor merger, just below this limit, with a mass ratio of 1:5 and a smaller case of 1:10. For even more unequal mergers, works from Callegari et al. (2011, 2009) suggest that such encounters do not lead to the formation of a close pair of SMBHs, since the tidal field of the primary quickly strips the secondary of most of its mass, thus decreasing the efficiency of the dynamical friction at the early stages of the merger and leaving the secondary wandering at kpc separations.
3 Simulation analysis
The simulations follow in time steps the positions and velocities of the black holes and of the disc and bulge stars. Once the system has relaxed and the distance between the primary and secondary black holes has stabilised itself we proceed to check whether the merger remnant still shows some photometric and kinematic signature of a nuclear disc. For this we will produce maps for the surface density and velocity field of the merger remnant, and analyse such maps using kinemetry (Krajnovic et al. 2006) in order to detect in particular discy isophotes and regular disc-like rotation. To help our interpretation of any photometric or kinematic detection or non-detection, we will also produce and visually inspect maps for the surface density of the disc particles only at the end of our simulations.

3.1 Stellar surface brightness and velocity maps
The simulation outputs were first binned in regular grids to create the equivalent to surface brightness and velocity maps. This is a requirement of the code we used to detect the presence of discs, as it is of others such as IRAF task ellipse (Jedrzejewski, 1987). Such grids also allow us to visually follow the merging event and have an equivalent to an image as it would be the case in real observations. For simplicity, the grids were made only for the central regions where the disc was initially present, measuring 400 x 400 pc, using a grid spacing of 5 pc and a Gaussian spatial smoothing of the same size. We produced grids for both the entire remnant and for the disc particles only, even though the latter maps will only serve for a qualitative assessment of the disc disruption. Because, as we will discuss later, the viewing angle affects our ability to detect a disc amidst the bulge light, we generated maps for 0.1, 0.2, 0.3, 0.4 and 0.5, spanning from an edge-on view to 60∘. There is little or no point to analyse projections with values of larger than 0.6 since Rix & White (1990) have shown that at this point it becomes very hard to photometrically detect the presence of discs. As a first example of these maps Fig. 2 shows the disc, bulge and total surface density maps with corresponding velocity maps, for the initial conditions of our simulations.
3.2 Kinemetry
A visual inspection of the maps for the surface brightness and velocity fields of the merging results allows already to appreciate the effects of the different merger simulations, but to better study the merger remnant and quantify whether a disc would still be detectable in it we have used kinemetry (Krajnović et al., 2006) to analyse the moments of the line-of-sight velocity distribution (LOSVD). The gridding described in the previous section was done not only to aid visualisation and qualitative assessment but also as a necessity for the photometric side of kinemetry.
The kinemetry algorithm works under the assumption that the even moments of the LOSVD, such as the surface brightness, are described by a constant profile along ellipses, and that the odd moments, such as mean velocity, can be described by a cosine law along such contours. In particular, we will be looking for peaks in the coefficient of the fourth cosine term on the Fourier series expansion of the deviations from the elliptical isophotes () in the photometry, and for very small values of the k5/k1 ratio (analogous to the ) in the velocity fields. Large values will indicate discy isophotes, whereas small k5/k1 values will ensure the presence of a regular, disc-like rotation. As done in other photometric tools such as the IRAF task ellipse (Jedrzejewski, 1987), kinemetry begins by identifying the best-fitting ellipses to the isophotes to retrieve the radial profiles for the average surface brightness, position angle (PA), flattening () and higher moments such as the . Similarly, from the odd moments, we obtain a velocity curve (traced by the parameter), a kinematic PA and flattening, and the k5/k1 values (see Krajnović et al., 2006, for more details).
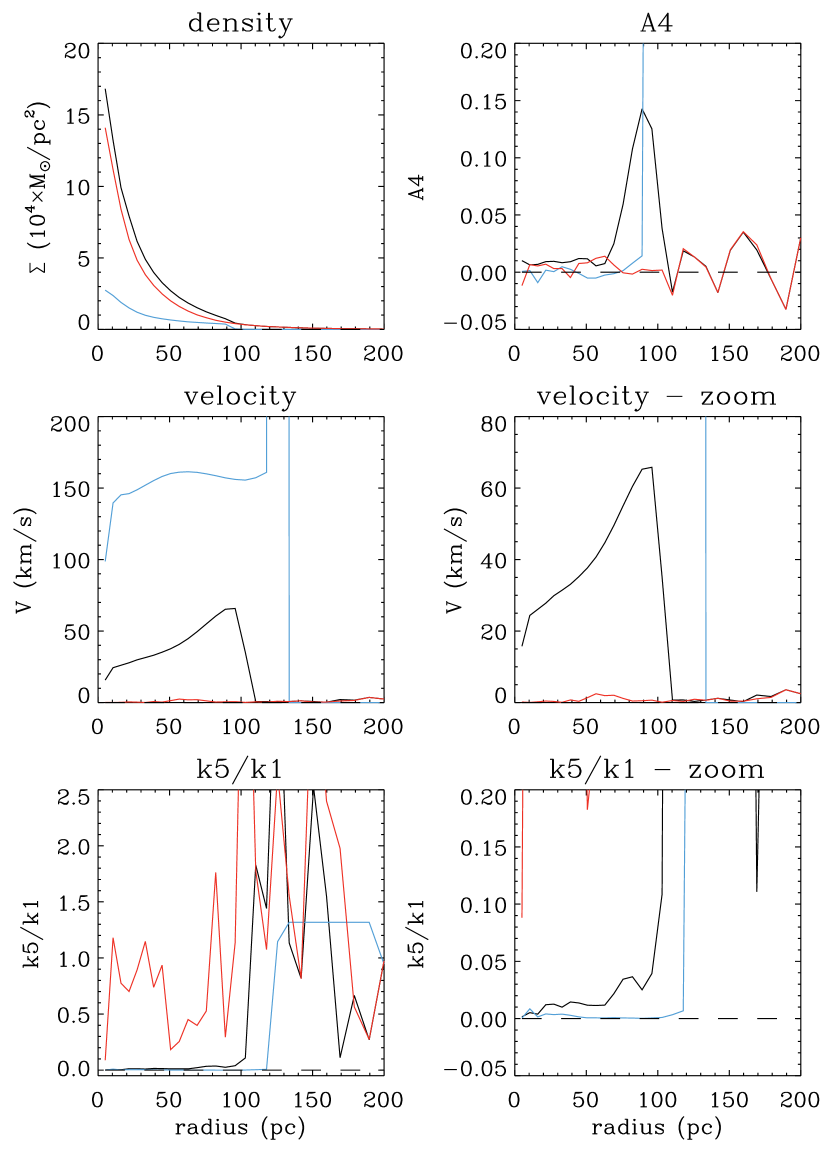
In Fig. 3 we show the main outputs from kinemetry for the same initial conditions shown in Fig. 2. As expected, we can see and velocity peaks in both the disc and total surface brightness (blue and black lines respectively) whereas the bulge (red line) stays flat. On the other hand, the k5/k1 values for the disc and total velocity field present very low values, tracing disc-like rotation, whereas the bulge displays a noisy k5/k1 profile. These are the quantities that will allow us to tell, once compared to appropriate detection thresholds (Sec. 3.3) if the photometric and kinematic signatures of a disc are present or not when looking at the final stages of the interaction.
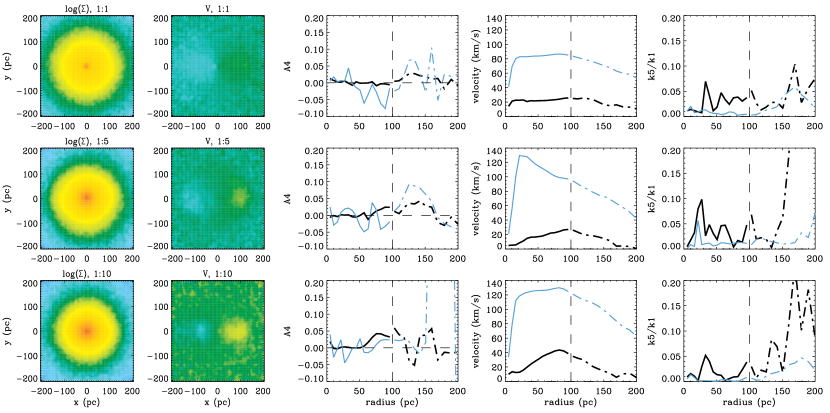
Fig. 4 shows examples of the surface brightness and velocity maps with corresponding kinemetry outputs for the final stages of the 1:1, 1:5 and 1:10 mass ratios after a encounter and seen at a inclination, similar to what was shown for the initial conditions. The bulge results have been omitted for simplicity as they are not key to our goals. Similarly, we do not follow the behaviour of the disc alone (blue lines) since, although interesting, what observations trace is the surface brightness and average velocity of all the stars. For the purpose of detecting the signature of a disc, we will therefore look at and analyse the surface density and kinematics of all the particles in our simulations (black lines), in particular, the region where the disc was originally present, which corresponds to the solid line in the plots and is delimited by the vertical dashed line, placed at the 100 pc radius.
3.3 Disc kinemetric signatures
In order to assess at the end of which kind of merger events we could still find the photometric or kinematic signatures of a disc, we considered the results of the kinemetry analysis inside the central 100 pc region originally occupied by the disc, although for edge-on projections this radius was decreased to 50 pc when considering the velocity and the parameter, due to convergence problems with the kinemetry procedure. In Fig. 4 such a limit is indicated by a vertical dashed line, and the kinemetry descriptions inside this radius are plotted as solid lines.
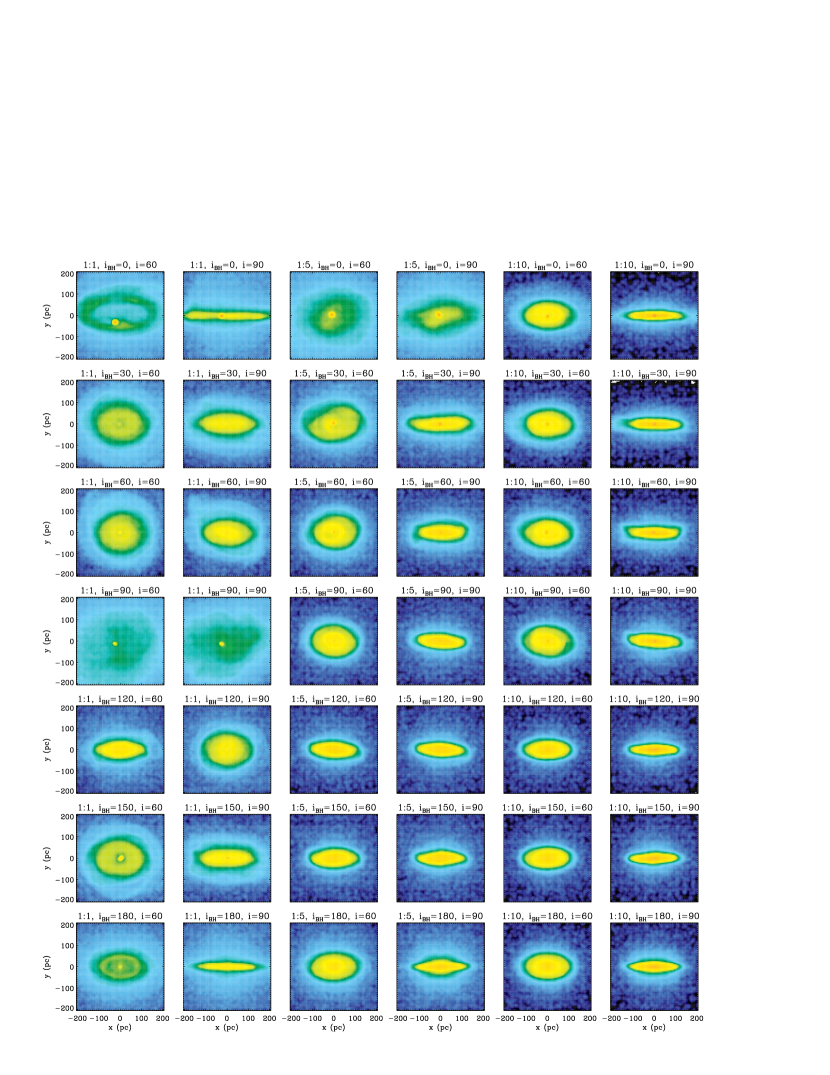
To identify the presence of a disc, we will use the mean values for the kinemetry parameters in such central regions, in particular to isolate fluctuations caused only by a fraction of the disc particles which had acquired extreme behaviours, such as those ejected at large radii. Ideally, when computing such average values one would first guess the size of the disc by locating a clear peak of the parameter, which indeed is a good gauge of the disc extent (see Fig. 5 in Paper I). This approach would not be applicable to all our merger remnants, however, in particular for the most conspicuos 1:1 mergers where the signal is weak and noisy. On the other hand, when a disc signature is detected, we always found an peak close to the original edge at 100 pc of our initial disc, since in fact when the disc particles remain in a disc-like configuration, the extent of such disc remnants is similar to that of our initial conditions. This can be appreciated in Fig. 5, where we collected the surface density distribution of the disc particles at the end of all our simulations as seen both edge-on and from the lowest inclination that we considered, of 60∘.
In the next section we will compare the average values for the parameter, the rotation velocity and for the k5/k1 ratio, with corresponding threshold values that indicate the presence of a disc. For the parameter we considered a generous minimum average value of 0.02 for detecting discy isophotes in our simulations, which is comparable to what is observed in real NSD-hosting galaxies (see e.g., Morelli et al., 2004; Pizzella et al., 2002). As regards kinematics, we require an average velocity above to detect global rotation, in line with typical errors on this quantity, and average values below 0.04 to recognise the presence of disc-like motions. The latter threshold, which lies just above the typical average value found in our initial conditions, is taken from Krajnović et al. (2011) who based their judgement on integral-field data for 260 early-type galaxies from the ATLAS3D survey (Cappellari et al., 2011).
Fig. 6 presents the central average values for the , and k5/k1 parameters measured in the surface-density and velocity maps for the final step of each of our simulations as observed from different viewing angles from edge-on down to a 60∘ inclination. The different panels in these figures group together simulations with similar impact angle . In each panel the size of the circles show the average , and k5/k1 values, where the size of these symbols correspond to the mass-ratios of the merger events (i.e., with largest circles showing 1:1 mergers). Finally, the asterisks in Fig. 6 also show the average values of these parameters from our initial conditions. These are the figures that will be discussed in the next section.
4 Results

Photometrically, the search for the presence of nuclear discs generally starts with the visual inspection of unsharped images or structure maps, which highlight small scale features (e.g., Pizzella et al., 2002, Paper I). This is then followed by a more quantitive analysis of the shape of the stellar isophotes, looking in particular for positive peaks in the parameter. With integral-field spectroscopic data it will further be possible to look for rotating structures that may not always show up photometrically, which are likely to be discs when finding very low values for the kinemetric parameter that would indicate a regular, disc-like kinematics.
4.1 Visual inspection of disc remnants
Before analysing our kinemetric results on the global outcome of our simulations, we produce maps for the surface density of the disc particles only and inspect such disc remnants. This we do in order not only to visually assess the disruption of the disc but most important to gain some insights on our kinemetric findings and the detection of disc signatures. As one would expect, Fig. 5 shows that major mergers (with a 1:1 mass ratio, left) have the most dramatic impact on the disc, as its particles get scattered at large radii and vertically leading to lower surface density values and thicker remnants compared to intermediate and minor mergers (with 1:5 and 1:10 mass ratio, center and right). Fig. 5 further indicates that prograde encounters (top panels) affect the disc structure more than their retrograde counterparts (lower panels), which can be noticed by looking in particular at the 1:5 merger disc remnants. This visual inspection also reveals interesting structures in the disc remnants, such as circumnuclear rings or the accumulation of stars in central clusters.
4.2 Incidence of disc kinemetric signatures
Having defined earlier in Sec. 3.3 the thresholds for the detection of a disc in our simulations based on average values for the , and parameters, and after checking that all our simulations reached a post-interaction relaxed state, we now proceed to assess in which kind of simulation and down to which inclination we can still find clear photometric and/or kinematic signatures of a disc.
Starting from the plots for the parameter (top panels in Fig. 6), we re-observe the trend whereby the photometric signature of a disc gets more easily erased during the interactions involving a more massive secondary black hole. Indeed, 1:1 mergers leave little or no trace of a nuclear disc in 81 of the cases whereas the final steps of the 1:5 and 1:10 mergers display average values above the threshold suggestive of a disc structure in 73 and 86 of the cases. Prograde encounters would appear to be generally more destructive, as can be noticed by comparing the trends for the 1:5 and 1:10 remnants for and 60∘ with their counterparts at values of 120∘ and 150∘, or by observing that most of the 1:1 merger remnants showing discy isophotes are found in the case of a perfectly retrograde encounter (). In fact, the edge-on projection of the 1:1 prograde merger () owes its large values only to a distinct ring-like structure in the disc remnant (Fig. 5), which would not be mistaken for a disc upon a simple visual inspection.
The difference between prograde and retrograde can be understood considering that stars are more easily deflected by the secondary black hole when this travels alongside rather than against them, which is also why dynamical friction on the secondary is more efficient in the prograde cases making it sink faster towards the centre. This can be appreciated back in Fig. 1 which shows the evolution of the black holes separation as a function of time and where the prograde tracks for , 30 and 60 indicate always a faster sinking than their retrograde counterparts for , 150 and 120. Meiron & Laor (2013) provide another example of this behaviour in the somehow different context of a binary black-hole interaction within a non-rotating bulge, which ends up showing a central rotating structure as the coalescing black holes evacuated preferentially the stars that co-rotate with them. The larger impact of a prograde encounter on discs was also already shown by Velazquez & White (1999) in the case of Milky Way-like galactic discs and satellites.
Moving on to the trends for the peak velocity traced by our kinemetric fit (middle panels in Fig. 6), we observe that - except for the planar and polar 1:1 encounter and the planar prograde 1:5 merger - some level of bulk stellar rotation would always remain detectable in the remnant, even in cases where no photometric signature of the disc was identified in the profiles. This suggests, as one would expect, that while perturbing the radial and vertical structure of a thin disc is relatively easy, entirely erasing the signature of the rotation of its stars is much more difficult, and requires a rather dramatic scattering of the disc stars at larger radii. This is for instance the case of the aforementioned ring-like structure in the 1:1 planar prograde merger, which is all that is left of the disc and does not contain a sufficient number of particles to imprint a signature of bulk rotation in the merger remnant, even when seen edge-on.
Not all rotating remnants show regular disc-like kinematics, however. Looking finally at the average values for the parameters (lower panels in Fig. 6) shows in particular that nearly half of the 1:1 remnants do not rotate regularly when they do show bulk rotation. On the other hand, except for a few projections of the prograde encounter, the remnants of 1:5 interactions generally display regular kinematics, with this being always the case of the 1:10 remnants.
Overall, a sufficiently ample and regular rotation is found in 38, 72 and all of the remnants of the 1:1, 1:5 and 1:10 mergers, respectively. Many of these also show photometric disc signature that would suggest the presence of a rather thin disc component, whereas conversely the absence of a photometric signature, which occurs in particular in 1:1 mergers, could lead to infer the presence of a rather thick disc (as Fig. 6 indeed shows). Based on this limited number of simulations we can draw an initial general picture for the chance of nuclear stellar discs surviving a galaxy merger and of being detected, considering in particular that co-planar encounters are, for a purely probabilistic perspective, much less likely to happen than merger events where the secondary black hole initially moved in an highly inclined orbit. We can account for this effect by correcting for a sin) factor our raw fractions of remnants with kinematic and photometric disc signatures, which effectively removes the perfectly co-planar cases and accentuates the impact of polar or nearly polar impacts. Since the former simulations tend to be the more disruptive for the disc, this correction tends to produce larger detection rates for discy or regularly rotating structures. These fractions do not vary dramatically, however, in particular since the perfectly polar impact can also be quite damaging for the disc. The values for both our raw and sin)-corrected fractions of merger remnants with photometric discy features or regular velocity fields are reported in Tab. 2.
| Mass ratio | raw | sin() | raw | sin() |
|---|---|---|---|---|
| 1:1 | 19.0 | 16.1 | 38.1 | 45.5 |
| 1:5 | 61.9 | 72.8 | 71.4 | 80.1 |
| 1:10 | 85.7 | 85.0 | 100.0 | 100.0 |
5 Discussion
Using a suite of numerical simulations we have explored the fragility of nuclear stellar discs in order to establish their usefulness as tools to constrain merging histories of early-type galaxies, looking in particular at the same photometric and kinematic signatures that observers would regard as indicative of the presence of a NSD. Our results show that NSDs are destroyed in major merger situations whereas photometric and, even more generally, kinematic signatures of a disc are still detectable in the remnants of minor mergers (see Tab. 2). Integral-field studies should therefore prove particularly useful to compile a more complete census of NSDs than already done based solely on HST images in Paper I. In particular, new instruments such as MUSE (Bacon et al., 2010), with its superior sensitivity and the ability to work in conjunction with adaptive optics, will be very useful for detecting NSDs. Additionally, MUSE should also prove an excellent tool for dating the age of these structures, improving on the first experiment of Sarzi et al. (in preparation) based on VIMOS data.
A large sample of NSDs with well constrained values for their stellar age, combined with the knowledge gained here on the fragility of such structures, should allow to paint a more detailed picture for the assembly history of galaxies. For instance, finding evidence for a NSD both kinematically and photometrically - that is - finding the signature of a thin disc, would suggest according to our analysis that there is only a chance that the host galaxy of such a disc would have experienced a major merger since the formation epoch of the disc, as indicated by its stellar age. In fact, our estimated incidence of nuclear-disc hosting galaxies that would still show evidence for a disc after a merger are most likely conservative limits, in particular since we have not considered here the possible presence of a stellar cusp around the secondary incoming SMBH, and the additional negative impact that would come with such an added stellar mass.
Galaxy evolution models predict merging trees of a combination of mergers (e.g., Khochfar & Silk, 2006a, b; González et al., 2011) and there is a great debate on the influence of major and minor mergers in the size and mass growth of galaxies, with current theory favouring 1:5 - 1:10 mergers (e.g., Oser et al., 2012; Bédorf & Portegies Zwart, 2013). This corresponds to the minor merger range of mass ratios studied in this work. Yet major mergers cannot be discarded, as other studies (e.g., Lidman et al., 2013) have suggested that in recent epochs they may have caused large mass increases. Therefore, the ability of these NSDs to discriminate between merger scenarios is central to today’s questions.
We are aware that the set up of the simulations presented here is simplified. For instance considering a Mestel profile for the nuclear disc and a purely spherical Plummer distribution for the bulge does not convey the complexity of real nuclei where e.g., the disc is better described by an exponential law and bulges can be flattened and present both core and cuspy profiles. Yet, with a bulge mass approximately 5 times that of the disc within 100 pc, the corresponding disc to total surface brightness ratio of our initial model does span the observed values between 20 and 40% (e.g., Morelli et al., 2004), depending on the inclination. We therefore regard this work a first exploratory study, which could be improved on the one hand by exploring a larger parameter space, for instance by varying the mass of the nuclear disc compared to its host bulge and central SMBH, or on the other hand by considering a more realistic model with a stellar cusp around the secondary black hole. The actual amount of stellar mass bound to the sinking nucleus of a satellite galaxies may well remain a free parameter in a future analysis, unless new insights will emerge from larger sets of simulations such as those of Callegari et al. (2009), but in general we expect that the presence of a stellar cusp around the secondary will further contribute to the disc disruption.
To conclude, we note that better simulations may as well shed more light also on the origin of the kinematically decoupled cores (KDC) that are often found in early-type galaxies (e.g., Bender, 1988; Franx, Illingworth, & Heckman, 1989; McDermid et al., 2006). Indeed a significant number of our simulated encounters result in remnants that display regular rotation, characterised even by a low average value, despite not showing any photometric signatures of discy structures. This resembles the situation observed for the KDCs of massive elliptical galaxies (see, e.g., Fig C4 of Krajnović et al., 2011), where indeed a distinct kinematic central pattern is never accompanied by a significant change in the isophotes orientation, flattening or shape in the same regions. To us, this similarity suggests a possible link between KDCs and puffed-up thick discs, and a closer look to the higher-order moments of the stellar LOSVD, both in future simulations and in high-quality integral-field data, should provide more valuable insights on the nature of these structures.
Acknowledgements
We are grateful to the anonymous referee for carefully reviewing our manuscript, which considerably helped in improving our work. We are also indebted to R. L. D. Davies for also providing useful comments.
References
- Bacon et al. (2010) Bacon R., et al., 2010, SPIE, 7735, 773508
- Bédorf & Portegies Zwart (2013) Bédorf J., Portegies Zwart S., 2013, MNRAS, 431, 767
- Bender (1988) Bender R., 1988, A&A, 202, L5
- Bois et al. (2011) Bois M., et al., 2011, MNRAS, 416, 1654
- Brook et al. (2012) Brook C. B., Stinson G., Gibson B. K., Roškar R., Wadsley J., Quinn T., 2012, MNRAS, 419, 771
- Bundy et al. (2009) Bundy K., Fukugita M., Ellis R. S., Targett T. A., Belli S., Kodama T., 2009, ApJ, 697, 1369
- Callegari et al. (2011) Callegari S., Kazantzidis S., Mayer L., Colpi M., Bellovary J. M., Quinn T., Wadsley J., 2011, ApJ, 729, 85
- Callegari et al. (2009) Callegari S., Mayer L., Kazantzidis S., Colpi M., Governato F., Quinn T., Wadsley J., 2009, ApJ, 696, L89
- Cappellari et al. (2011) Cappellari M., et al., 2011, MNRAS, 413, 813
- Dotti et al. (2007) Dotti M., Colpi M., Haardt F., Mayer L., 2007, MNRAS, 379, 956
- Dotti, Colpi, & Haardt (2006) Dotti M., Colpi M., Haardt F., 2006, MNRAS, 367, 103
- Eliche-Moral et al. (2010) Eliche-Moral M. C., et al., 2010, A&A, 519, A55
- Escala et al. (2005) Escala A., Larson R. B., Coppi P. S., Mardones D., 2005, ApJ, 630, 152
- De Lucia et al. (2006) De Lucia G., Springel V., White S. D. M., Croton D., Kauffmann G., 2006, MNRAS, 366, 499
- Franx, Illingworth, & Heckman (1989) Franx M., Illingworth G., Heckman T., 1989, ApJ, 344, 613
- González et al. (2011) González J. E., Lacey C. G., Baugh C. M., Frenk C. S., 2011, MNRAS, 413, 749
- Häring & Rix (2004) Häring N., Rix H.-W., 2004, ApJ, 604, L89
- Jaffe et al. (1994) Jaffe W., Ford H. C., O’Connell R. W., van den Bosch F. C., Ferrarese L., 1994, AJ, 108, 1567
- Jedrzejewski (1987) Jedrzejewski R. I., 1987, MNRAS, 226, 747
- Khochfar & Silk (2006a) Khochfar S., Silk J., 2006, MNRAS, 370, 902
- Khochfar & Silk (2006b) Khochfar S., Silk J., 2006, ApJ, 648, L21
- Krajnović et al. (2006) Krajnović D., Cappellari M., de Zeeuw P. T., Copin Y., 2006, MNRAS, 366, 787
- Krajnović et al. (2008) Krajnović D., et al., 2008, MNRAS, 390, 93
- Krajnović et al. (2011) Krajnović D., et al., 2011, MNRAS, 414, 2923
- Kobayashi (2004) Kobayashi C., 2004, MNRAS, 347, 740
- Ledo et al. (2010) Ledo H. R., Sarzi M., Dotti M., Khochfar S., Morelli L., 2010, MNRAS, 407, 969 (Paper I).
- Levine (2008) Levine R., 2008, PhDT, University of Colorado at Boulder
- Lidman et al. (2013) Lidman C., et al., 2013, MNRAS, 433, 825
- López-Sanjuan et al. (2012) López-Sanjuan C., et al., 2012, A&A, 548, A7
- Maller et al. (2006) Maller A. H., Katz N., Kereš D., Davé R., Weinberg D. H., 2006, ApJ, 647, 763
- McDermid et al. (2006) McDermid R. M., et al., 2006, MNRAS, 373, 906
- Meiron & Laor (2013) Meiron Y., Laor A., 2013, MNRAS, 433, 2502
- Mestel (1963) Mestel L., 1963, MNRAS, 126, 553
- Morelli et al. (2004) Morelli L., et al., 2004, MNRAS, 354, 753
- Oogi & Habe (2013) Oogi T., Habe A., 2013, MNRAS, 428, 641
- Oser et al. (2012) Oser L., Naab T., Ostriker J. P., Johansson P. H., 2012, ApJ, 744, 63
- Pizzella et al. (2002) Pizzella A., Corsini E. M., Morelli L., Sarzi M., Scarlata C., Stiavelli M., Bertola F., 2002, ApJ, 573, 131
- Rix & White (1990) Rix H.-W., White S. D. M., 1990, ApJ, 362, 52
- Scorza & Bender (1995) Scorza C., Bender R., 1995, A&A, 293, 20
- Scorza & van den Bosch (1998) Scorza C., van den Bosch F. C., 1998, MNRAS, 300, 469
- Springel, Yoshida, & White (2001) Springel V., Yoshida N., White S. D. M., 2001, NewA, 6, 79
- Springel (2005) Springel V., 2005, MNRAS, 364, 1105
- van den Bosch et al. (1994) van den Bosch F. C., Ferrarese L., Jaffe W., Ford H. C., O’Connell R. W., 1994, AJ, 108, 1579
- van den Bosch & de Zeeuw (1996) van den Bosch F. C., de Zeeuw P. T., 1996, MNRAS, 283, 381
- Van Wassenhove et al. (2012) Van Wassenhove S., Volonteri M., Mayer L., Dotti M., Bellovary J., Callegari S., 2012, ApJ, 748, L7
- Van Wassenhove et al. (2014) Van Wassenhove S., Capelo P. R., Volonteri M., Dotti M., Bellovary J. M., Mayer L., Governato F., 2014, MNRAS, 439, 474
- Velazquez & White (1999) Velazquez H., White S. D. M., 1999, MNRAS, 304, 254