Confined Flares in Solar Active Region 12192 from 2014 October 18 to 29
Abstract
Using the observations from the Atmospheric Imaging Assembly (AIA) and Helioseismic and Magnetic Imager (HMI) aboard the (), we investigate six X-class and twenty-nine M-class flares occurring in solar active region (AR) 12192 from October 18 to 29. Among them, thirty (including six X- and twenty-four M-class) flares originated from the AR core and the other five M-flares appeared at the AR periphery. Four of the X-flares exhibited similar flaring structures, indicating they were homologous flares with analogous triggering mechanism. The possible scenario is: photospheric motions of emerged magnetic fluxes lead to shearing of the associated coronal magnetic field, which then yields a tether-cutting favorable configuration. Among the five periphery M-flares, four were associated with jet activities. The HMI vertical magnetic field data show that the photospheric fluxes of opposite magnetic polarities emerged, converged and canceled with each other at the footpoints of the jets before the flares. Only one M-flare from the AR periphery was followed by a coronal mass ejection (CME). From October 20 to 26, the mean decay index of the horizontal background field within the height range of 40–105 Mm is below the typical threshold for torus instability onset. This suggests that a strong confinement from the overlying magnetic field might be responsible for the poor CME production of AR 12192.
1 Introduction
As the main sources of solar intense eruptions, including filament eruptions, major flares, and coronal mass ejections (CMEs), active regions (ARs) have been extensively explored (e.g., Hagyard et al., 1984; Wang, 1994; Zhang et al., 2012). Strong flares tend to occur near the prime magnetic polarity inversion lines (PILs) of ARs where the field gradients are steep and the horizontal components are highly sheared (e.g., Wang et al., 2002; Deng et al., 2006; van Driel-Gesztelyi & Culhane, 2009). In many previous works (e.g., Wang, 1994; Schrijver et al., 2005; Zhang et al., 2007; Sun et al., 2012), shear and emergence of magnetic flux were suggested to be an important way to store the non-potential energy in the coronal field of ARs, which might be released in the subsequent eruption.
Magnetic reconnection in destabilization processes is considered as a possible mechanism to trigger solar eruptions (Vršnak, 2008). In the tether-cutting (TC) model (Moore et al., 2001), the reconnection between the inner legs of the sheared core field would lead to an unbalanced situation between the upward magnetic pressure force and downward magnetic tension force. This may drive the reconnected field connecting the far ends of the core field and the envelop field to expand outward. Then, another reconnection occurs below the expanding field and further speeds up the eruption to form the CME (e.g., Amari et al., 2014; Chen et al., 2014). Sometimes, the inflating field stops when reaching a certain height and no obvious CME would be observed in the wake of the eruption (e.g., Ji et al., 2003). The related flares are called confined flares (e.g., Wang & Zhang, 2007).
Strong confinement from the overlying magnetic arcades is believed to play an important role in the failed eruptions (e.g., Török & Kliem, 2005; Guo et al., 2010; Shen et al., 2011; Netzel et al., 2012; Chen et al., 2013). To characterize how fast the overlying magnetic field decays, a decay index is usually defined as = – log()/ log(). Here, denotes the horizontal component of the potential field strength; is the height above the solar surface. In some earlier studies (Bateman, 1978; Kliem & Török, 2006; Fan & Gibson, 2007; Aulanier et al., 2010), a typical threshold of for torus instability initiation was suggested to be in the range [1.5, 2.0]. When reaches a larger value at the height of the erupting flux rope, torus instability would lead to a full eruption of the system.
AR 12192 recently attracted considerable attention (e.g., Thalmann et al., 2015; Sun et al., 2015) for its large sunspot group and high flare productivity. According to the observations, while AR 12192 passed across the visible solar disk, it produced six X-class and twenty-nine M-class flares from October 18 to 29. However, it is surprising that only one M-flare was associated with a CME. The data from the Atmospheric Imaging Assembly/ (AIA/; Lemen et al., 2012) show that some of the flares had similar origin within the AR and common spatial and timing characters, implying they were homologous flares with analogous triggering mechanism (e.g., Sui et al., 2004; Yang et al., 2014). To probe the initiation mechanisms of these homologous flares and causes of the low CME-association of the major flares, we examined the evolution of the photospheric magnetic fluxes, the major flares (M- and X-class), and the background potential field of this AR.
2 Data and Observations
The Helioseismic and Magnetic Imager (HMI; Schou et al., 2012) on produces photospheric vector magnetograms with 0.5 plate scale at 12 minutes cadence (Hoeksema et al., 2014). In the present study, we used de-projected maps in cylindrical equal area coordinates of the automatically identified AR (Bobra et al., 2014). The vertical magnetic field component (Bz) was utilized for the flux estimation and as the lower boundary condition for potential field modeling. The HMI Bz data show significant errors, especially in the negative-polarity umbra of the following sunspot. We used an interpolation method to replace the defective data with fitting values. According to our calculations, the maximum difference between the fluxes from the original and corrected data is only 2%, which does not affect our conclusions. To better show the similarities of the homologous flares, we de-rotated the AIA data for four X-flares (XF2–XF5; see Table 1) to the same time (October 23 15:00 UT).
3 Results
3.1 Statistics of the Major Flares
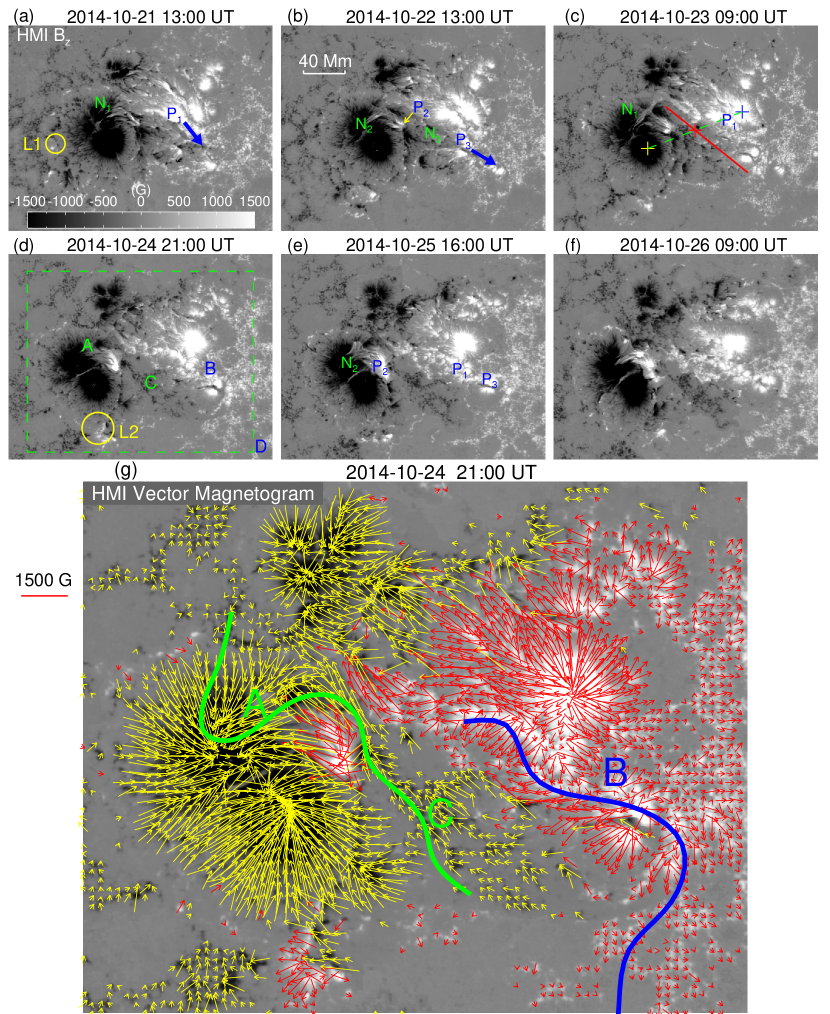
The related information of the six X-flares (XF1–XF6) and twenty-nine M-flares (MF1–MF29) are listed in Table 1. The mean duration (from the start to end time based on SXR event list111http://hesperia.gsfc.nasa.gov/goes/goes-event-listings/) of the X-flares is 69 minutes, which is longer than that (32 minutes) of the M-flares. By checking the AIA data, we find that not all the flares originated from the AR core. Five M-flares appeared at two locations (L1 and L2; see Figures 1(a) and (d)) on the AR periphery. MF4 and MF7 occurred at L1; MF11, MF20, and MF25 took place at L2. Among the thirty-five flares, only MF11 produced a CME. Jet activities were observed in the four periphery flares MF4, MF7, MF11, and MF20.
3.2 Photospheric Magnetic Field Evolution
The HMI Bz maps in Figures 1(a)–(f) present the general evolution of AR 12192 from October 21 to 26. We notice that three pairs of magnetic fluxes (labeled with “N1P1”, “N2P2”, and “N3P3” in Figure 1) appeared in the AR core. In the AIA 94 Å image (see Figure 3(d)), it can be seen that some coronal loops connected N1 (N3) and P1 (P3). The HMI vector magnetic field data (Figure 1(g)) also reveals the connectivity between N2 and P2. Figure 1 shows that the negative and positive fluxes of N1P1 and N3P3 were respectively located at two sides of the AR prime PIL. As the AR developed, P1 and P3 moved southwest along the direction approximately parallel to the AR prime PIL and gradually decayed. It is apparent that this kind of shearing motions of photospheric fluxes would result in the shear formation and strengthening of the coronal field in the AR. In Figure 1(g), we also see that the horizontal field in the AR core were basically aligned with the AR prime PIL. Different from N1P1 and N3P3, N2P2 appeared near the prime following sunspot of the AR. During its emergence, it collided and partly canceled out with the ambient magnetic field.
3.3 Jets Associated with the Flares
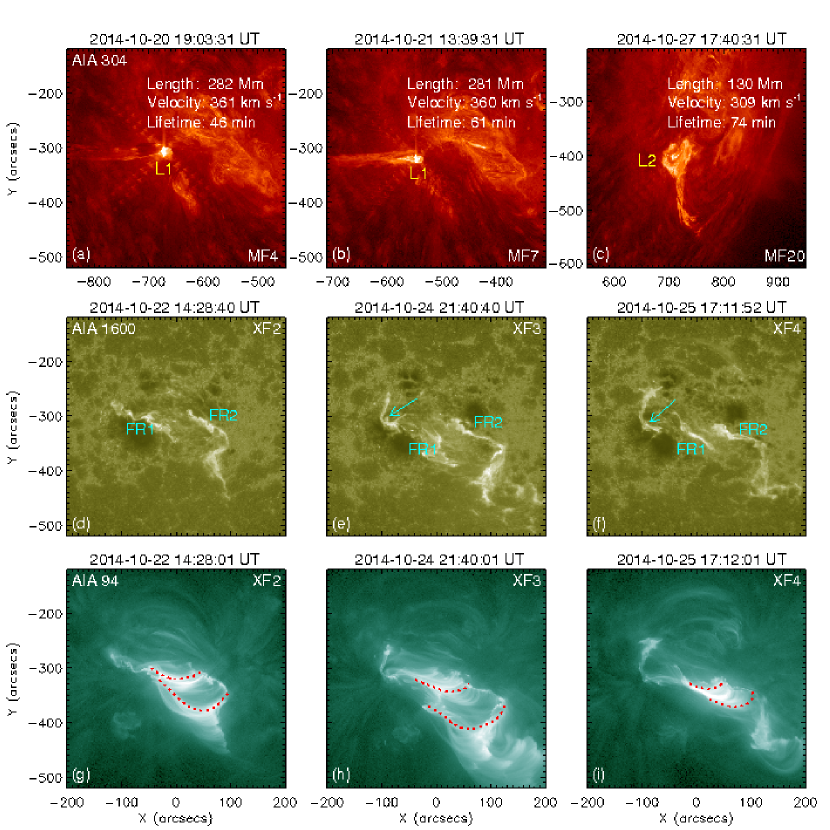
Four jets occurred from L1 and L2. Using the AIA 304 Å filtergrams, we display the four jets and their accompanying flares in Figures 2(a)–(c) (MF4, MF7, and MF20, respectively) and Figures 3(a)–(c) (MF11). In the AIA 171 Å channel (see animation 2), both bright and dark features were observed along the open field or the legs of large-scale coronal loops to form the jets. The maximum projected lengths of the four jets are 282, 281, 130, and 569 Mm (beyond the FOV of AIA), respectively; their respective mean velocities (the maximum projected lengths divided by the corresponding durations) are 3611, 3603, 3096, and 3793 km s-1; and they separately have lifetimes of 46, 61, 74, and 172 minutes. Compared to the surges or jets studied by Chen et al. (2008), which also occurred at the AR border but with microflares, the speeds, spatial scales, and lifetimes found here are evidently greater. The HMI Bz data clearly show that the magnetic fluxes of different polarities emerged, converged, and canceled with each other at the base of the jets before the associated flares. Similar results were also found in earlier studies (e.g., Jiang et al., 2007; Chen et al., 2008).
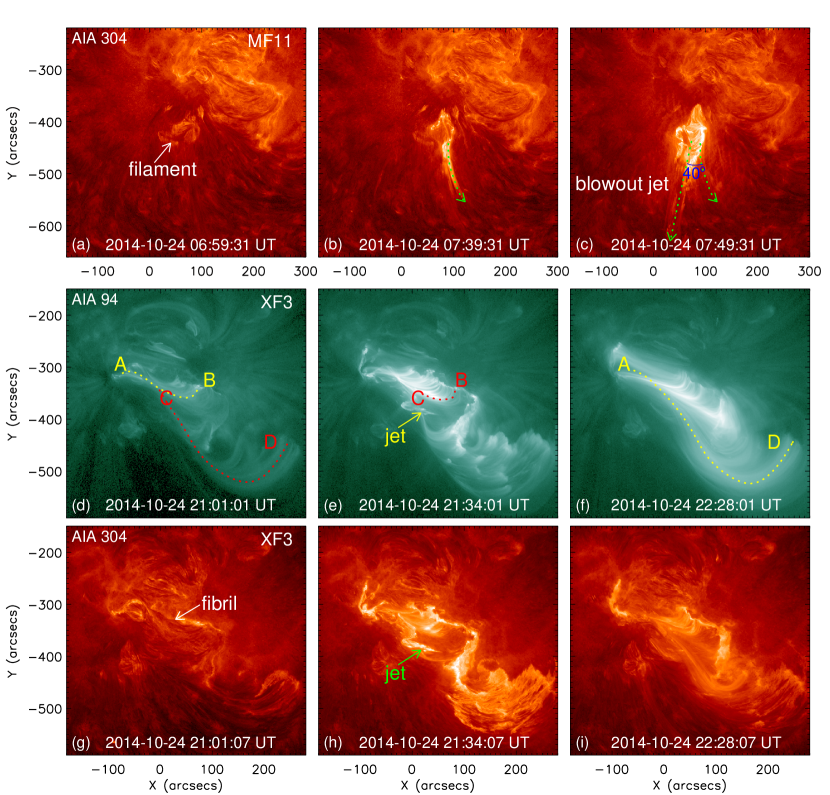
MF11 is the only one followed by a CME, for which 222http://sidc.be/cactus lists a median velocity of 496 km s-1. From Figure 3(a), we can see that a small arch filament existed at the flare source region before the onset of MF11. As the flare occurred, the hot plasma was ejected southwest at first (as shown by the curved arrows in Figures 3(b) and (c)) and then spurted out southeast more radially (as indicated by the straight arrow in Figure 3(c)). The 171 Å filtergrams (see animation 4) clearly reveal that the ejected plasma moved along one leg of a large-scale loop at the beginning and then turned to the ambient open field. According to our measurement, the projected deflection angle of the ejection direction is 40. After MF11, the arch filament disappeared, indicating its participation in the ejection. According to Moore et al. (2010), this jet is very likely a blowout jet, in which the small arch filament underwent a miniature version of a blowout eruption and produced the subsequent CME (e.g., Hong et al., 2011; Pucci et al., 2013).
3.4 Tether-cutting Reconnection Triggering the Homologous Confined Flares
Among the thirty flares from the AR core, we mainly focused on the four on-disk X-flares (XF2–XF5). These flares exhibited similar flaring structures (see the animation 3), indicating they are likely homologous flares. Coronal emission associated to three of the homologous flares (XF2–XF4) are shown in Figures 2(d)–(f) and Figures 2(g)–(i), respectively. The AIA 1600 Å images clearly display their two-ribbon structure (FR1 and FR2), which show great similarities concerning spatial distribution and morphology. In comparison with XF2, the northeastern ends of FR1 in XF3 and XF4 turned to north to extend, which might be related to the newly emerged N2P2. In the 94 Å images, sensing hot flare plasma at a characteristic temperature of 6.3 MK, bright (flare) loops (their apparent projected shape indicated by the dotted lines in Figures 2(g)-(i)) connecting FR1 and FR2 suggest a complex, non-potential field geometry, which are different from the usual post-flare loops in the eruptive flares. This implies that only a little portion of the non-potential energy was released during these confined flares, which is consistent with the model results reported by Thalmann et al. (2015) and Sun et al. (2015).
It is very likely that TC reconnection triggered these homologous flares. As an example, we display the evolution of XF3 in Figures 3(d)–(f) and Figures 3(g)–(i), which correspond to the 94 Å and 304 Å images respectively. In 94 Å, it can be seen that some sheared magnetic arcades existed in the AR core prior to the flare. We outline two sheared loop systems (“AB” and “CD”) in Figure 3(d). Figure 1(d) shows the locations of their ends in the photosphere. It is evident that AB and CD straddled the AR prime PIL and connected the opposite-polarity field on the two sides. As the flare started and developed, AB reconnected with CD, which led to the formations of the small flaring loop BC (Figure 3(e)) and large-scale loop structure AD (Figure 3(f)). Meanwhile, a jet along CB was also observed not only in the hot 94 Å line (Figure 3(e)) but also in the cool 304 Å channel (Figure 3(h)), which provides the evidence of magnetic reconnection. Figure 3(f) shows that the post-flare loops still retained a highly-sheared topological structure, which made possible the next homologous energy release. In Figure 3(g), some filament fibrils were almost aligned with the AR PIL before the flare. However, the detailed 304 Å data reveal that these fibrils were not affected by the eruption, suggesting a relatively-high reconnection site in the flare. This is in agreement with what was suggested by Thalmann et al. (2015), based on the large initial separation of the associated flare ribbons. Our results strongly support the TC reconnection mechanism. In addition, the newly emerging flux tubes reconnecting with pre-existing coronal loops may also play a role as the enhanced emission of the loops nearby N2P2 was detected before the flare (see animation 5).
3.5 Strong Confinement from the Overlying Background Field
One outstanding feature of AR 12192 is its poor CME production rate, despite the many major flares observed during its disk passage. According to the previous studies (e.g., Fan & Gibson, 2007), the confinement from the overlying background field of AR may play an important role in these confined flares. Utilizing the HMI Bz maps, the potential field extrapolation of AR 12192 is derived from the Green’s function method (Chiu & Hilton, 1977; Metcalf et al., 2008). We calculate the decay index of the horizontal extrapolated field Bh along a reference line (see Figure 1(c)), the orientation of which is basically aligned with the AR prime PIL and changes with the AR evolution. To determine the reference line in a certain Bz map, we firstly obtain the positions of the maximum positive and negative fluxes. Then, we connect them and plot the reference line with a fixed length through the midpoint. The angle we chose between the reference line and connecting line is 60. With this choice, the direction of the AR prime PIL is outlined best in most of the cases.
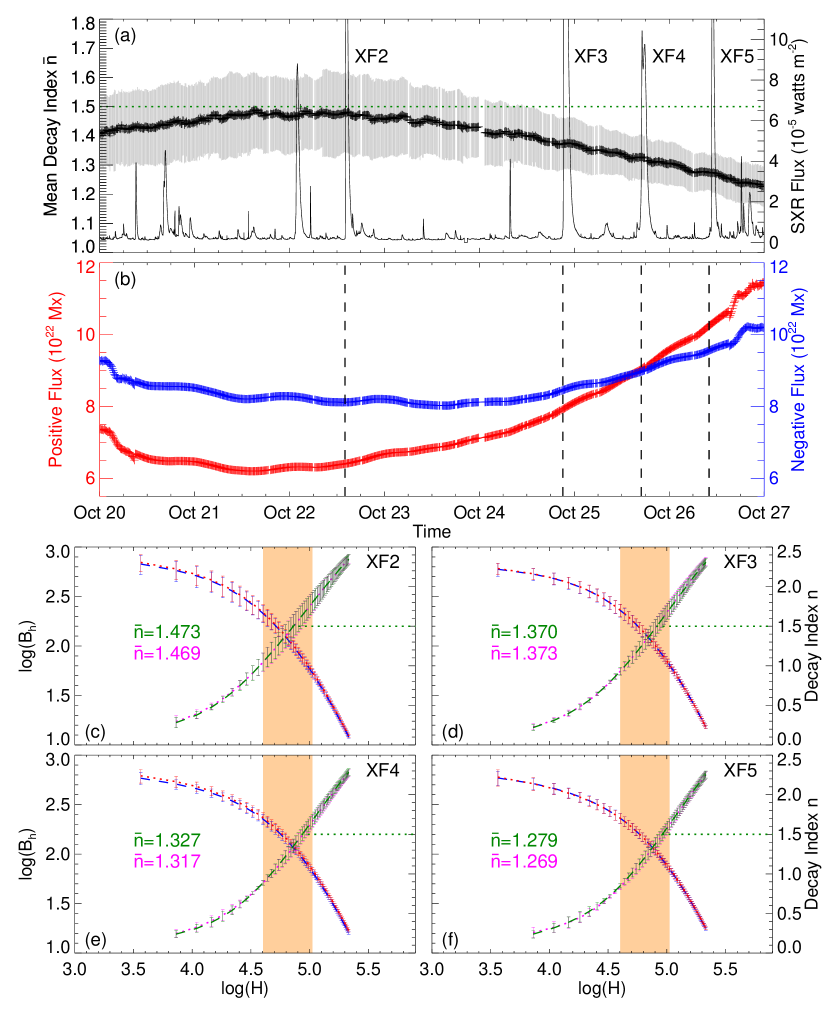
Generally, varies with the height above the photosphere. By checking two limb flare cases (MF1 and XF1), we find that the height ranges of the erupting flare loops are respectively 47–115 Mm and 78–110 Mm, comparable to the result of 42–105 Mm suggested by Liu (2008) and Xu et al. (2012). In this study, we therefore calculate the mean values of for the height range 40–105 Mm above the photosphere at every point along the reference line firstly and then average them to derive the mean decay index , the time variation of which is displayed in Figure 4(a). We only calculate from October 20 to 26, during which the longitude of the AR center was within E42–W46. It can be seen that all is always less than 1.5, the lower limit of the typical threshold for torus instability onset (Kliem & Török, 2006; Liu, 2008). Even taking the uncertainties into account, the maximum of is 1.63 and does not exceed the upper limit (2.0) of the threshold. From October 20 to 22, increases from 1.41 to 1.50 firstly and then keeps stable for about 20 hr. After October 22 14:00 UT, begins to decline and finally reaches a value of 1.23 at the end of October 26. We point out that different from previous studies (e.g., Liu, 2008; Xu et al., 2012; Sun et al., 2015), we firstly calculate and analyze the time evolution of the mean decay index of an AR horizontal background field during a long period (7 days).
Figure 4(b) displays the time profiles of the positive (red pluses) and unsigned negative (blue pluses) vertical fluxes of the whole AR during the same period. From October 20 to 26, both the positive and unsigned negative fluxes decrease at first and then are enhanced gradually, which seems to have an inversed time evolution of . Since the background potential field of AR might be strengthened (weakened) with the emergence (cancelation) of the photospheric fluxes, this result seems reasonable. The similar magnitude of the total positive and total unsigned negative flux also suggests a relatively close coronal field structure of the AR.
Figures 4(c)–(f) show the height profiles of Bh about 1 hr before the start (blue dashed line) and 1 hr after the end (red dotted line) of XF2–XF5, respectively. The decay indices (averaged along the reference line) derived from Bh are displayed by the green dashed (pre-flare) and purple dotted (post-flare) curves in the four panels. The strength and height are in logarithm units. It is apparent that there are little changes of Bh and during the flares. Correspondingly, the mean decay indices before and after the flares are also similar (see the green and purple values of in Figures 4(c)–(f)). According to our results, are 1.470.14, 1.370.09, 1.320.07, and 1.270.07 for the four confined X-flares XF2–XF5, respectively. Within the uncertainty ranges, our results agree with those of Sun et al. (2015).
4 Summary and Discussion
We made a statistics of six X-flares and twenty-nine M-flares in AR 12192 from October 18 to 29 and performed a detailed investigation to four of the X-flares and four of the M-flares. Our main results are as follows:
-
1.
From October 20 to 26, the background field of AR 12192 remained at a strong level. The mean decay index of the horizontal potential field in a vertical plane aligned with the prime PIL and within the height range of 40–105 Mm varied in the range [1.23, 1.50], implying that a strong confinement from the overlying magnetic field may play an important role in the poor CME production of the AR. This is in agreement with the findings of Sun et al. (2015) and Thalmann et al. (2015) for the individual cases XF3 and XF2, respectively.
-
2.
Four periphery M-flares were accompanied by jets. The emergences and cancelations of the photospheric fluxes with different magnetic polarities were observed at the roots of the jets, supporting the standard model for solar coronal jets (e.g., Moore et al., 2010; Chen et al., 2012; Pariat et al., 2015).
-
3.
In HMI Bz maps, the apparent shearing motions of emerged photospheric fluxes were found in the AR core. This might have established a coronal field configuration suitable for TC reconnection, which was observed in four homologous confined X-flares. These observations are well consistent with the TC model described in Moore et al. (2001).
TC reconnection is a possible way to trigger solar eruptions (e.g., Liu et al., 2010; Sterling et al., 2011; Amari et al., 2014). Chen et al. (2014) exhibited a detailed process of TC reconnection during a major event, which was followed by a halo CME. However, as reported here, CME would not always appear in the eruptions triggered by TC reconnection (Aulanier et al., 2010). Several similar observational cases with weak flares have been discussed in Moore et al. (2001) and Chen et al. (2014). To our knowledge, we firstly report that successive strong X-flares were triggered by TC reconnection, but not yielded any partial or full eruptions.
References
- Amari et al. (2014) Amari, T., Canou, A., & Aly, J.-J. 2014, Nature, 514, 465
- Aulanier et al. (2010) Aulanier, G., Török, T., Démoulin, P., & DeLuca, E. E. 2010, ApJ, 708, 314
- Bateman (1978) Bateman, G. 1978, MHD instabilities, ed. G. Bateman (Cambridge, MA: MIT Press)
- Bobra et al. (2014) Bobra, M. G., Sun, X., Hoeksema, J. T., et al. 2014, Sol. Phys., 289, 3549
- Chen et al. (2008) Chen, H. D., Jiang, Y. C., & Ma, S. L. 2008, A&A, 478, 907
- Chen et al. (2013) Chen, H., Ma, S., & Zhang, J. 2013, ApJ, 778, 70
- Chen et al. (2014) Chen, H., Zhang, J., Cheng, X., et al. 2014, ApJ, 797, L15
- Chen et al. (2012) Chen, H.-D., Zhang, J., & Ma, S.-L. 2012, Research in Astronomy and Astrophysics, 12, 573
- Chiu & Hilton (1977) Chiu, Y. T., & Hilton, H. H. 1977, ApJ, 212, 873
- Deng et al. (2006) Deng, N., Xu, Y., Yang, G., et al. 2006, ApJ, 644, 1278
- Fan & Gibson (2007) Fan, Y., & Gibson, S. E. 2007, ApJ, 668, 1232
- Guo et al. (2010) Guo, Y., Ding, M. D., Schmieder, B., et al. 2010, ApJ, 725, L38
- Hagyard et al. (1984) Hagyard, M. J., Teuber, D., West, E. A., & Smith, J. B. 1984, Sol. Phys., 91, 115
- Hoeksema et al. (2014) Hoeksema, J. T., Liu Y., & Hayashi, K., et al. 2014, Sol. Phys., 289, 3483
- Hong et al. (2011) Hong, J., Jiang, Y., Zheng, R., et al. 2011, ApJ, 738, L20
- Ji et al. (2003) Ji, H., Wang, H., Schmahl, E. J., Moon, Y.-J., & Jiang, Y. 2003, ApJ, 595, L135
- Jiang et al. (2007) Jiang, Y. C., Chen, H. D., Li, K. J., Shen, Y. D., & Yang, L. H. 2007, A&A, 469, 331
- Kliem & Török (2006) Kliem, B., & Török, T. 2006, Physical Review Letters, 96, 255002
- Lemen et al. (2012) Lemen, J. R., Title, A. M., Akin, D. J., et al. 2012, Sol. Phys., 275, 17
- Liu et al. (2010) Liu, R., Liu, C., Wang, S., Deng, N., & Wang, H. 2010, ApJ, 725, L84
- Liu (2008) Liu, Y. 2008, ApJ, 679, L151
- Metcalf et al. (2008) Metcalf, T. R., De Rosa, M. L., Schrijver, C. J., et al. 2008, Sol. Phys., 247, 269
- Moore et al. (2010) Moore, R. L., Cirtain, J. W., Sterling, A. C., & Falconer, D. A. 2010, ApJ, 720, 757
- Moore et al. (2001) Moore, R. L., Sterling, A. C., Hudson, H. S., & Lemen, J. R. 2001, ApJ, 552, 833
- Netzel et al. (2012) Netzel, A., Mrozek, T., Kołomański, S., & Gburek, S. 2012, A&A, 548, A89
- Pariat et al. (2015) Pariat, E., Dalmasse, K., DeVore, C. R., Antiochos, S. K., & Karpen, J. T. 2015, A&A, 573, A130
- Pucci et al. (2013) Pucci, S., Poletto, G., Sterling, A. C., & Romoli, M. 2013, ApJ, 776, 16
- Schou et al. (2012) Schou, J., Scherrer, P. H., Bush, R. I., et al. 2012, Sol. Phys., 275, 229
- Schrijver et al. (2005) Schrijver, C. J., De Rosa, M. L., Title, A. M., & Metcalf, T. R. 2005, ApJ, 628, 501
- Shen et al. (2011) Shen, Y.-D., Liu, Y., & Liu, R. 2011, Research in Astronomy and Astrophysics, 11, 594
- Sterling et al. (2011) Sterling, A. C., Moore, R. L., & Freeland, S. L. 2011, ApJ, 731, L3
- Sui et al. (2004) Sui, L., Holman, G. D., & Dennis, B. R. 2004, ApJ, 612, 546
- Sun et al. (2012) Sun, X., Hoeksema, J. T., Liu, Y., et al. 2012, ApJ, 748, 77
- Sun et al. (2015) Sun, X., Bobra, M. G., Hoeksema, J. T., et al. 2015, ApJ, 804, L28
- Thalmann et al. (2015) Thalmann, J. K., Su, Y., Temmer, M., & Veronig, A. M. 2015, ApJ, 801, L23
- Török & Kliem (2005) Török, T., & Kliem, B. 2005, ApJ, 630, L97
- van Driel-Gesztelyi & Culhane (2009) van Driel-Gesztelyi, L., & Culhane, J. L. 2009, Space Sci. Rev., 144, 351
- Vršnak (2008) Vršnak, B. 2008, Annales Geophysicae, 26, 3089
- Wang et al. (2002) Wang, H., Spirock, T. J., Qiu, J., et al. 2002, ApJ, 576, 497
- Wang (1994) Wang, J. 1994, Sol. Phys., 155, 285
- Wang & Zhang (2007) Wang, Y., & Zhang, J. 2007, ApJ, 665, 1428
- Xu et al. (2012) Xu, Y., Liu, C., Jing, J., & Wang, H. 2012, ApJ, 761, 52
- Yang et al. (2014) Yang, S., Zhang, J., & Xiang, Y. 2014, ApJ, 793, L28
- Zhang et al. (2007) Zhang, J., Li, L., & Song, Q. 2007, ApJ, 662, L35
- Zhang et al. (2012) Zhang, J., Yang, S., Liu, Y., & Sun, X. 2012, ApJ, 760, L29
| Event | Date | Start Time | Peak Time | Duration | Location | CME | Other | |
|---|---|---|---|---|---|---|---|---|
| (UT) | (UT) | (minutes) | Level | in AR | Production | Activities | ||
| X-class Flares: | ||||||||
| XF1 | 19-Oct-2014 | 04:17 | 05:03 | 91 | X1.1 | core | No | |
| XF2 | 22-Oct-2014 | 14:02 | 14:28 | 48 | X1.6 | core | No | |
| XF3 | 24-Oct-2014 | 21:07 | 21:41 | 66 | X3.1 | core | No | |
| XF4 | 25-Oct-2014 | 16:55 | 17:08 | 76 | X1.0 | core | No | |
| XF5 | 26-Oct-2014 | 10:04 | 10:56 | 74 | X2.0 | core | No | |
| XF6 | 27-Oct-2014 | 14:12 | 14:47 | 57 | X2.0 | core | No | |
| M-class Flares: | ||||||||
| MF1 | 18-Oct-2014 | 07:02 | 07:58 | 107 | M1.6 | core | No | |
| MF2 | 20-Oct-2014 | 09:00 | 09:11 | 20 | M3.9 | core | No | |
| MF3 | 20-Oct-2014 | 16:00 | 16:37 | 55 | M4.5 | core | No | |
| MF4 | 20-Oct-2014 | 18:55 | 19:02 | 9 | M1.4 | periphery (L1aaMarked by the yellow circle in Figure 1(a).) | No | jet |
| MF5 | 20-Oct-2014 | 19:53 | 20:04 | 20 | M1.7 | core | No | |
| MF6 | 20-Oct-2014 | 22:43 | 22:55 | 30 | M1.2 | core | No | |
| MF7 | 21-Oct-2014 | 13:35 | 13:38 | 5 | M1.2 | periphery (L1) | No | jet |
| MF8 | 22-Oct-2014 | 01:16 | 01:59 | 72 | M8.7 | core | No | |
| MF9 | 22-Oct-2014 | 05:11 | 05:17 | 10 | M2.7 | core | No | |
| MF10 | 23-Oct-2014 | 09:44 | 09:50 | 12 | M1.1 | core | No | |
| MF11 | 24-Oct-2014 | 07:37 | 07:48 | 16 | M4.0 | periphery (L2bbMarked by the yellow circle in Figure 1(d).) | Yes | jet |
| MF12 | 26-Oct-2014 | 17:08 | 17:17 | 22 | M1.0 | core | No | |
| MF13 | 26-Oct-2014 | 18:07 | 18:15 | 13 | M4.2 | core | No | |
| MF14 | 26-Oct-2014 | 18:43 | 18:49 | 13 | M1.9 | core | No | |
| MF15 | 26-Oct-2014 | 19:59 | 20:21 | 46 | M2.4 | core | No | |
| MF16 | 27-Oct-2014 | 00:06 | 00:34 | 38 | M7.1 | core | No | |
| MF17 | 27-Oct-2014 | 01:44 | 02:02 | 27 | M1.0 | core | No | |
| MF18 | 27-Oct-2014 | 03:35 | 03:41 | 13 | M1.3 | core | No | |
| MF19 | 27-Oct-2014 | 09:59 | 10:09 | 27 | M6.7 | core | No | |
| MF20 | 27-Oct-2014 | 17:33 | 17:40 | 14 | M1.4 | periphery (L2) | No | jet |
| MF21 | 28-Oct-2014 | 02:15 | 02:42 | 53 | M3.4 | core | No | |
| MF22 | 28-Oct-2014 | 03:23 | 03:32 | 18 | M6.6 | core | No | |
| MF23 | 28-Oct-2014 | 13:54 | 14:06 | 29 | M1.6 | core | No | |
| MF24 | 29-Oct-2014 | 06:03 | 08:20 | 169ccThe unorthodoxly long duration is due to multiple energy releases. | M1.0 | core | No | |
| MF25 | 29-Oct-2014 | 09:54 | 10:01 | 12 | M1.2 | periphery (L2) | No | |
| MF26 | 29-Oct-2014 | 14:24 | 14:33 | 27 | M1.4 | core | No | |
| MF27 | 29-Oct-2014 | 16:06 | 16:20 | 27 | M1.0 | core | No | |
| MF28 | 29-Oct-2014 | 18:47 | 18:50 | 5 | M1.3 | core | No | |
| MF29 | 29-Oct-2014 | 21:18 | 21:22 | 7 | M2.3 | core | No | |