Frequency-Dependent Selection at Rough Expanding Fronts
Abstract
Microbial colonies are experimental model systems for studying the colonization of new territory by biological species through range expansion. We study a generalization of the two-species Eden model, which incorporates local frequency-dependent selection, in order to analyze how social interactions between two species influence surface roughness of growing microbial colonies. The model includes several classical scenarios from game theory. We then concentrate on an expanding public goods game, where either cooperators or defectors take over the front depending on the system parameters. We analyze in detail the critical behavior of the nonequilibrium phase transition between global cooperation and defection and thereby identify a new universality class of phase transitions dealing with absorbing states. At the transition, the number of boundaries separating sectors decays with a novel power law in time and their superdiffusive motion crosses over from Eden scaling to a nearly ballistic regime. In parallel, the width of the front initially obeys Eden roughening and, at later times, passes over to selective roughening.
pacs:
02.50.Le, 68.35.Ct, 68.35.Rh, 87.18.Hf, 87.23.-nI Introduction
Living species are usually confined to their territory, a spatial region defined by geographical borders, climate, or other environmental constraints. Uninhabited regions are colonized through range expansion, where individuals reproduce and disperse at the front of their territory Murray (2007). This process is seen in biological invasions Griffiths et al. (1991), as a result of shifting climate zones Loarie et al. (2009); Chen et al. (2011); Peacock et al. (2015), during colonizations in our own species’ history Stringer (2003); Liu et al. (2006); Moreau et al. (2011), tumor growth Murray (2007); Brú et al. (2003); Xavier (2011), and biofilm growth Hall-Stoodley et al. (2004); Nadell et al. (2009); Mitri et al. (2011). Evidently, expansions occur on very different spatial (micrometers to meters) and temporal (hours to millennia) scales.
In this article we aim to characterize range expansion under the influence of short-range “social interactions” of individuals at the front. Such interactions are present if success in reproduction depends on the presence of nearby individuals of the own and/or other species. Here, we set up a model for the expanding front based on evolutionary game theory Hofbauer and Sigmund (1998); Szabó and Fáth (2007); Frey (2009) and investigate its roughening dynamics for two interacting species. Besides exploring an interesting non-equilibrium growth process, we hope to contribute to interpreting experiments on range expansion in multi-species colonies of simple organisms.
In experiments, microbial growth is excellently suited to study range expansion and other processes in population dynamics and evolution such as spatial spread of infections and adaptation to an environment (see for example Ref. Buckling et al. (2009)). Microbes reproduce fast, their environment and genotype can be controlled, and experimental conditions are easily reproducible. Grown in a Petri dish, the spatial patterns of single-species microbial colonies have long been a rich field of study Shapiro (1995); Jacob et al. (1999); Golding et al. (1999); Matsushita et al. (1999); Matsuyama and Matsushita (2001). The observed patterns crucially depend on motility, availability of nutrients, and the growth medium, to name but a few. However, even under conditions of negligible motility and abundant nutrients a colony’s front is rough and has interesting statistical properties Vicsek et al. (1990); Wakita et al. (1997); Huergo et al. (2010).
Multi-species colonies are composed of more than one species and show additional intriguing features, even if the species are identical except for a marker Hallatschek et al. (2007). During reproduction they keep their marker but compete with other species for space at the front. Thereby, sectors of single species form, which are separated by boundaries. Their statistical and dynamic properties are determined by the evolving roughness of the expanding front Derrida and Dickman (1991); Saito and Müller-Krumbhaar (1995).
Usually, when two or more species of microbes live in a common environment, they influence each other during reproduction. In particular, reproductive success of any species, also called its fitness, depends on the population sizes of all the species. This constitutes “social interactions” between the species commonly referred to as frequency-dependent selection. Research in the field has initiated a wealth of fascinating experiments Crespi (2001); Velicer (2002); Griffin et al. (2004); Kreft (2004); West et al. (2007); Hibbing et al. (2010); Xavier (2011); Mitri and Richard Foster (2013) either in well-mixed liquid culture without any spatial order Griffin et al. (2004); Gore et al. (2009) or in the Petri dish, where the populations are spatially structured Müller et al. (2014); Van Dyken et al. (2013). Many of the experimental observations can be discussed within the framework of evolutionary game theory Hofbauer and Sigmund (1998); Szabó and Fáth (2007); Frey (2009). For example, light has been shed on a long-standing theoretical question in evolution Darwin (1859); Hofbauer and Sigmund (1998); Axelrod (2009); Szabó and Fáth (2007): Why do individuals cooperate if non-cooperators can exploit them? Literature emphasizes the importance of a population to be structured in groups Rainey and Rainey (2003); Chuang et al. (2009); Nowak et al. (1994); Ohtsuki et al. (2006); Szabó and Fáth (2007); Fu et al. (2010), for example, by spatial distance. While within a single group cooperators are always inferior to non-cooperating defectors, if the latter interact only with their neighborhood, distant large groups of cooperators will ultimately outcompete defectors. Some models also stress the central role of demographic fluctuations and of populations growing in size Melbinger et al. (2010); Cremer et al. (2012). Both, experiments and theory, explain the advantage of cooperators during colony growth by their ability to locally advance faster Xavier and Foster (2007); Nadell et al. (2010); Van Dyken et al. (2013), vividly termed “survival of the fastest” Van Dyken et al. (2013).
Cooperation between between nearby cells is often mediated by some biochemical compound (a public good) which the microbes release into the extracellular environment. This compound then promotes reproduction of neighboring cells. In general, a released substance may act beneficial or detrimental to other individuals, also depending on their species, and implies some cost to the producer. Examples include secretion of digestive invertase to break down sucrose Greig and Travisano (2004); Gore et al. (2009); H Koschwanez et al. (2011); Sen Datta et al. (2013), siderophores to scavenge iron from the environment Pattus and Abdallah (2000); Ratledge and Dover (2000); Griffin et al. (2004), polymers which support biofilms Rainey and Rainey (2003); Nadell and Bassler (2011); van Gestel et al. (2014), release of toxins Riley and Gordon (1999); Cornforth and Foster (2013) (sometimes through lysis Lee and Schneewind (2001); Weber et al. (2014)), surfactants which facilitate swarming Xavier et al. (2011), and the exchange of amino acids Müller et al. (2014).
This plethora of biochemical compounds, released by cells and affecting nearby cells, implies a wealth of specific features, which certainly are not covered by a single model. However, since the released biomolecules usually mediate short-range interactions between individuals, properties on large scales should be independent of microscopic details. Hence, we formulate a simple model which captures the essence of an interaction while ignoring complicated details. The classical Eden model Eden (1960); Barabási and Stanley (1995), a simple growth process on a lattice, has been used successfully to mimic growing cell colonies.. It generates a cluster (the colony), the surface of which exhibits scaling properties also found for expanding fronts of microbial colonies Plischke and Rácz (1985); Jullien and Botet (1985a). Extended to two identically growing but still distinguishable species, it generates sectors occupied by a single species only Saito and Müller-Krumbhaar (1995); Ali and Grosskinsky (2010). Indeed, this behavior is found for two-species microbial colonies Hallatschek et al. (2007). Moreover, boundaries between sectors move superdiffusively as in the experiments.
In this article we explore a generalization of the two-species Eden model, which incorporates local frequency-dependent selection. We thereby aim to analyze how social interactions influence surface roughness of growing microbial colonies. We set up an expanding public goods game, where either cooperators or defectors take over the front depending on the system parameters Hofbauer and Sigmund (1998); Szabó and Fáth (2007); Frey (2009). Right at the transition the front displays critical behavior, which we analyze in detail. In particular, we establish that our model belongs to a new universality class of phase transitions dealing with absorbing states. At the transition, the number of boundaries separating sectors decays with a novel power law in time and their superdiffusive motion crosses over from Eden scaling to a nearly ballistic regime. In parallel, the width of the front initially obeys Eden roughening and, at later times, passes over to what we call selective roughening.
The remainder of this article is organized as follows. To analyze multi-species microbial colony growth, we introduce the Eden model with frequency-dependent selection in Sec. II and analyze its phenomenology in Sec. III. We then concentrate on the expanding public goods game with its social dilemma in Sec. IV and analyze the critical behavior at the transition between long-term cooperation and long-term defection by applying statistical analysis. Finally, we discuss and summarize our findings in Sec. V.
II Eden Model with Frequency-Dependent Selection
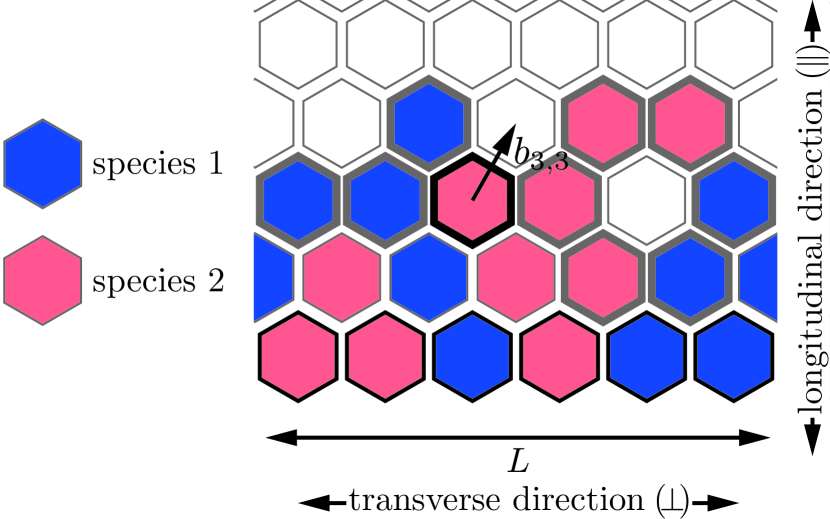
In this work we employ a lattice model (see Fig. 1) to analyze range expansion at rough fronts under the influence of frequency-dependent selection. We set up a cellular automaton on a two-dimensional hexagonal111On a square lattice it is impossible to enclose a cluster within a cluster , which only contains nearest neighbor sites of cluster A. On a hexagonal lattice this is possible. lattice of transverse extension and an infinite longitudinal extension. Periodic boundary conditions are applied in the transverse direction. The state of the system at time is specified by the state variables of lattice sites . Consider a system with two species (extension to more species is straightforward). For any time , any site is either empty () or occupied by an individual of either species 1 () or 2 (). All individuals which have at least one free nearest neighbor site can reproduce. To perform a reproduction step, we choose one of these fecund individuals with a probability proportional to its reproduction rate (see below) and a new individual of the same species is placed with equal probability on one of the free neighboring sites.
In contrast to the Eden model Eden (1960) and some of its two-species generalizations Saito and Müller-Krumbhaar (1995); Kuhr et al. (2011), reproduction rates in our model depend on the states of the nearest-neighbor sites. Let and denote the number of nearest neighbors of species 1 and 2, respectively, then the reproduction rate of an individual at lattice site is
| (1) |
Here, and are the respective contributions to the reproduction rates of species 1 and 2, which are independent of the states of their nearest neighbors. Frequency-dependent selection is introduced through the parameters , , , and .
With the reproduction rates we implement a random sequential update of the system using a simplified version of the Gillespie algorithm Gillespie (1976). The overall reproduction rate of the population is and an individual at site is selected to reproduce with probability . We then choose one of the empty nearest-neighbor sites of the reproducing individual at random and place there a new individual of the same species. This implies that there are no mutations. Since the mean time until the next reproduction event is , we update time by after each reproduction event. We assume that individuals do not die and that they are immobile. Therefore, any site with remains in its specific state indefinitely. As initial condition we occupy all sites of an initial line randomly, but in equal parts, with species 1 and 2, if not stated otherwise.
The formulated model generalizes version C of the Eden model, introduced by Jullien and Botet Jullien and Botet (1985b), to a two-species system. We already applied a similar model to range expansion without frequency-dependent selection but included the possibility of mutations Kuhr et al. (2011). If , , , and are zero, our model reduces to that of Saito and Müller-Krumbhaar Saito and Müller-Krumbhaar (1995), however they used a square lattice. Since diffusion is not included in the model, configurations and patterns behind the front are frozen. This corresponds to observations in microbial experiments on range expansion Hallatschek et al. (2007); Weber et al. (2014).
III Phenomenology
We now describe some generic examples of our model for growing microbial colonies (see Fig. 2), which emerge for typical parameter settings, and discuss their characteristic features. We then concentrate on so-called social dilemmas, where one species (defectors) exploits the other one (cooperators). Due to the spatial extent of our system, cooperators are able to outcompete defectors in a defined parameter region. This is in contrast to a single group, where all members interact with each other and, therefore, cooperators are always inferior to defectors.
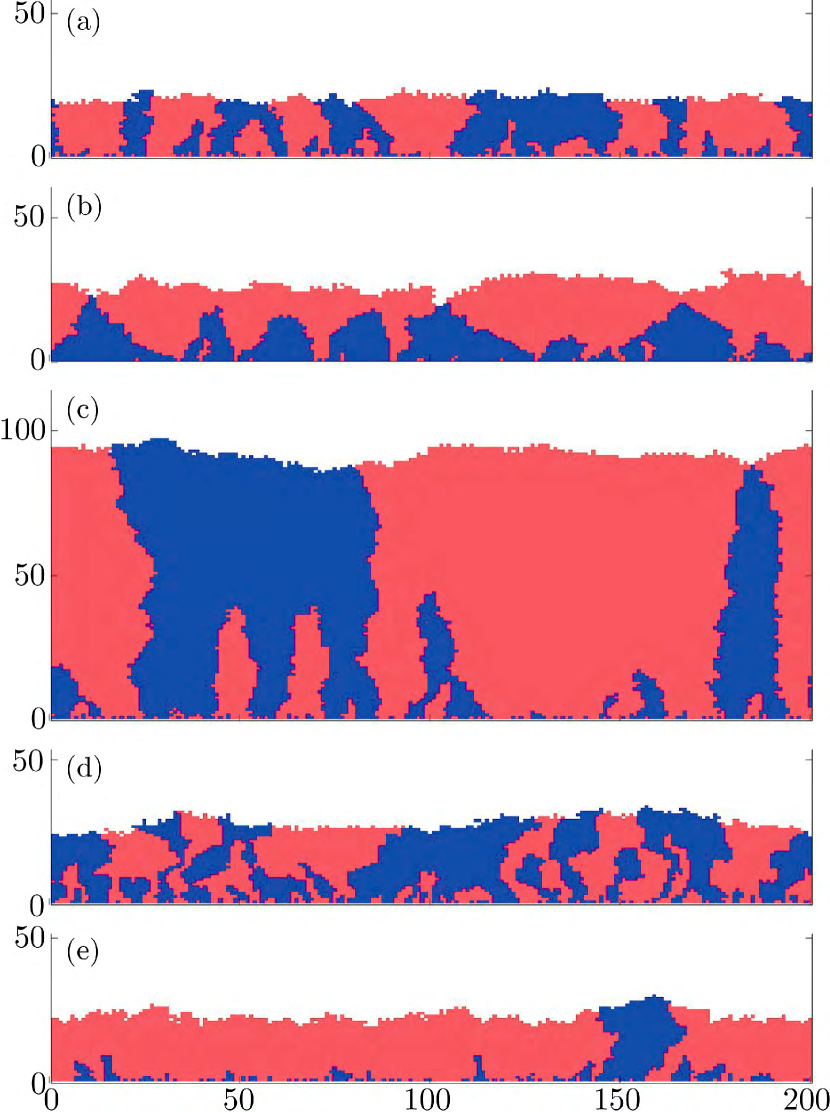
In the simplest case selection is frequency-independent, , and both species reproduce with the same rate, [see Fig. 2(a)]. For this “neutral” setting we observe roughening of the front typical for the Eden model Eden (1960); Barabási and Stanley (1995). Simultaneously, sectors composed of a single species merge and thereby coarsen Saito and Müller-Krumbhaar (1995); Ali and Grosskinsky (2010). This inherent process happens according to the following scenario. If the tips of two advancing boundary lines meet, they annihilateand the enclosed sector loses contact to the front. Consequently, the number of boundaries and sectors can only decrease. Sectors repeatedly coarsen as they merge in these events. When all boundaries have vanished, the front “has fixed” to a single species keeps on expanding. In finite systems, , fixation to a single species always occurs since in our stochastic model there is always a finite rate at which boundaries annihilate. Hence, two absorbing states exist. Eventually, the expanding front will fix either to species 1 or species 2.
In Fig. 2(b), species 2 has a larger reproduction rate, , and therefore a constant selective advantage. As the front expands faster at locations where it is composed of species 2, the roughness of the front increases. Indentations of the front usually are caused by sectors of species 1, whereas species 2 creates bulges. Furthermore, boundaries are biased such that sectors of species 2 widen while sectors of species 1 shrink laterally. Hence, sectors of species 2 merge and coarsen quickly. Eventually, the expanding front will fix to species 2, which has almost happened in Fig. 2(b).
If the reproduction rates depend on the state of nearest neighbors (frequency-dependent selection), new patterns arise. In this article we are mainly interested in frequency-dependent selection and therefore set from here on. We now discuss some interesting cases, see Fig. 2(c)–(d), which correspond to well-known settings in game theory Hofbauer and Sigmund (1998); Szabó and Fáth (2007); Frey (2009).
In coordination games (), see Fig. 2(c), the front expands slower near boundaries than in the centers of sectors. Therefore, indentations in the front are typically found where boundaries currently are or recently have been. After sectors have coarsened for some time, most individuals are located inside sectors. Therefore, most of them only have neighbors of their own kind, which raises the average reproduction rate and the overall front advances faster.
In snowdrift games (), see Fig. 2(d), the front expands faster near boundaries. They annihilate less frequent as compared to Fig. 2(c) since narrow sectors grow faster. Boundaries are also strongly twisted and associated with bulges of the front.
In this article we are mostly interested in social dilemmas where one species (called cooperators) raises the reproduction rate of all neighbors regardless of their species. The increased reproduction rate is called a public good in game theory, since it is of benefit to all nearby individuals, but it also costs resources. In contrast, the other species (called defectors) takes advantage of the public good for its own reproduction, but does not contribute to the reproduction of its neighbors in the same way. Defectors save resources for their own reproduction and therefore have an advantage. In this scenario defectors do not at all contribute to reproduction of their neighbors and, therefore, we set and just vary and . According to Eq. (1), these two parameters increase the respective reproduction rates of cooperators and defectors if they have cooperating neighbors. In Fig. 2(e) we present a setting, where species 2 (defectors) rapidly takes over large parts of the front. Defectors benefit from the initially large number of boundaries, where they take advantage of nearby cooperators, and conquer most of the front. Only cooperators, living in sufficiently large sectors, can keep up with the front during this early period and may then take over the front, depending on the parameter values.
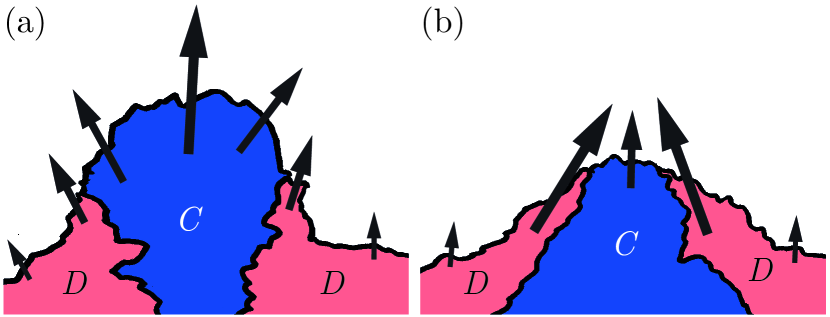
In a situation like this, it is not a priori clear if the front eventually fixes either to cooperators or to defectors. Depending on the values of and , cooperators can either outrun defectors and, from their advanced position at the front, overgrow their competitors laterally, see Fig. 3(a). Or, defectors cover cooperators with a thin layer and thereby take over the front, see Fig. 3(b). Close to the transition between both scenarios, the front displays increasing roughness since both species are able to take over while their fronts grow with different speeds. To characterize this transition quantitatively, we performed extensive simulations and applied methods from surface roughening Barabási and Stanley (1995); Krug and Spohn (1992); Halpin-Healy and Zhang (1995); Ódor (2004) and the theory of phase transitions dealing with absorbing states Henkel et al. (2008); Ódor (2004).
IV Expanding Public Goods Game: Critical Behavior
In this section we quantitatively analyze the transition between long-term cooperation and long-term defection for an expanding public goods game. As the transition is approached, several observables show critical scaling Henkel et al. (2008); Ódor (2004). Following our earlier work Kuhr et al. (2011), we perform finite-size scaling to localize the transition. Furthermore, we determine critical exponents and thereby establish a new universality class for the transition between the two adsorbing states. In the vicinity of the transition we also study the dynamics of the sector boundaries including the decline of their mean number during coarsening and their superdiffusive motion as well as the roughening of the expanding front.
IV.1 Finite-size scaling and phase diagram
As boundaries merge, sectors coarsen and the system progresses towards one of the two absorbing states. At finite system sizes this is a stochastic process and both adsorbing states are reached with a certain probability. However, in the thermodynamic limit, , the magnitude of fluctuations relative to the mean value goes to zero and one of the absorbing states is reached with certainty. We now use the method of finite-size scaling to determine the transition point between both states Henkel et al. (2008).
In Figure 4 we present the probability that the front fixes to cooperators and plot it versus for several lattice sizes at . We distinguish two regimes: one where cooperators dominate () and one where defectors take over. We locate the transition point at by .
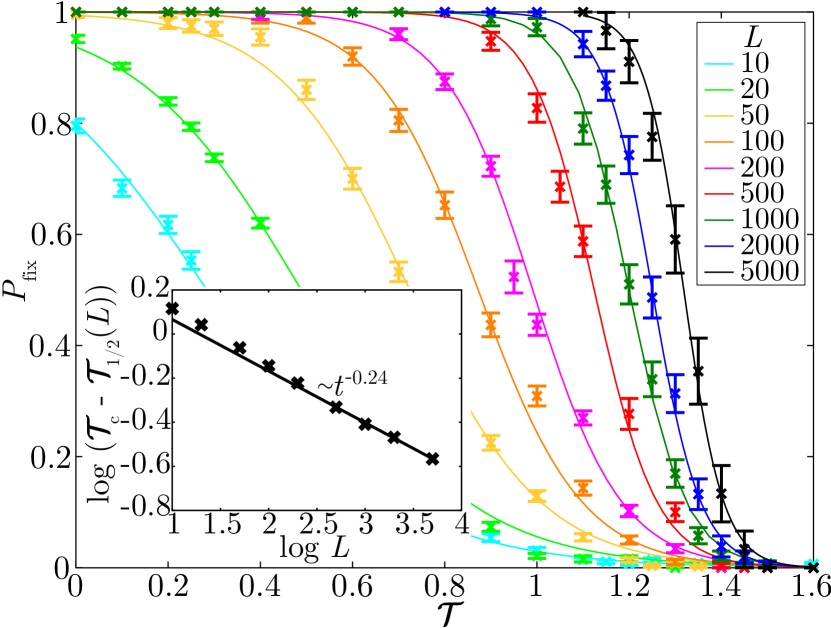
As , converges to a step function, since in infinite systems the absorbing states are reached with certainty. The step is positioned at . From the theory of critical scaling applied to absorbing states, we expect that close to the critical point the states of the lattice sites are correlated on the transverse distance . Approaching , diverges as , where is the distance to the critical point and is a critical exponent. For finite systems, an absorbing state is reached if
| (2) |
The transition occurs at and rearranging Eq. (2), we obtain
| (3) |
The characteristic length is related to the microscopic length scale, which here is the lattice constant, and details of our model. It is not important to the following analysis. The inset of Fig. 4 shows the best fit of our data to Eq. (3), which yields the critical exponent and the critical point at .
The above procedure can be repeated for different values of to map out the phase diagram (see Fig. 5).
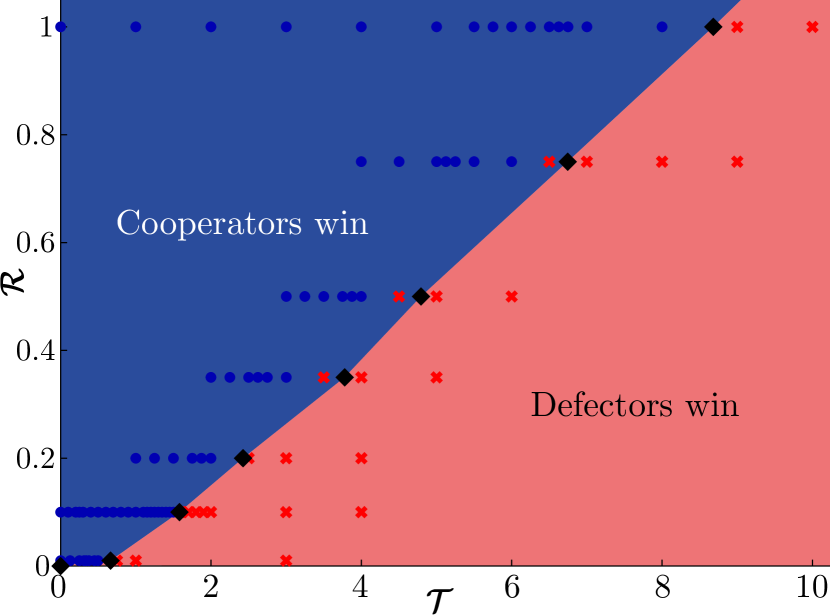
One realizes that the benefit of cooperators from their own species, , has a much more pronounced influence on the final state than the defectors’ benefit from cooperating neighbors, . This makes sense, since at large times the front contains large single-species sectors. Hence, the number of sector boundaries , where defectors can benefit from cooperators, is small: . Therefore, almost all cooperators have cooperating neighbors, while only a few defectors have this advantage. This is an example of “preferential assortment”, where the benefit of cooperation is almost entirely available to other cooperators Hamilton (1964a, b); Griffin et al. (2004); Kreft (2004); Nowak et al. (1994); Ohtsuki et al. (2006); Szabó and Fáth (2007); Fu et al. (2010). So, for a wide range of parameter combinations cooperators can indeed outcompete defectors. However, for large enough the dynamics at the boundaries still determines the final state of the front and defectors outcompete cooperators.
IV.2 Critical exponents of the phase transition
In the previous section IV.1 we already encountered the critical exponent . We now continue to determine further critical exponents of the phase transition. These exponents are universal. They only depend on the dimension of the system, the number of components of the order parameter, and symmetries of the model Henkel et al. (2008); Ódor (2004). They are independent of microscopic details and do not vary along a phase transition line. Our system has properties similar to “compact directed percolation” (CDP) Essam (1989). This is a stochastic process with a flat front, which also has two distinct absorbing states. Using this similarity, we proceed by determining critical exponents, which are known for CDP Henkel et al. (2008), and compare both models.
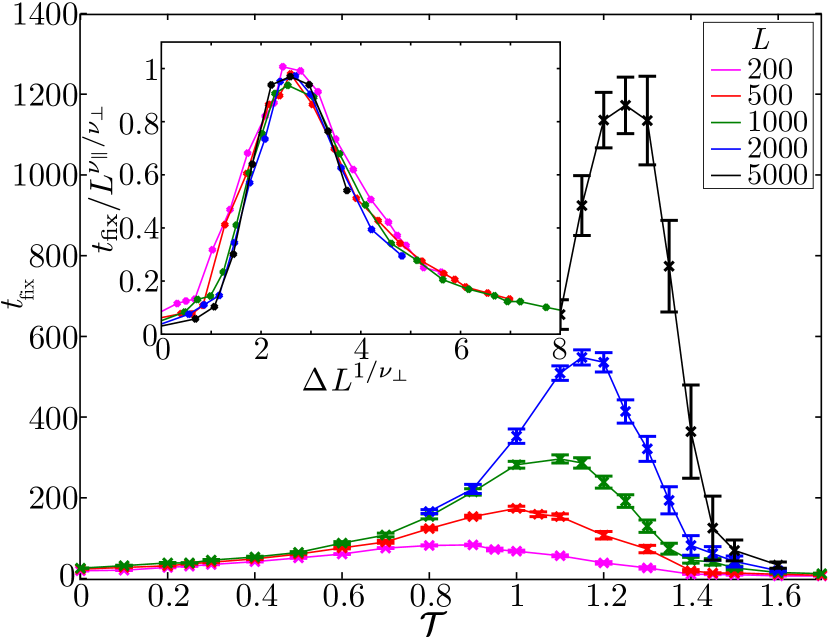
At the critical transition, , none of the two species has an advantage. Heterogeneous fronts, composed of more than one sector, exist for long times before the front fixes to one of the absorbing single-species states. This can be quantified by the mean time to fixation, , presented in Fig. 6. The data show that the fixation time has a maximum, the position and value of which grow with system size.
Along the longitudinal direction, in which the front propagates, states are correlated on the longitudinal distance . As before, we expect it to scale like close to the transition. Since the front propagates with a mean velocity, is proportional to a correlation time. Close to this time becomes very long, which is known as critical slowing down. Substituting Eq. (2) into , we find the scaling relation
| (4) |
We expect the mean fixation time to be proportional to the correlation time . Therefore, in the inset of Fig. 6 we plot rescaled by versus rescaled by . All curves of the main plot collapse on a single master curve for , and critical exponents and . The values of and are in good agreement with our fit to Eq. (3). So, fixation of the front is determined by the characteristic time
| (5) |
Two more critical exponents right at the transition are related to the survival probability of one species or state, which initially occupies a single site while all the other sites are occupied by the other state. We choose a single cooperator site in a line of defectors and determine the probability that after time there are still cooperators at the front and also calculate the average number of cooperator sites at the front, . In Fig. 7 we plot both quantities versus time for different defector benefit .
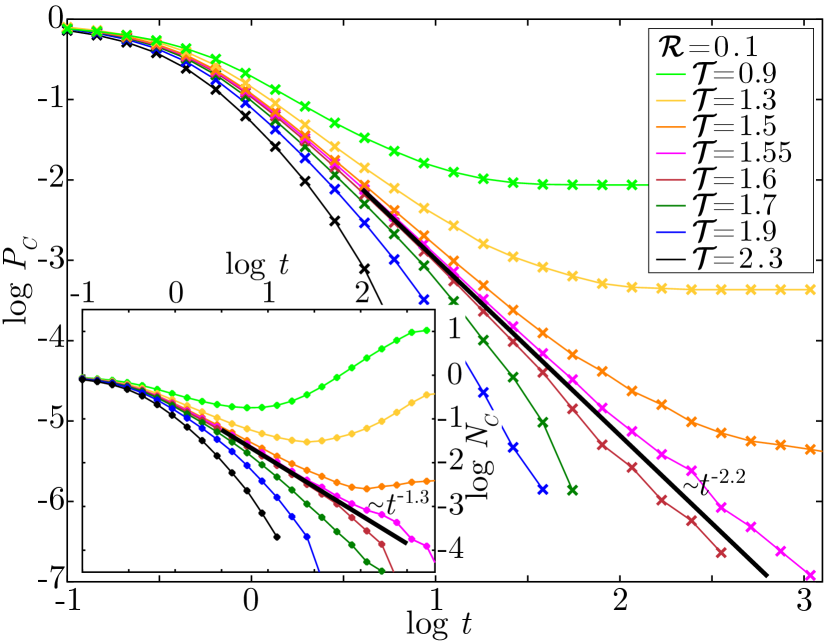
At the transition situated between and 1.6, we find that both and (see inset) decay with power laws in time: and . The respective best fits yield and . Using our result for , we find .
In general, in phase transitions to absorbing states the critical exponent governs the stationary density of “active sites”, when approaching the transition Henkel et al. (2008). In our case, the “active” sites can either be cooperators or defectors. Since the stationary state is either an all cooperator or an all defector front, the density jumps from 0 to 1 and, hence, is 0. Our results for all the critical exponents are summarized in Table 1.
The set of critical exponents determines the universality class of a phase transition. To our knowledge no other non-equilibrium transition has been found, which shares the same set of exponents. Hence, the transition between long-term cooperation and long-term defection in our expanding public goods game with frequency dependent selection constitutes a new universality class.
IV.3 Dynamics of boundaries
In this section we investigate the dynamics of the boundaries which separates sectors of cooperators and defectors from each other. In rough fronts the local front orientation is tilted against the main growth direction. When the front grows further, this tilt directs the movement of boundaries Saito and Müller-Krumbhaar (1995); Hallatschek et al. (2007). Ultimately, when two of them meet, they annihilate. In Fig. 8 we plot their mean number versus time for several values of the defector benefit . Right at the transition (dashed black line), shows a power law decay. We now discuss the different regimes in Fig. 8.
For neutral systems, where frequency-dependent selection is absent (), any inclination of the front is created by stochastic surface or Eden roughening Barabási and Stanley (1995); Krug and Spohn (1992); Halpin-Healy and Zhang (1995); Ódor (2004). The surface undulations obey KPZ-scaling Kardar et al. (1986) and thereby drive the decay of Saito and Müller-Krumbhaar (1995); Hallatschek et al. (2007). Boundaries move superdiffusively along the front with a mean-square displacement proportional to Derrida and Dickman (1991). On average, they annihilate after having traveled the mean distance between the boundaries, for which they need the time . Hence, boundaries annihilate with a rate proportional to , which implies
| (6) |
So, the number of boundaries decreases as
| (7) |
as already observed by Saito and Müller-Krumbhaar Saito and Müller-Krumbhaar (1995). This power law is excellently reproduced by our simulations in the case of neutral growth, , as illustrated by the solid black line in Fig. 8.
For and , species reproduce with different rates. Hence, the fronts of two neighboring sectors (occupied by different species) advance with different speeds. This influences the tilt of the front orientation, in addition to stochastic roughening in neutral systems, and thereby the movement of the separating boundary. Thus, we do not expect Eq. (6) to be valid.
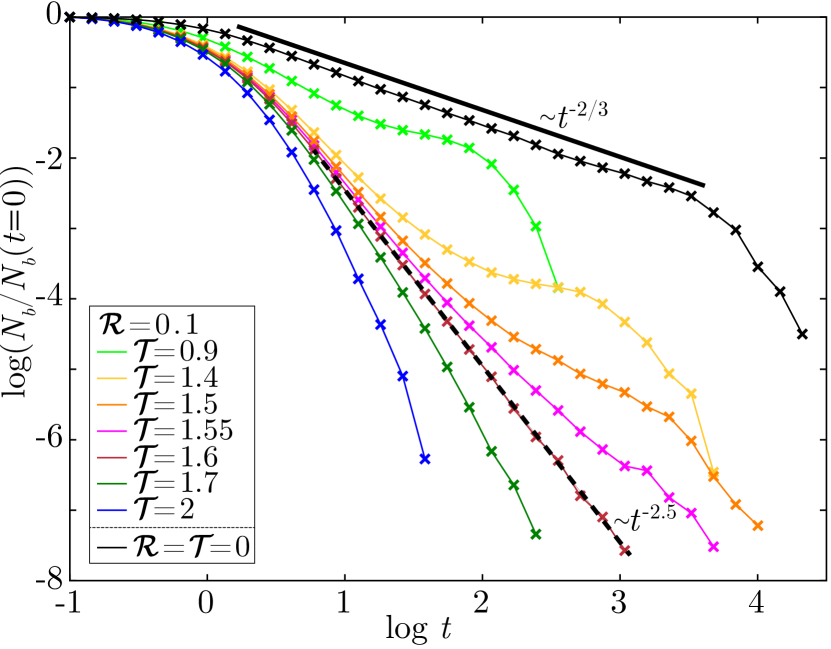
Indeed, Fig. 8 reveals different regimes for the mean number of boundaries . For , decays exponentially in time in line with the exponential decay of the survival probability in Fig. 7 and similar to the case of selective advantage in Ref. Saito and Müller-Krumbhaar (1995). For boundaries annihilate less frequently. Narrow defector sectors persist in the front dominated by cooperators since almost all individuals in the defector sectors have cooperating neighbors. This results in the upward curvature of the curves in Fig. 8. However, the defector sectors cannot expand laterally and ultimately loose contact to the front due to random fluctuations, and declines exponentially. At the number of boundaries decreases with a power law , where a new exponent appears. This power law implies that the number of boundaries declines from the initial value to the order of 1 in the coarsening time
| (8) |
Comparing with Eq. (5) reveals . This suggests that for large systems fixing the front to one species takes much longer than coarsening to a few sectors. Hence, the few remaining boundaries move differently compared to early times since they have to annihilate to fix the front to a single species.
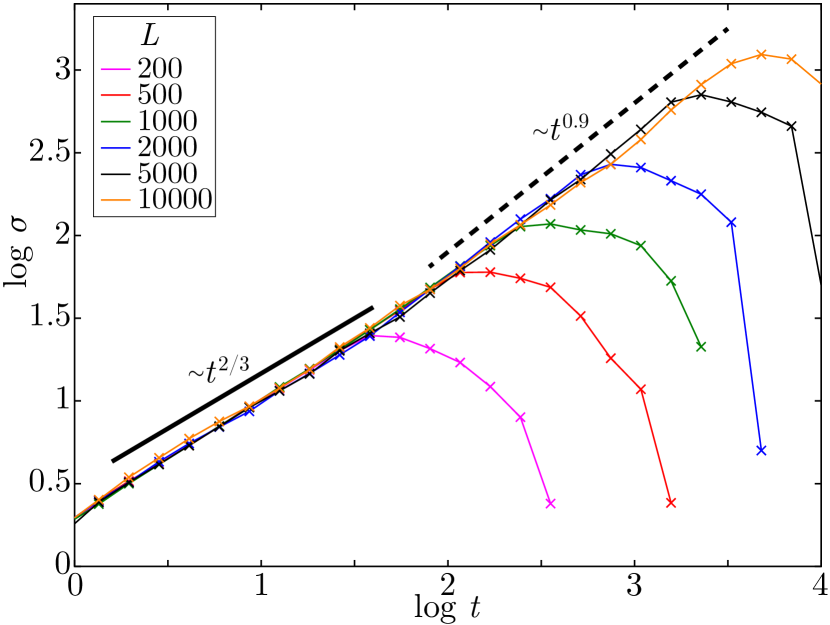
To check if this is the case, we employ the initial condition, where the front is composed of only two sectors of size each, separated by two boundaries. We quantify the boundaries’ random motion by monitoring the temporal evolution of the standard deviation for the transverse distance ,
| (9) |
We subtract the mean distance to take care of any transient drift, when the front relaxes from its initially flat to the rough shape, and an expected small drift if is not exactly .
From Fig. 9 we see that, for early times, grows like a power law, , with . This is consistent with meandering boundaries induced by Eden roughening, Derrida and Dickman (1991); Saito and Müller-Krumbhaar (1995); Hallatschek et al. (2007). We expect such a behavior since the roughness of the front has not fully developed yet. For large systems and later times we find a crossover to with . This confirms our earlier statement that at late times the few boundaries remaining after coarsening move differently. Indeed, they show an even stronger superdiffusive motion than Eden scaling, which is associated with the long-lived and pronounced surface undulations in systems with frequency-dependent selection.
IV.4 Surface roughening of the expanding front
We now discuss the surface roughness or undulations of the expanding front and compare our results to the classical Eden model. We measure the roughness of a front, which has not yet fixed to one species, by calculating its width for system size and at time :
| (10) |
Here, is the longitudinal position of the front at its transverse site and is the mean position
| (11) |
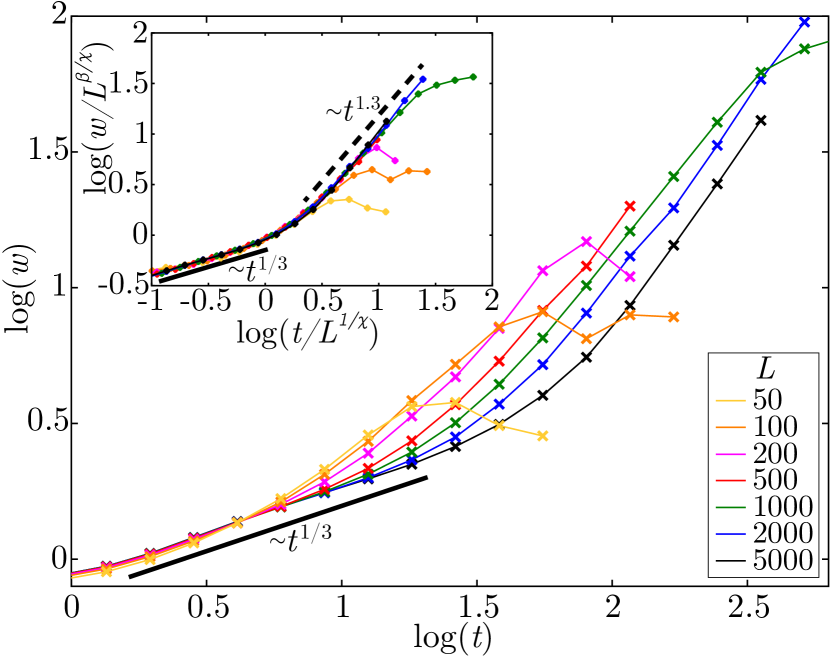
Figure 10 plots the width close to the critical point at . Initially, the roughness of the front grows like in the original Eden model Eden (1960): , where the growth exponent belongs to the KPZ-universality class Barabási and Stanley (1995). At intermediate times a new regime sets in, where increases with enhanced growth exponent . This marks the transition from Eden roughening to “selective roughening”. Here, the typical shape of the front is determined by advancing cooperator sectors and trailing defector sectors and ultimately drives the accelerated increase in the front’s width . The crossover to this regime happens at time , which increases with system size as Fig. 10 shows. This makes sense since we expect selective roughening to dominate over Eden roughening when the lateral extension of sectors is comparable to , i.e., . Due to Eden roughening the width at the crossover is . Indeed, rescaling width and time with and , respectively, collapses all data in Fig. 10 onto a single master curve, as the inset demonstrates. To conclude, surface roughening close to criticality occurs in two regimes. Until crossover time , one observes Eden roughening, whereas for times larger selective roughening occurs until the front fixes to one species. The dynamics of the width of the front is summarized by
| (12) |
V Summary and Conclusion
In this work we studied a generalized Eden model, where two species compete with each other at the rough expanding front. Individuals of the two species influence each other by frequency-dependent selection, which acts between nearest neighbors. We analyzed the evolutionary dynamics at the expanding front, where single-species sectors form and coarsen. Ultimately, the front fixes to one species, which we identify with an absorbing state of our model.
In its general form the model can implement several scenarios including selective advantage, and also well-known game theoretical settings like the snow drift game or the coordination game. Each of them creates distinct patterns, which should be analyzed in detail in future work. For the prominent example of a public goods game, we find that cooperators prevail in a wide parameter regime, as expected for a spatial version of a social dilemma Nowak et al. (1994); Ohtsuki et al. (2006); Szabó and Fáth (2007); Fu et al. (2010). For other parameter values defectors take over the front, as usual.
We identify the transition between long-term cooperation and long-term defection as a nonequilibrium critical phase transition between two absorbing states. The set of critical exponents (see Table 1), which we determined by analyzing critical and finite size scaling, shows that the phase transition belongs to a new universality class. We attribute this result to the fact that the front in our model is rough and not flat as in usual absorbing states. Close to the critical transition the front’s roughness exhibits a crossover in time from slow Eden roughening to fast selective roughening. Strong roughening has also been observed at phase transitions in a related model by Lavrentovich and Nelson Lavrentovich and Nelson (2014).
Interestingly, the critical exponents determined in our present work violate the so-called generalized hyperscaling relation Mendes et al. (1994)
| (13) |
where the number of transverse dimensions is 1. This relation holds for most universality classes of phase transitions to absorbing states Henkel et al. (2008). It is not obvious why our model does not obey the scaling relation.
The roughness of the front correlates with superdiffusive motion of the boundaries separating sectors. Two factors contribute to the movement of the boundaries on long length scales. On the one hand, the direct competition between the species on either side of the boundaries pushes them towards the sector composed of the more slowly reproducing species. On the other hand, boundaries follow the local tilt of the front. In the public goods game cooperator sectors are advanced, while defector sectors lag behind. Near the critical transition, defectors outcompete their direct cooperating neighbors but the front is tilted towards sectors filled by defectors, so the two factors move the boundaries in opposite directions. At the phase transition both effects cancel and the front fixes with equal probability to either species. The strong roughening correlates with superdiffusive motion of the boundaries with nearly ballistic scaling.
Accordingly, whether a species takes over the expanding front is determined by two contributions: its reproduction rate relative to its competitor and its position relative to the average front position. The influence of different reproduction rates of neighboring species can directly be compared and is summarized in the phrase “survival of the fittest”. The position at the front determines the available space for progeny, which then have the opportunity to expand sidewards. This is illustrated by the phrase “survival of the fastest” Van Dyken et al. (2013).
In our model the number of sectors only decreases. It does not include experiments with mutually beneficial interactions between different species, which do not generate sectors Müller et al. (2014); Momeni et al. (2013); Kovács (2014). In future extensions of our model this may be remedied by including motility of individuals Reichenbach et al. (2007); Gelimson et al. (2013), by allowing reproduction to more distant lattice sites Lavrentovich and Nelson (2014), or by increasing the maximal number of individuals per lattice site from one. Moreover, it is worthwhile to consider interactions ranging beyond nearest neighbors, since biomolecules, released by individual microorganisms, may diffuse in the extracellular medium Julou et al. (2013); Allen et al. (2013); Menon and Korolev (2015). In the public goods game scenario this would stabilize narrow sectors of defectors so that they do not lose contact to the front.
In general, range expansion of multiple species will develop enhanced roughness at the growing front. As we demonstrated here, the corresponding models have new and interesting statistical properties. From a biological point of view, roughness is important. It affects the territories that different species occupy and thereby their evolutionary success through the strong random motion of sector boundaries. This may also be relevant for range expansion in a real environment and not just in a test tube. To better understand the properties and consequences of rough expanding fronts, further theoretical work is needed. At the same time further experiments should look for the fingerprint of roughness in microbial colony growth.
Acknowledgements.
We thank the research training group GRK 1558 funded by Deutsche Forschungsgemeinschaft for financial support. We further thank Erwin Frey, Maria Eckl, Florian Gartner, and Raphaela Geßele for discussion and collaboration on a related model.References
- Murray (2007) J. D. Murray, Mathematical Biology I. An Introduction, 3rd ed., Vol. 1 (Springer, 2007).
- Griffiths et al. (1991) R. W. Griffiths, D. W. Schloesser, J. H. Leach, and W. P. Kovalak, Can. J. Fish. Aquat. Sci. 48, 1381 (1991).
- Loarie et al. (2009) S. R. Loarie, P. B. Duffy, H. Hamilton, G. P. Asner, C. B. Field, and D. D. Ackerly, Nature 462, 1052 (2009).
- Chen et al. (2011) I. C. Chen, J. K. Hill, R. Ohlemuller, D. B. Roy, and C. D. Thomas, Science 333, 1024 (2011).
- Peacock et al. (2015) E. Peacock et al., PLoS ONE 10, e112021 (2015).
- Stringer (2003) C. Stringer, Nature 423, 692 (2003).
- Liu et al. (2006) H. Liu, F. Prugnolle, A. Manica, and F. Balloux, Am. J. Hum. Genet. 79, 230 (2006).
- Moreau et al. (2011) C. Moreau, C. Bherer, H. Vezina, M. Jomphe, D. Labuda, and L. Excoffier, Science 334, 1148 (2011).
- Brú et al. (2003) A. Brú, S. Albertos, J. Luis Subiza, J. L. García-Asenjo, and I. Brú, Biophys. J. 85, 2948 (2003).
- Xavier (2011) J. B. Xavier, Mol Syst Biol 7, 483 (2011).
- Hall-Stoodley et al. (2004) L. Hall-Stoodley, J. W. Costerton, and P. Stoodley, Nat. Rev. Micro. 2, 95 (2004).
- Nadell et al. (2009) C. D. Nadell, J. B. Xavier, and K. R. Foster, FEMS Microbiol. Rev. 33, 206 (2009).
- Mitri et al. (2011) S. Mitri, J. B. Xavier, and K. R. Foster, Proc. Natl. Acad. Sci. USA 108, 10839 (2011).
- Hofbauer and Sigmund (1998) J. Hofbauer and K. Sigmund, Evolutionary Games and Population Dynamics, 1st ed. (Cambridge University Press, 1998).
- Szabó and Fáth (2007) G. Szabó and G. Fáth, Phys. Rep. 446, 97 (2007).
- Frey (2009) E. Frey, Physica A 389, 4265 (2009).
- Buckling et al. (2009) A. Buckling, R. C. Maclean, M. A. Brockhurst, and N. Colegrave, Nature 457, 824 (2009).
- Shapiro (1995) J. A. Shapiro, BioEssays 17, 597 (1995).
- Jacob et al. (1999) E. B. Jacob, Y. Aharonov, and Y. Shapira, Biofilms 1, 239 (1999).
- Golding et al. (1999) I. Golding, I. Cohen, and E. Ben-Jacob, Europhys. Lett. 48, 587 (1999).
- Matsushita et al. (1999) M. Matsushita, J. Wakita, H. Itoh, K. Watanabe, T. Arai, T. Matsuyama, H. Sakaguchi, and M. Mimura, Physica A 274, 190 (1999).
- Matsuyama and Matsushita (2001) T. Matsuyama and M. Matsushita, Forma 16, 307 (2001).
- Vicsek et al. (1990) T. Vicsek, M. Cserzo, and V. Horvath, Physica A 167, 315 (1990).
- Wakita et al. (1997) J.-i. Wakita, H. Itoh, T. Matsuyama, and M. Matsushita, J. Phys. Soc. Jpn. 66, 67 (1997).
- Huergo et al. (2010) M. Huergo, M. Pasquale, A. Bolzán, A. Arvia, and P. González, Phys. Rev. E 82, 031903 (2010).
- Hallatschek et al. (2007) O. Hallatschek, P. Hersen, S. Ramanathan, and D. R. Nelson, Proc. Natl. Acad. Sci. USA 104, 19926 (2007).
- Derrida and Dickman (1991) B. Derrida and R. Dickman, J. Phys. A 24, L191 (1991).
- Saito and Müller-Krumbhaar (1995) Y. Saito and H. Müller-Krumbhaar, Phys. Rev. Lett. 74, 4325 (1995).
- Crespi (2001) B. J. Crespi, Trends Ecol. Evol. 16, 178 (2001).
- Velicer (2002) G. J. Velicer, Trends Microbiol. 11, 330 (2002).
- Griffin et al. (2004) A. S. Griffin, S. A. West, and A. Buckling, Nature 430, 1024 (2004).
- Kreft (2004) J. U. Kreft, Biofilms 1, 265 (2004).
- West et al. (2007) S. A. West, S. P. Diggle, A. Buckling, A. Gardner, and A. S. Griffin, Annu. Rev. Ecol. Evol. Syst. 38, 53 (2007).
- Hibbing et al. (2010) M. E. Hibbing, C. Fuqua, M. R. Parsek, and S. B. Peterson, Nat. Rev. Micro. 8, 15 (2010).
- Mitri and Richard Foster (2013) S. Mitri and K. Richard Foster, Annu. Rev. Genet. 47, 247 (2013).
- Gore et al. (2009) J. Gore, H. Youk, and A. van Oudenaarden, Nature 459, 253 (2009).
- Müller et al. (2014) M. J. Müller, B. I. Neugeboren, D. R. Nelson, and A. W. Murray, Proc. Natl. Acad. Sci. USA 111, 1037 (2014).
- Van Dyken et al. (2013) J. D. Van Dyken, M. J. Müller, K. M. Mack, and M. M. Desai, Curr Biol 23, 919 (2013).
- Darwin (1859) C. Darwin, On the Origin of Species by Means of Natural Selection, or the Preservation of Favoured Races in the Struggle for Life (John Murray, 1859).
- Axelrod (2009) R. Axelrod, The Evolution of Cooperation, Revised Edition (Basic Books, 2009).
- Rainey and Rainey (2003) P. B. Rainey and K. Rainey, Nature 425, 72 (2003).
- Chuang et al. (2009) J. S. Chuang, O. Rivoire, and S. Leibler, Science 323, 272 (2009).
- Nowak et al. (1994) M. A. Nowak, S. Bonhoeffer, and R. M. May, Proc. Natl. Acad. Sci. USA 91, 4877 (1994).
- Ohtsuki et al. (2006) H. Ohtsuki, C. Hauert, E. Lieberman, and M. A. Nowak, Nature 441, 502 (2006).
- Fu et al. (2010) F. Fu, M. A. Nowak, and C. Hauert, J. Theor. Biol. 266, 358 (2010).
- Melbinger et al. (2010) A. Melbinger, J. Cremer, and E. Frey, Phys. Rev. Lett. 105, 178101 (2010).
- Cremer et al. (2012) J. Cremer, A. Melbinger, and E. Frey, Sci. Rep. 2 (2012).
- Xavier and Foster (2007) J. B. Xavier and K. R. Foster, Proc. Natl. Acad. Sci. USA 104, 876 (2007).
- Nadell et al. (2010) C. D. Nadell, K. R. Foster, and J. B. Xavier, PLoS Comput. Biol. 6, e1000716 (2010).
- Greig and Travisano (2004) D. Greig and M. Travisano, Proc. Biol. Sci. 271 (Suppl 3), S25 (2004).
- H Koschwanez et al. (2011) J. H Koschwanez, K. R Foster, and A. W Murray, PLoS Biol. 9, e1001122 (2011).
- Sen Datta et al. (2013) M. Sen Datta, K. S. Korolev, I. Cvijovic, C. Dudley, and J. Gore, Proc. Natl. Acad. Sci. USA 110, 7354 (2013).
- Pattus and Abdallah (2000) F. Pattus and M. A. Abdallah, J. Chin. Chem. Soc. 47, 1 (2000).
- Ratledge and Dover (2000) C. Ratledge and L. G. Dover, Annu. Rev. Microbiol. 54, 881 (2000).
- Nadell and Bassler (2011) C. D. Nadell and B. L. Bassler, Proc. Natl. Acad. Sci. USA 108, 14181 (2011).
- van Gestel et al. (2014) J. van Gestel, F. J. Weissing, O. P. Kuipers, and A. T. Kovács, ISME J. 8, 2069 (2014).
- Riley and Gordon (1999) M. A. Riley and D. M. Gordon, Trends Microbiol. 7, 129 (1999).
- Cornforth and Foster (2013) D. M. Cornforth and K. R. Foster, Nat. Rev. Micro. 11, 285 (2013).
- Lee and Schneewind (2001) V. T. Lee and O. Schneewind, Genes Dev. 15, 1725 (2001).
- Weber et al. (2014) M. F. Weber, G. Poxleitner, E. Hebisch, E. Frey, and M. Opitz, J. R. Soc. Interface 11, 20140172 (2014).
- Xavier et al. (2011) J. B. Xavier, W. Kim, and K. R. Foster, Mol. Microbiol. 79, 166 (2011).
- Eden (1960) M. Eden, Proc of the Fourth Berkeley Symposium on Mathematical Statistics and Probability 4, 223 (1960).
- Barabási and Stanley (1995) A.-L. Barabási and H. E. Stanley, Fractal concepts in surface growth, 1st ed. (Cambridge University Press, 1995).
- Plischke and Rácz (1985) M. Plischke and Z. Rácz, Phys. Rev. A 32, 3825 (1985).
- Jullien and Botet (1985a) R. Jullien and R. Botet, J. Phys. A 18, 2279 (1985a).
- Ali and Grosskinsky (2010) A. Ali and S. Grosskinsky, Adv. Complex Syst. 13, 349 (2010).
- Kuhr et al. (2011) J.-T. Kuhr, M. Leisner, and E. Frey, New J. Phys. 13, 113013 (2011).
- Gillespie (1976) D. T. Gillespie, J. Comput. Phys. 22, 403 (1976).
- Jullien and Botet (1985b) R. Jullien and R. Botet, Phys. Rev. Lett. 54, 2055 (1985b).
- Krug and Spohn (1992) J. Krug and H. Spohn, in Solids far from Equilibrium, edited by C. Godrèche (Cambridge University Press, 1992).
- Halpin-Healy and Zhang (1995) T. Halpin-Healy and Y.-C. Zhang, Phys. Rep. 254, 215 (1995).
- Ódor (2004) G. Ódor, Rev. Mod. Phys. 76, 663 (2004).
- Henkel et al. (2008) M. Henkel, H. Hinrichsen, and S. Lübeck, Non-equilibrium phase transitions: Absorbing phase transitions, 1st ed., Vol. 1 (Springer, 2008).
- Hamilton (1964a) W. D. Hamilton, J. Theor. Biol. 7, 1 (1964a).
- Hamilton (1964b) W. D. Hamilton, J. Theor. Biol. 7, 17 (1964b).
- Essam (1989) J. W. Essam, J. Phys. A 22, 4927 (1989).
- Kardar et al. (1986) M. Kardar, G. Parisi, and Y.-C. Zhang, Phys. Rev. Lett. 56, 889 (1986).
- Lavrentovich and Nelson (2014) M. O. Lavrentovich and D. R. Nelson, Phys. Rev. Lett. 112, 138102 (2014).
- Mendes et al. (1994) J. F. F. Mendes, R. Dickman, M. Henkel, and M. C. Marques, J. Phys. A 27, 3019 (1994).
- Momeni et al. (2013) B. Momeni, K. A. Brileya, M. W. Fields, and W. Shou, eLife 2, e00230 (2013).
- Kovács (2014) A. T. Kovács, Front. Microbiol. 5 (2014).
- Reichenbach et al. (2007) T. Reichenbach, M. Mobilia, and E. Frey, Nature 448, 1046 (2007).
- Gelimson et al. (2013) A. Gelimson, J. Cremer, and E. Frey, Phys. Rev. E 87, (2013).
- Julou et al. (2013) T. Julou, T. Mora, L. Guillon, V. Croquette, I. J. Schalk, D. Bensimon, and N. Desprat, Proc. Natl. Acad. Sci. USA 110, 12577 (2013).
- Allen et al. (2013) B. Allen, J. Gore, M. A. Nowak, and C. T. Bergstrom, eLife 2, e01169 (2013).
- Menon and Korolev (2015) R. Menon and K. S. Korolev, Phys. Rev. Lett. 114, 168102 (2015).