AGN feedback in action: a new powerful wind in 1SXPS~J050819.8+172149? ††thanks: Based on observations obtained with the Swift satellite.
Abstract
Context. Galaxy merging is widely accepted to be a key driving factor in galaxy formation and evolution, while the feedback from actively accreting nuclei is thought to regulate the black hole-bulge coevolution and the star formation process.
Aims. In this context, we focused on 1SXPS~J050819.8+172149, a local () Seyfert 1.9 galaxy (). The source belongs to an infrared-luminous interacting pair of galaxies, characterized by a luminosity for the whole system (due to the combination of star formation and accretion) of . We present here the first detailed description of the keV spectrum of 1SXPS~J050819.8+172149, monitored by Swift with pointings performed in less than month.
Methods. The X-ray emission of 1SXPS~J050819.8+172149 is analysed by combining all the Swift pointings, for a total of ks XRT net exposure. The averaged Swift-BAT spectrum from the 70-month survey is also analysed.
Results. The slope of the continuum is , with an intrinsic column density of , and a de-absorbed luminosity of in the keV band. Our observations provide a tentative () detection of a blue-shifted Fe xxvi absorption line (rest-frame keV), thus suggesting the discovery for a new candidate powerful wind in 1SXPS~J050819.8+172149. The physical properties of the outflow cannot be firmly assessed, due to the low statistics of the spectrum and to the observed energy of the line, too close to the higher boundary of the Swift-XRT bandpass. However, our analysis suggests that, if the detection is confirmed, the line could be associated with a high-velocity () outflow most likely launched within . To our knowledge this is the first detection of a previously unknown ultrafast wind with Swift. The high column density suggested by the observed equivalent width of the line (EWeV, although with large uncertainties), would imply a kinetic output strong enough to be comparable to the AGN bolometric luminosity.
Key Words.:
galaxies: active - X-rays: individuals: 1SXPS~J050819.8+172149 - quasars: absorption lines - galaxies: star formation1 Introduction
The observational evidence for the presence of inactive Super Massive Black Holes (SMBHs; ) at the centre of most, if not all, the local galaxies, and the observed correlation between several properties of the galaxy’s bulge and the central SMBH mass (Ferrarese & Merritt, 2000; Gebhardt et al., 2000), suggest that the SMBH accretion and the assembly of the galaxies bulges are intimately related (see Kormendy & Ho, 2013, for a recent review). Funnelling of gas in the nuclear regions, as triggered by galaxy interactions, can activate both efficient accretion onto the SMBH, and a burst of star formation. A key ingredient in regulating their evolution should be the feedback from the Active Galactic Nuclei (AGN); being conservative, while building its mass the SMBH can release an amount of energy larger than times the binding energy of the host bulge (see a review in Fabian, 2012). Even if only a small fraction of this energy is transferred to the gas in the galaxy, then an active nucleus can have a profound effect on the evolution of its host (Di Matteo et al., 2005). Powerful (kinetical or radiative) outflows of gas driven by luminous quasars are invoked as a key mechanism to blow away the gas in the galaxy and thereby quench star formation, coincidentally starving the SMBH of fuel (King & Pounds, 2015).
AGN winds with a range of physical properties have been revealed by observations at various energies, from radio up to X-rays. Outflows of molecular or neutral atomic gas, with velocities up to and extending on kpc scales, have been observed at mm (e.g., Feruglio et al., 2010; Cicone et al., 2014) and radio frequencies (e.g., Morganti et al., 2005; Teng et al., 2013) in a few dozen AGN in dusty star forming sources and/or radio galaxies. Mass outflows of ionized gas with similar velocities at distances consistent with the narrow line region zone have been detected in the optical/ultraviolet (UV), both in the [O iii] emission line profiles (e.g., Crenshaw & Kraemer, 2005; Cano-Díaz et al., 2012; Cresci et al., 2015), and through the observation of broad absorption line systems (e.g., Dai et al., 2008; Borguet et al., 2013). In X-rays, mildly ionized warm absorbers are observed in more than half of unobscured AGN (Crenshaw et al., 2003; Blustin et al., 2005). The observed velocities of imply a kinetic power rather low when compared to the bolometric luminosity. However, Crenshaw & Kraemer (2012) found that, when summed over all the absorbers, the total power carried by these structures can reach, in some cases, the minimum level required for AGN feedback (%; e.g., Di Matteo et al., 2005; Hopkins & Elvis, 2010). In the last years, highly blue-shifted Fe K-shell absorption lines at rest-frame energies keV, observed in XMM-Newton or Suzaku spectra of luminous AGN, revealed the presence of high column density () and fast () winds (e.g., Tombesi et al., 2010; Gofford et al., 2013; Tombesi et al., 2015). Their derived kinetic power is systematically higher than the minimum fraction of bolometric luminosity required by AGN feedback models in order to regulate the growth of an SMBH and its galactic bulge (e.g., Hopkins & Elvis, 2010). Only very recently, outflows over a range of scales have been detected and studied within the same source, thus allowing us to explore the connection between large-scale molecular outflows and accretion-disk activity (Feruglio et al., 2015; Tombesi et al., 2015).
Finding observational evidence of the effects of such accretion-related feedback and characterising the magnitude of mass outflows from AGN are among the major challenges of the current extragalactic astronomy. Here we present coadded Swift observations (performed in less than month) of the interacting infrared (IR) galaxy 1SXPS~J050819.8+172149. The spectrum, the first for this source covering the energy range keV, provides us with a tentative detection of a possible new ultrafast wind (). To our knowledge, this is the first time that a previously unknown outflow is revealed by Swift.
2 1SXPS~J050819.8+172149
The position of the Swift source 1SXPS~J050819.8+172149 (Evans et al., 2014) is coincident with the center of CGCG 468-002~NED01, a local () galaxy belonging to the interacting pair CGCG 468-002 (projected distance between the center of the galaxies of , corresponding to kpc at the source redshift).
The high m luminosity of the system, (Armus et al., 2009), implies a classification as Luminous Infrared Galaxy (LIRG, defined as having ; Sanders & Mirabel, 1996). Included for this reason in the Great Observatories All-Sky LIRG Survey (GOALS; Armus et al., 2009), the system has been targeted with several observational facilities, and multiwavelength information (both spectroscopic and photometric) has been collected. The available data span from the UV (GALEX; Howell et al., 2010) up to the mid-IR (Spitzer/IRS, IRAC, and MIPS; Díaz-Santos et al., 2010, 2011; Petric et al., 2011; Inami et al., 2013; Stierwalt et al., 2013, 2014, see also Valiante et al. 2009; Alonso-Herrero et al. 2012, 2013) and far-IR (HERSCHEL/PACS; Díaz-Santos et al., 2013) bands. Photometry from the 2MASS Redshift Survey is reported by Huchra et al. (2012). At radio wavelengths, the relatively strong (mJy) NVSS emission (Condon et al., 1998), detected halfway between the nuclei and slightly elongated in their direction, is probably due to the combined contribution of both galaxies.
The system is an early-stage merger (Stierwalt et al., 2013) known to host an AGN optically classified as Seyfert 1.9 (see e.g. Motch et al., 1998; Véron-Cetty & Véron, 2001; Kollatschny et al., 2008). Mainly based on the detection of the high-ionization line [Ne v] in the Spitzer/IRS spectra, the Seyfert 1.9 nucleus has been associated with the western galaxy of the system, coincident with 1SXPS~J050819.8+172149 (Petric et al., 2011; Alonso-Herrero et al., 2012; Stierwalt et al., 2013, 2014, see also the optical classification reported by Alonso-Herrero et al. 2013). The Spitzer spectra are suggestive of a relatively unobscured AGN (consistent with the optical classification as Seyfert 1.9), energetically important in the mid-IR (Stierwalt et al., 2013). From a decomposition of the mid-IR spectra into AGN and starburst components, Alonso-Herrero et al. (2012) estimated a bolometric luminosity due to the accretion of . Instead, no signature of active accretion is found for the eastern galaxy, which shows all the typical properties of a star forming source both in the mid-IR spectra and from the UV photometry.
The BH mass in 1SXPS~J050819.8+172149 is among the highest observed in local LIRGs, (as calculated from the velocity dispersion of the core of the [O iii] line; Alonso-Herrero et al., 2013). This implies that the black hole is radiating at a low fraction of its Eddington luminosity111The Eddington luminosity, defined as [], represents the exact balance between inward gravitational force and outward radiation force acting on the gas, assumed to be of ionised hydrogen in a spherical configuration., with Eddington ratio . The star formation rate (SFR) derived for this source falls in the lower tail of the distribution found for local LIRGs (nuclear , integrated , Alonso-Herrero et al., 2013), implying a ratio between SFR and BH accretion rate of (by assuming a mass-energy conversion efficiency ), similar to the values found for Seyfert galaxies.
3 XRT data analysis
| Obs. ID | Start date | Net count rate | Net exp. time | ||
|---|---|---|---|---|---|
| [counts s-1] | [s] | ||||
| 00049706003 | 2014- | 10 - | 15 | ||
| 00049706004 | 2014- | 10 - | 16 | ||
| 00049706005 | 2014- | 10 - | 21 | ||
| 00049706006 | 2014- | 10 - | 22 | ||
| 00049706007 | 2014- | 10 - | 23 | ||
| 00049706008 | 2014- | 10 - | 27 | ||
| 00049706009 | 2014- | 10 - | 28 | ||
| 00049706010 | 2014- | 10 - | 30 | ||
| 00049706011 | 2014- | 11 - | 11 | ||
Besides the basic analysis reported in the Swift-XRT point source catalogue (Evans et al., 2014), in the soft-medium X-ray energy range (keV) the only published information up to now comes from the ROSAT All Sky Survey (see Kollatschny et al., 2008, and references therein), providing a soft X-ray luminosity (de-absorbed by our Galaxy) of . At higher energies, 1SXPS~J050819.8+172149 has been detected by the Swift-Burst Alert Telescope (BAT; see Baumgartner et al., 2013), while Ackermann et al. (2012) reported only a Fermi % confidence level upper limit of .
Recently, our group has been awarded a Swift (Gehrels et al., 2004) program for this source (PI P. Severgnini): pointings performed with the X-ray telescope (XRT; Burrows et al., 2005) in the standard photon counting (PC) mode between 2014-10-15 and 2014-11-11, for a total of ks net exposure (ObsID from 00049706003 to 00049706011; see Table 1).
We generated images, light curves, and spectra, including the background and ancillary response files, with the online XRT data product generator222http://www.swift.ac.uk/user_objects (Evans et al., 2007, 2009); the appropriate spectral response files have been identified in the calibration database. The source appears point-like in the XRT image and centered at the position of the western nucleus, without any evident elongation toward the position of the second galaxy. We note that at the angular resolution of XRT, half-power diameter, the emission of the two galaxies, located at a distance of , can be resolved; by assuming a power-law model with , we estimated a upper limit to the keV emission at the eastern source position of .
Source events were extracted from a circular region with a radius of pixels (which corresponds to an Encircled Energy Fraction of 90%, Moretti et al., 2005, pixel arcsec), while background events were extracted from an annulus region centred on the source with inner and outer radii of and pixels, respectively; all sources identified in the image were removed from the background region.
We extracted a light curve binned at the duration of each individual observation. 1SXPS~J050819.8+172149 was detected in all observations, with keV signal-to-noise ratios () ranging from to . The average count rates in the total (keV), soft (keV), and hard (keV) XRT energy ranges are , , and counts s-1, respectively. Small deviations from these values, of a factor lower than , are observed in the light curves; however, there is no evidence of spectral variability in the ratio of count rates observed in the hard and soft bands. We do not find any significant pile-up problem.
In order to increase the statistics, we co-added the XRT datasets. Source and background spectra were extracted from the merged event lists, and the former was binned in order to have at least total counts per energy channel. The net count rates in the keV, keV, and keV energy ranges are , , and counts s-1, respectively. The achieved in the same energy ranges are , , and , respectively.
Spectral fits were performed in the keV energy range using the X-ray spectral fitting package XSPEC (Arnaud, 1996) v12.8.2. Uncertainties are quoted at the % confidence level for one parameter of interest (). All the models discussed in the following assume Galactic absorption with a column density of (Kalberla et al., 2005). To model both Galactic and intrinsic absorptions we used the (z)phabs model in XSPEC, adopting cross-sections and abundances of Wilms et al. (2000).
| Direct, reflected and scattered continuum | Absorption line | ||||||||||
| % scatt. | EW | ||||||||||
| (1) | (2) | (3) | (4) | (5) | (6) | (7) | (8) | (9) | (10) | (11) | (12) |
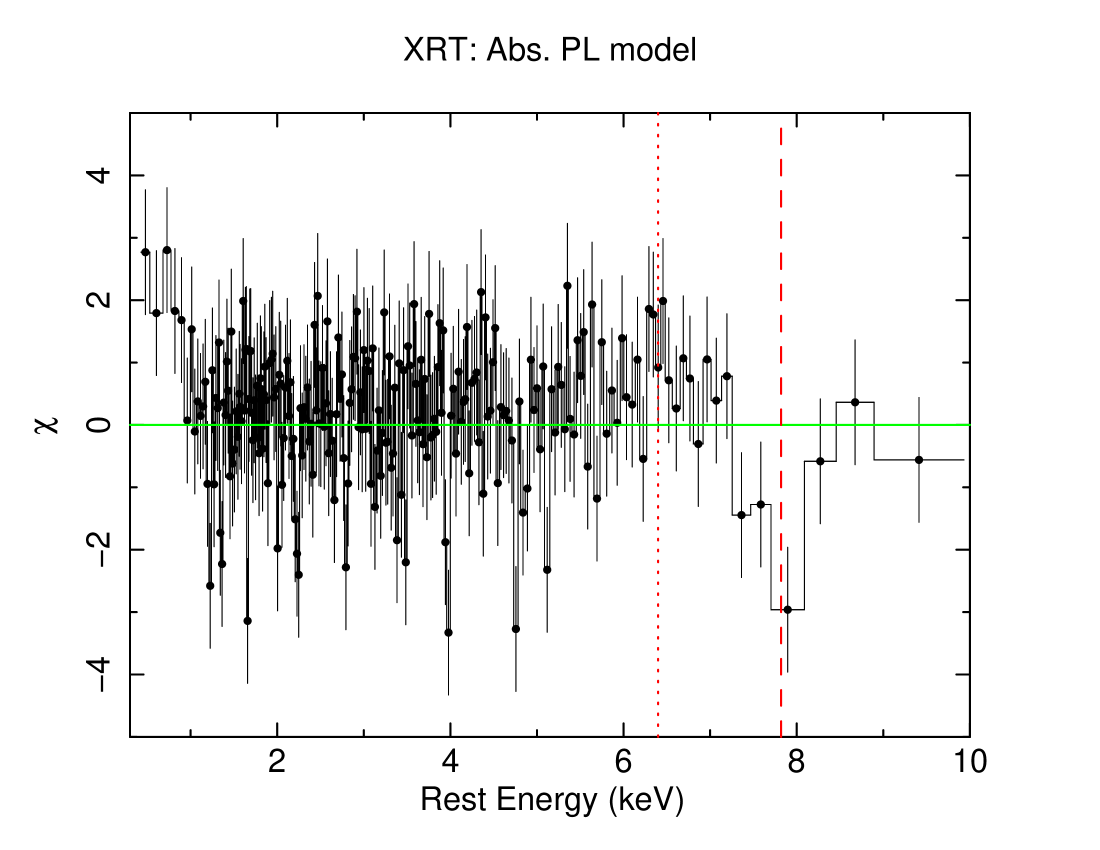
A fit with a simple absorbed power law clearly provides a poor representation of the XRT data (); the photon index is and the column density is . Above keV, i.e. in the energy range where the iron K complex is expected, residuals are present both in emission and in absorption (see Fig. 1), while a big bump below keV suggests the emerging of an additional component in the soft band. Assuming that the neutral absorber only partial covers the central source (zpcfabs model in XSPEC) still leaves residuals in the soft band (); we found a covering fraction, with and .
In principle, the emission observed at low energies can be associated with the accreting nucleus (i.e., due to scattering off optically thin ionised gas) and/or the host galaxy (a soft thermal emission is a characteristic signature in all known starburst galaxies). Phenomenologically, the observed soft excess can be accounted for equally well by adding to the previous model: 1) an unabsorbed power law with photon index tied to the primary one (); the best-fit parameters are: , , and ratio of the power-law normalizations %; or 2) a thermal component (mekal model in XSPEC; ): in this case we found , , and keV. In the latter parametrisation, the luminosity attributed to the thermal component is , which would imply a (e.g., Ranalli et al., 2003; Mas-Hesse et al., 2008; Mineo et al., 2012), consistent with the nuclear star formation properties of the host (see Sect. 2). In both cases, the luminosity observed in the range covered by ROSAT, , is in agreement with the value derived by Kollatschny et al. (2008).
While the most plausible hypothesis is that both components contribute to the emission observed at low energies in the XRT spectrum, the quality of the present data does not allow us to discriminate between the two contributions, and even less to disentangle them. In the following, we assume an unabsorbed power law, checking that the inclusion of a thermal component in place of the power law does not affect the main results presented here.
The addition of a narrow (eV) Gaussian emission line to the absorbed plus unabsorbed power laws results in an improvement in the fit (). The line parameters are keV, consistent with neutral , , and EWeV. The strength of the line, coupled with the hard photon index (), could suggest the presence of neutral reflection (Reynolds et al., 1994; Matt et al., 1996, 2000). This possible component was then included in the model by replacing the narrow Gaussian line with a pexmon component (Nandra et al., 2007), an additive model self-consistently incorporating the Compton-reflected continuum from a neutral slab combined with emission from , , and the Compton shoulder.
To improve the determination of the slope of the primary power law and the amount of reflection, it is fundamental to know the shape and intensity of the emission at energies higher than keV. Therefore we fitted the XRT data simultaneously with the averaged Swift-BAT spectrum of 1SXPS~J050819.8+172149 obtained from the 70-month survey archive444http://swift.gsfc.nasa.gov/results/bs70mon/SWIFT_J0508.1p1727 (SWIFT J0508.1+1727). The data reduction and extraction procedure of the eight-channel spectrum is described in Baumgartner et al. (2013). To fit the pre-processed, background-subtracted BAT spectrum, we used the latest calibration response as of 2013 May. 1SXPS~J050819.8+172149 was detected in the keV band with a count rate of counts s-1, which corresponds to a keV flux of (Baumgartner et al., 2013).
During the fit, the only free parameter of the pexmon component was the reflection scaling factor, . We tied the pexmon photon index and normalization to that of the primary power law, and we fixed the cutoff energy at keV (i.e., consistent with no measurable cut-off), the inclination angle at , and the abundances of heavy elements at their Solar values. We also allow to vary the cross-normalisation factor between the XRT data and the average BAT spectrum.
The baseline model then consists of an absorbed power law and an unabsorbed one plus a reflection component: the photon index and intrinsic absorption of the primary emission are (in agreement with the values typically observed in unobscured AGN; Piconcelli et al., 2005; Mateos et al., 2010; Corral et al., 2011) and , while the reflection fraction and the strength of the scattered component are and %. The cross-normalisation factor between the XRT data and the average BAT spectrum is .
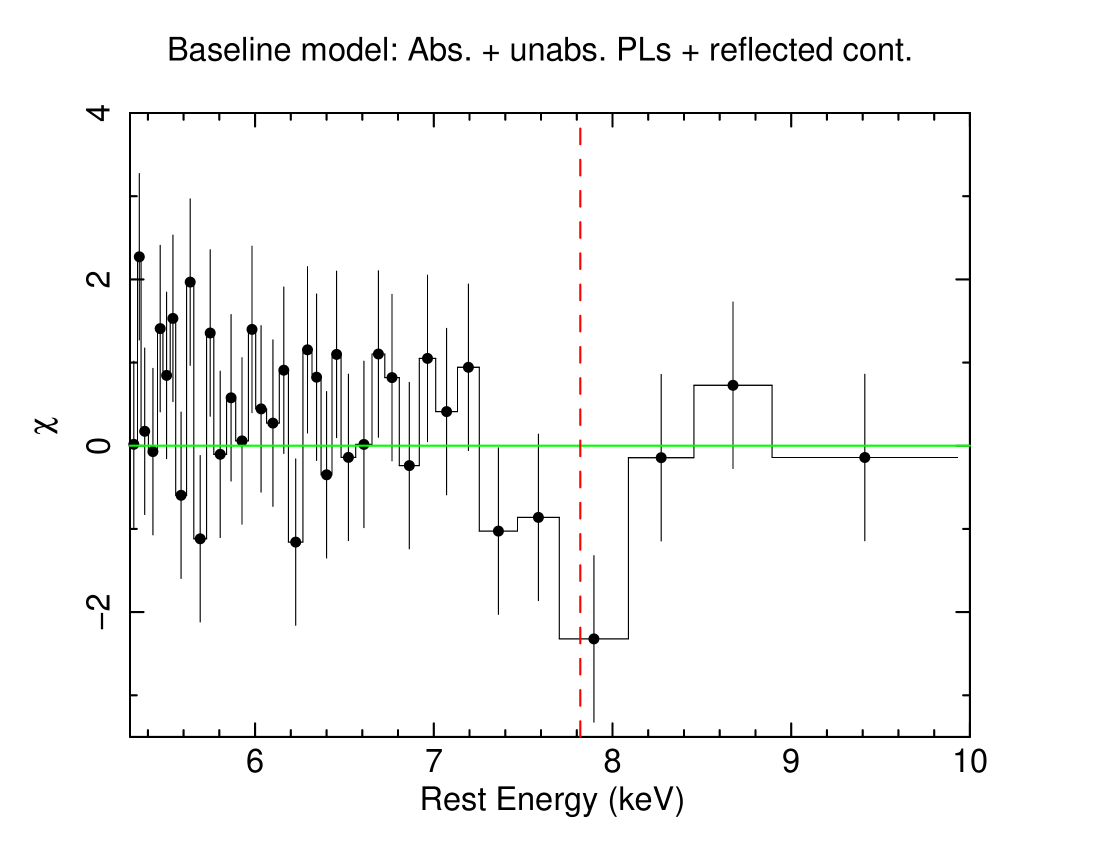
Although this model provides an acceptable description of the broad-band (keV) X-ray continuum of 1SXPS~J050819.8+172149 (), it is not able to account for the residuals observed above keV, confirming the presence of a deep absorption trough at about keV (see Fig. 2). Considering only the XRT bins between and keV, the fit statistics provided by the model is . These residuals can be accounted for by adding a Gaussian absorption line, with a rest-frame energy of keV and an equivalent width EWeV ( in the keV interval). The line is marginally resolved; allowing its width to vary, we can set only an upper limit eV.
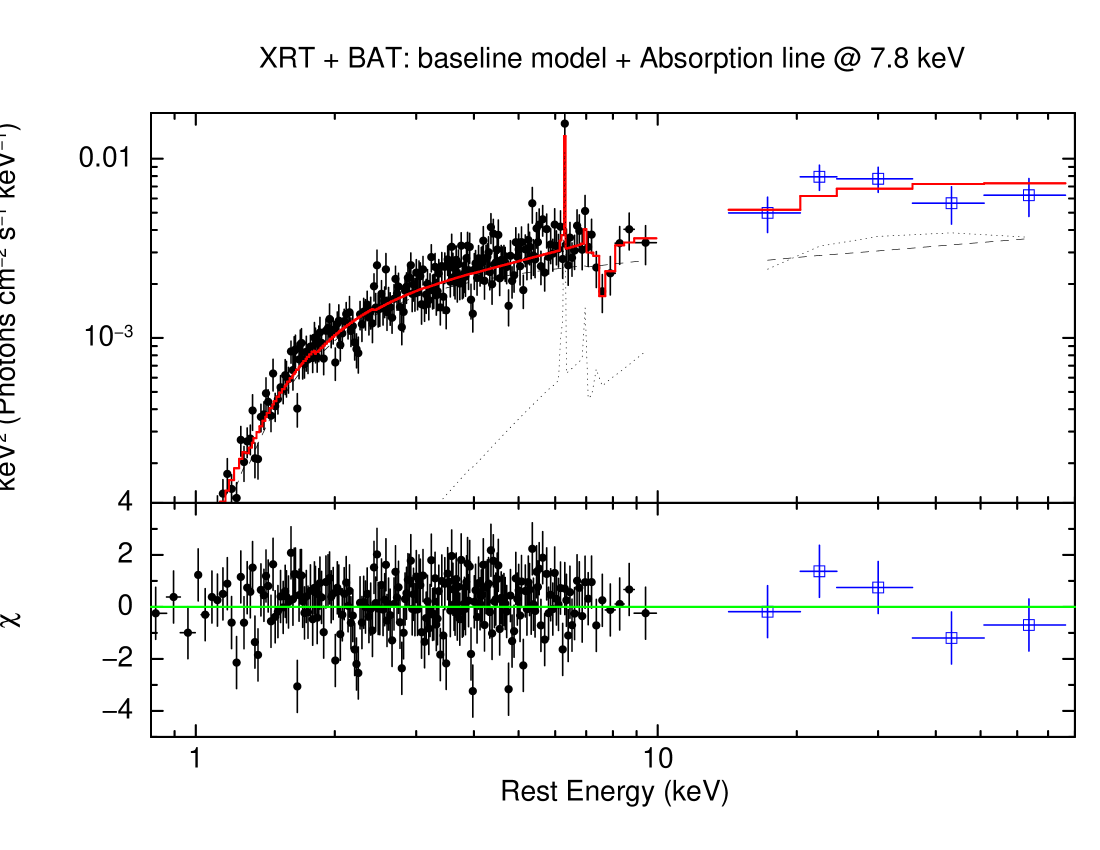
The best-fitting parameters are reported in Table 2, while the unfolded XRT and BAT spectra are shown in Fig. 3. We note that the significance of the detection can depend on the accuracy of the determination of the continuum shape. In particular, we checked if the observed shape can be explained with a mix of a stronger reflection edge plus a steeper and lower continuum. However, even if we assume the combination of reflection strength and intrinsic spectral shape that minimises the intensity of the trough, the normalisation of the Gaussian line is still inconsistent with the null value at a confidence level of %, in agreement with the significance of the detection derived from the simulations (see below).
The high energy range where the line is observed, very near to the end of the XRT bandpass, could raise concerns of possible artefacts due to the background. However, the and number of source counts collected between and keV ( and counts, respectively; last bins in Fig. 2) strongly support that the spectral rising that defines the line is real. We performed extensive simulations testing the null hypothesis that the spectrum is well fitted by a model that does not include the keV absorption feature, as done in Markowitz et al. (2006, see also ). Briefly, to take into account the observed background and the uncertainty in the continuum, we first generated a fake spectrum for a ks exposure assuming the best fit found for the continuum. We then fitted this model to the fake spectrum, and starting from the new best-fit parameters we re-run a simulation with the same exposure. The baseline model has been fitted to this final fake spectrum, and the derived has been compared with the minimum value of obtained when a narrow (eV) Gaussian component was included. We stepped the centroid energy of the absorption line over the keV range in increments of keV, fitting separately each time to derive the lowest value of . The whole process has been repeated times, and we estimated a % probability of detecting a similar feature by chance.
The observed energy of the line suggested by the data is not consistent with any of the atomic transitions555http://physics.nist.gov/PhysRefData/ASD/lines_form.html expected at energies keV (e.g., Kallman et al., 2004). The most likely explanation is that the centroid of the line is blueshifted, implying that the material responsible for the observed feature is outflowing. Prime candidates for the origin of the line are the inner K-shell resonances from moderately-highly ionized , as observed in other AGN. Indeed, assuming K absorption by moderately ionized Fe, we would expect to observe also strong K absorption by the same species (see e.g. the detailed discussion in Markowitz et al., 2006). Being conservative, we can identify the line with the Fe xxvi at keV resonant absorption; in this case, the observed centroid would indicate a substantial blueshifted velocity of . An origin in at a lower ionization would imply an even higher blueshift.
The observed outflow velocity of would translate in a lower limit on the radial distance, corresponding to the escape radius at which the material is able to leave the system. When a spherical geometry is assumed, this limit is , where is the enclosed mass producing the inward gravitational force. Under the reasonable hypothesis that this corresponds to the mass of the central BH, assuming the estimate reported in the literature (, see Sect. 2), we have cm. This translates to a possible launch radius of pc, or (Schwarzschild radii, ) .
The quality of the available data prevents a more detailed spectral analysis, but the ionization level of the Fe responsible of the absorption and the observed EWeV (though with large uncertainties) would suggest that we are dealing with a high-ionization (ionization parameter666The ionisation parameter is defined as , where is the hydrogen number density of the gas (in cm-3) and is the radial distance of the absorbing/emitting material from the central source of X-ray (in cm), while the ionising luminosity has units of . ), high-column density () outflow (e.g., Gofford et al., 2013).
4 Summary
In this paper, we have reported on our keV observation of the Seyfert 1.9 galaxy 1SXPS~J050819.8+172149, a member of the local LIRG pair known as CGCG 468-002. The Swift-XRT data have been analysed jointly with the Swift-BAT spectrum, averaged over months. The continuum is well described by an intrinsic power law with photon index , absorbed by a column of . A reflected component is also observed, with a reflection fraction of , while a weak soft scattered component (% of scattering fraction) can account for the observed soft emission. The de-absorbed luminosity is .
Our Swift monitoring (the first observation of this source extending up to energies keV), performed in less than month, provides us a tentative detection ( significance) of an absorption trough at a rest-frame energy of keV. When the feature is described by a simple Gaussian absorption line, its properties (e.g., energy and EW) are consistent with an origin in a material moving with a velocity of . To our knowledge, this would be the first detection with Swift of a previously unknown high-velocity outflow.
The low statistics of the data and the high energy of the observed residuals, near the higher boundary of the bandpass of XRT, do not allow us to test more physically consistent models (e.g., grids of photoionized absorbers generated with the XSTAR photoionization code; Kallman et al., 2004). However, if the detection is confirmed, the observed EW and the derived velocity suggest physical parameters typical of an extremely powerful outflow, as observed in only a handful of AGN (e.g., the Ultra Luminous Infrared Galaxy/quasar Mrk~231; Feruglio et al., 2015). In this case, the kinetic output could match or exceed the typical fraction of bolometric luminosities required for AGN feedback.
In fact, 1SXPS~J050819.8+172149 could resemble Mrk~231: the source studied here is hosted in a star forming merging system and (possibly) shows evidence of a powerful disk wind. However, these characteristics are combined in 1SXPS~J050819.8+172149 with a lower level of activity, both of accretion and star formation, than observed in Mrk~231. This would make 1SXPS~J050819.8+172149 quite unique among the extremely powerful AGN winds studied so far. Merging systems as the one hosting this source are the objects where we expect to better observe the interplay between star formation and accretion, since both phenomena can be triggered by galaxy interactions. Indeed, they are the objects were the coexistence of disk winds and molecular outflows has been found so far (e.g., Mrk~231, Feruglio et al., 2015; IRAS~F11119+3257, Tombesi et al., 2015). In addition, comparing the accretion and star forming properties reported in Sect. 2, 1SXPS~J050819.8+172149 seems to be one of the few examples of a source that, after a recent episode of star formation, is in a transition phase between star forming-dominated (HII-LIRG) and accretion-dominated (Seyfert-LIRG) state (Alonso-Herrero et al., 2013). The quenching of the star formation can be related (at least partly) to the increasing of the AGN activity, as expected from the co-evolution models. An outflow powerful enough to affect the environment beyond the SMBH’s gravitational sphere of influence, as the one possibly detected in the XRT data, could in principle play a significant role in this process.
Better statistics and higher resolution observations, extending at energies above keV, are needed in order to confirm the presence of the feature, improve the significance of this detection and asses the properties of the associated wind, namely the column density and the ionisation state, and then the radial location with respect to the central source. The knowledge of these parameters would allow us to estimate the mass outflow rate and the kinetic power, to be compared with the energetic of the accretion.
Acknowledgements.
We are grateful to the referee for her/his constructive comments that improved the paper. We warmly thank Alessandro Caccianiga for useful discussions. We also want to thank Neil Gehrels, Boris Sbarufatti and the Swift Mission Operation Center to make every effort to get our observations scheduled. This work made use of data supplied by the UK Swift Science Data Centre at the University of Leicester. This research has made use of NASA’s Astrophysics Data System. Support from the Italian Space Agency is acknowledged (contract ASI INAF I/037/12/0). The authors acknowledge financial support from the Italian Ministry of Education, Universities and Research (PRIN2010-2011, grant n. 2010NHBSBE).References
- Ackermann et al. (2012) Ackermann, M., Ajello, M., Allafort, A., et al. 2012, ApJ, 747, 104
- Alonso-Herrero et al. (2013) Alonso-Herrero, A., Pereira-Santaella, M., Rieke, G. H., et al. 2013, ApJ, 765, 78
- Alonso-Herrero et al. (2012) Alonso-Herrero, A., Pereira-Santaella, M., Rieke, G. H., & Rigopoulou, D. 2012, ApJ, 744, 2
- Armus et al. (2009) Armus, L., Mazzarella, J. M., Evans, A. S., et al. 2009, PASP, 121, 559
- Arnaud (1996) Arnaud, K. A. 1996, in Astronomical Society of the Pacific Conference Series, Vol. 101, Astronomical Data Analysis Software and Systems V, ed. G. H. Jacoby & J. Barnes, 17
- Baumgartner et al. (2013) Baumgartner, W. H., Tueller, J., Markwardt, C. B., et al. 2013, ApJS, 207, 19
- Blustin et al. (2005) Blustin, A. J., Page, M. J., Fuerst, S. V., Branduardi-Raymont, G., & Ashton, C. E. 2005, A&A, 431, 111
- Borguet et al. (2013) Borguet, B. C. J., Arav, N., Edmonds, D., Chamberlain, C., & Benn, C. 2013, ApJ, 762, 49
- Burrows et al. (2005) Burrows, D. N., Hill, J. E., Nousek, J. A., et al. 2005, Space Sci. Rev., 120, 165
- Cano-Díaz et al. (2012) Cano-Díaz, M., Maiolino, R., Marconi, A., et al. 2012, A&A, 537, L8
- Cicone et al. (2014) Cicone, C., Maiolino, R., Sturm, E., et al. 2014, A&A, 562, A21
- Condon et al. (1998) Condon, J. J., Cotton, W. D., Greisen, E. W., et al. 1998, AJ, 115, 1693
- Corral et al. (2011) Corral, A., Della Ceca, R., Caccianiga, A., et al. 2011, A&A, 530, A42
- Crenshaw & Kraemer (2005) Crenshaw, D. M. & Kraemer, S. B. 2005, ApJ, 625, 680
- Crenshaw & Kraemer (2012) Crenshaw, D. M. & Kraemer, S. B. 2012, ApJ, 753, 75
- Crenshaw et al. (2003) Crenshaw, D. M., Kraemer, S. B., & George, I. M. 2003, ARA&A, 41, 117
- Cresci et al. (2015) Cresci, G., Mainieri, V., Brusa, M., et al. 2015, ApJ, 799, 82
- Dai et al. (2008) Dai, X., Shankar, F., & Sivakoff, G. R. 2008, ApJ, 672, 108
- Di Matteo et al. (2005) Di Matteo, T., Springel, V., & Hernquist, L. 2005, Nature, 433, 604
- Díaz-Santos et al. (2013) Díaz-Santos, T., Armus, L., Charmandaris, V., et al. 2013, ApJ, 774, 68
- Díaz-Santos et al. (2010) Díaz-Santos, T., Charmandaris, V., Armus, L., et al. 2010, ApJ, 723, 993
- Díaz-Santos et al. (2011) Díaz-Santos, T., Charmandaris, V., Armus, L., et al. 2011, ApJ, 741, 32
- Evans et al. (2009) Evans, P. A., Beardmore, A. P., Page, K. L., et al. 2009, MNRAS, 397, 1177
- Evans et al. (2007) Evans, P. A., Beardmore, A. P., Page, K. L., et al. 2007, A&A, 469, 379
- Evans et al. (2014) Evans, P. A., Osborne, J. P., Beardmore, A. P., et al. 2014, ApJS, 210, 8
- Fabian (2012) Fabian, A. C. 2012, ARA&A, 50, 455
- Ferrarese & Merritt (2000) Ferrarese, L. & Merritt, D. 2000, ApJ, 539, L9
- Feruglio et al. (2015) Feruglio, C., Fiore, F., Carniani, S., et al. 2015, ArXiv e-prints [arXiv:1503.01481]
- Feruglio et al. (2010) Feruglio, C., Maiolino, R., Piconcelli, E., et al. 2010, A&A, 518, L155
- Gebhardt et al. (2000) Gebhardt, K., Bender, R., Bower, G., et al. 2000, ApJ, 539, L13
- Gehrels et al. (2004) Gehrels, N., Chincarini, G., Giommi, P., et al. 2004, ApJ, 611, 1005
- Gofford et al. (2013) Gofford, J., Reeves, J. N., Tombesi, F., et al. 2013, MNRAS, 430, 60
- Hopkins & Elvis (2010) Hopkins, P. F. & Elvis, M. 2010, MNRAS, 401, 7
- Howell et al. (2010) Howell, J. H., Armus, L., Mazzarella, J. M., et al. 2010, ApJ, 715, 572
- Huchra et al. (2012) Huchra, J. P., Macri, L. M., Masters, K. L., et al. 2012, ApJS, 199, 26
- Inami et al. (2013) Inami, H., Armus, L., Charmandaris, V., et al. 2013, ApJ, 777, 156
- Kalberla et al. (2005) Kalberla, P. M. W., Burton, W. B., Hartmann, D., et al. 2005, A&A, 440, 775
- Kallman et al. (2004) Kallman, T. R., Palmeri, P., Bautista, M. A., Mendoza, C., & Krolik, J. H. 2004, ApJS, 155, 675
- King & Pounds (2015) King, A. & Pounds, K. 2015, ArXiv e-prints [arXiv:1503.05206]
- Kollatschny et al. (2008) Kollatschny, W., Kotulla, R., Pietsch, W., Bischoff, K., & Zetzl, M. 2008, A&A, 484, 897
- Kormendy & Ho (2013) Kormendy, J. & Ho, L. C. 2013, ARA&A, 51, 511
- Markowitz et al. (2006) Markowitz, A., Reeves, J. N., & Braito, V. 2006, ApJ, 646, 783
- Mas-Hesse et al. (2008) Mas-Hesse, J. M., Otí-Floranes, H., & Cerviño, M. 2008, A&A, 483, 71
- Mateos et al. (2010) Mateos, S., Carrera, F. J., Page, M. J., et al. 2010, A&A, 510, A35
- Matt et al. (2000) Matt, G., Fabian, A. C., Guainazzi, M., et al. 2000, MNRAS, 318, 173
- Matt et al. (1996) Matt, G., Fiore, F., Perola, G. C., et al. 1996, MNRAS, 281, L69
- Mineo et al. (2012) Mineo, S., Gilfanov, M., & Sunyaev, R. 2012, MNRAS, 419, 2095
- Moretti et al. (2005) Moretti, A., Campana, S., Mineo, T., et al. 2005, in Society of Photo-Optical Instrumentation Engineers (SPIE) Conference Series, Vol. 5898, UV, X-Ray, and Gamma-Ray Space Instrumentation for Astronomy XIV, ed. O. H. W. Siegmund, 360–368
- Morganti et al. (2005) Morganti, R., Tadhunter, C. N., & Oosterloo, T. A. 2005, A&A, 444, L9
- Motch et al. (1998) Motch, C., Guillout, P., Haberl, F., et al. 1998, A&AS, 132, 341
- Nandra et al. (2007) Nandra, K., O’Neill, P. M., George, I. M., & Reeves, J. N. 2007, MNRAS, 382, 194
- Petric et al. (2011) Petric, A. O., Armus, L., Howell, J., et al. 2011, ApJ, 730, 28
- Piconcelli et al. (2005) Piconcelli, E., Jimenez-Bailón, E., Guainazzi, M., et al. 2005, A&A, 432, 15
- Porquet et al. (2004) Porquet, D., Reeves, J. N., Uttley, P., & Turner, T. J. 2004, A&A, 427, 101
- Ranalli et al. (2003) Ranalli, P., Comastri, A., & Setti, G. 2003, A&A, 399, 39
- Reynolds et al. (1994) Reynolds, C. S., Fabian, A. C., Makishima, K., Fukazawa, Y., & Tamura, T. 1994, MNRAS, 268, L55
- Sanders & Mirabel (1996) Sanders, D. B. & Mirabel, I. F. 1996, ARA&A, 34, 749
- Stierwalt et al. (2014) Stierwalt, S., Armus, L., Charmandaris, V., et al. 2014, ApJ, 790, 124
- Stierwalt et al. (2013) Stierwalt, S., Armus, L., Surace, J. A., et al. 2013, ApJS, 206, 1
- Teng et al. (2013) Teng, S. H., Veilleux, S., & Baker, A. J. 2013, ApJ, 765, 95
- Tombesi et al. (2015) Tombesi, F., Meléndez, M., Veilleux, S., et al. 2015, Nature, 519, 436
- Tombesi et al. (2010) Tombesi, F., Sambruna, R. M., Reeves, J. N., et al. 2010, ApJ, 719, 700
- Valiante et al. (2009) Valiante, E., Lutz, D., Sturm, E., Genzel, R., & Chapin, E. L. 2009, ApJ, 701, 1814
- Véron-Cetty & Véron (2001) Véron-Cetty, M.-P. & Véron, P. 2001, A&A, 374, 92
- Wilms et al. (2000) Wilms, J., Allen, A., & McCray, R. 2000, ApJ, 542, 914