Outburst evolution, historic light curve and a flash-ionized nebula around the WZ Sge-type object PNV J03093063+2638031
We have monitored the 2014 superoutburst of the WZ Sge-type transient PNV J03093063+2638031 for more than four months, from =11.0 maximum brightness down to =18.4 mag, close to quiescence value, by obtaining photometry and low resolution fluxed spectroscopy. The evolution was normal and no late-time ‘echo’ outbursts were observed. The absolute integrated flux of emission lines kept declining along the superoutburst, and their increasing contrast with the underlying continuum was simply the result of the faster decline of the continuum compared to the emission lines. Inspection of historical Harvard plates covering the 1899-1981 period did not reveal previous outbursts, neither ‘normal’ nor ’super’. We discovered an extended emission nebula (radius 1 arcmin) around PNV J03093063+2638031, that became visible for a few months as the result of photo-ionization from the superoutburst of the central star. It is not present on Palomar I and II sky survey images and it quickly disappeared when the outburst was over. From the rate at wich the inization front swept through the nebula, we derive a distance of 120 pc to the system. The nebula is density bounded with an outer radius of 0.03 pc, and the absolute magnitude of the central star in quiescence is MV14.2 mag. The electron density in the nebula is estimated to be 105 cm-3 from the observed recombination time scale. Given the considerable substructures seen across the nebula, a low filling factor is inferred. Similar nebulae have not been reported for other WZ Sge objects and the challenges posed to models are considered.
Key Words.:
(stars:) novae, cataclysmic variables1 Introduction
According to the reports appeared on TOCP (Transient Object Confirmation Page Reports) web page of the IAU Central Bureau for Astronomical Telegrams111http://www.cbat.eps.harvard.edu/unconf/tocp.xml, PNV J03093063+2638031 was discovered on 2014 Oct 29.630 UT (JD=2456960.130) as a 11.0 mag optical transient by S. Ueda observing from Japan with a 25cm reflector. The astrometric position was later refined by S. Kiyota to have end figures 29s.86 and 04′′.49 in RA and Dec respectively, 29s.77 and 04′′.3 by T. Noguchi, and 29s.77 and 04′′.6 by M. Caimmi (cf. TOCP). We take the straight average of these three determinations as the best available J2000 astrometric position of the transient: which is 12.5 arcsec away from the originally reported position and suggests OT J030929.8+263804 as a possibly more appropriate name for the transient.
P. Berardi (cf. TOCP) on Oct 30.8 UT and Santangelo and Gambogi (2014) also on Oct 30.8 UT obtained low resolution spectroscopic observations of PNV J03093063+2638031 that showed a blue continuum, narrow H-alpha line profile and broad absorptions for the other members of Balmer lines, which suggested the object to be a cataclysmic variable (CV) in outburst. Not much else has been published on this transient. VSNET alert-news222http://www.kusastro.kyoto-u.ac.jp/vsnet/ reported on the detection of early superhumps in time resolved photometry of PNV J03093063+2638031, with an amplitude of 0.025 mag and a period of 0.05613 days (= 80m 49s) on Oct 31/Nov 1. The superhumps remained visible during following weeks.
The transient was soon classified as a new WZ Sge-type object on these VSNET reports. Such a classification is sound, given the presence of early superhumps, the large amplitude of the recorded outburst and its rarity (no previous outbursts recorded). WZ Sge stars are an extreme case of SU UMa-type of CVs, with intervals between superoutbursts lasting decades, while normal outbursts are few and far in between (Hellier 2001). WZ Sge itself undergoes a superoutburst every 30 years (events recorded in 1913, 1946, 1978 and 2001; Kuulker et al. 2011) and has never been seen to undergo a normal outburst in between. At the opposite end of SU UMa-type of CVs are the ER UMa stars, which spend typically a third to half of their time in superoutbursts, going into one every 1-2 months. Outside superoutbursts, the ER UMa stars experience a rapid series of normal outbursts, showing one every few days.
In this paper we report about () the photometric and spectroscopic evolution of PNV J03093063+2638031 (hereafter ’PNV’ for short) during the 2014 superoutburst from our photometry and fluxed spectroscopy, () the results of our inspection of the Harvard plate stack to reconstruct the past photometric history of the object, and () the discovery of a spatially resolved nebula around PNV, flash-ionized by the 2014 superoutburst.
2 Observations
![[Uncaptioned image]](/html/1506.08526/assets/x1.png)
![[Uncaptioned image]](/html/1506.08526/assets/x2.png)
![[Uncaptioned image]](/html/1506.08526/assets/x3.png)
The photometric observations of PNV during the 2014 superoutburst were carried out with three different telescopes. ANS Collaboration telescope N. 11, located in Trieste (Italy), was used when the object was bright. It is a 13cm f/6.6 Vixen ED130SS refractor equipped with Custom Scientific photometric filters and a SBIG ST10XME CCD camera, 21841472 array, 6.8 m pixel providing a focal plane scale of 1.63′′/pix and a field of view of 60′40′. Technical details and operational procedures of the ANS Collaboration network of telescopes running since 2005, are presented by Munari et al. (2012). Detailed analysis of the photometric performances and measurements of the actual transmission profiles for all the photometric filter sets in use at all telescopes is presented by Munari & Moretti (2012). During the latest phases of the outburst, larger instruments were used to measure PNV, namely the Asiago 67/92cm Schmidt and 1.82m reflector telescopes. The 67/92cm f/3.2 Schmidt telescope is equipped with Custom Scientific photometric filters and a SBIG STL-11000MC2 CCD camera, 40082672 array, 9 m pixel providing a focal plane scale of 0.86′′/pix and a field of view of 58′38′. The 1.82m telescope was used with the AFOSC spectrograph-imager, that houses filters and an Andor DW436-BV CCD camera, 20482048 array, 13.5 m pixel providing a focal plane scale of 0.26′′/pix and a field of view of 8.9′8.9′. All measurements on PNV were performed with aperture photometry (the sparse field not requiring the use of PSF fitting), against a photometric sequence located around the variable. The sequence was calibrated from APASS survey data (Henden et al. 2012, Henden & Munari 2014) using the transformation equation calibrated in Munari et al. (2014). Our measurements are plotted in Figure 1 and presented in Table 1, where the reported uncertainties are total error budgets, combining quadratically the error on the variable with the uncertainty of the transformation from the istantaneous local photometric system to the standard one as defined by the local photometric sequence.
Low resolution spectroscopy of PNV was obtained with the 1.22m telescope + B&C spectrograph operated in Asiago by the Department of Physics and Astronomy of the University of Padova. The CCD camera is a ANDOR iDus DU440A with a back-illuminated E2V 42-10 sensor, 2048512 array of 13.5 m pixels. It is highly efficient in the blue down to the atmospheric cut-off around 3200 Å, and it is normally not used longward of 8000 Å for the fringing affecting the sensor. The long-slit spectra were recorded with a 300 ln/mm grating blazed at 5000 Å, and extend spatially for 9.5 arcmin (at a scale of 1.119 arcsec/pix) covering the wavelength range from 3300 to 8000 Å at 2.31 Å/pix. The spectra were reduced within IRAF, carefully involving all steps connected with correction for bias, dark and flat, sky subtraction, wavelength and flux calibration. The error on the flux calibration at all epochs should not exceed 6% anywhere as the intercalibration of the spectrophotometric standards suggests and the comparison with the near-simultaneous confirms. Table 2 provides a log-book of the spectroscopic observations and the spectra of PNV at the first four epochs are plotted in Figure 2.
3 Progenitor
At the improved position for PNV derived in sect. 1, a faint star is clearly visible on both Palomar I and II sky survey images, which was also detected by various surveys and listed in several catalogs at the positions given in Table 3. The straight average of their end figures is 29s.744 (0.020) and 04′′.39 (0.10), coincident within combined errors with the observed position of PNV.


The PNV progenitor is a faint and blue star. Its USNO-B1.0 magnitudes on Palomar I and II surveys are =19.18, =18.66 and =19.22, =18.14, =18.70. The GSC 2.3 catalog reports for PNV =18.80, =18.25, and =18.35. The SDSS survey measured it at =19.137 0.031, =18.882 0.009, =18.907 0.012, =19.011 0.017 and =18.969 0.050 mag. It was also detected by the GALEX ultraviolet survey at FUV=19.606 0.210 and NUV=19.607 0.128 mag (=1540 Å and =2315 Å). It was too faint for detection by 2MASS at , and wavelengths, but it was detected at mid-infrared wavelengths by AllWISE survey at magnitudes =16.397 0.082 (S/N=13.3) and =16.311 0.275 (S/N=4.0), where =3.35 m and =4.6 m. The AllWISE program (Cutri et al. 2013, VizieR On-line Data Catalog II/328) extends the work of the WISE space mission (Wright et al. 2010) by combining data from the cryogenic and post-cryogenic survey phases.

The spectral energy distribution of the PNV progenitor is presented in Figure 4. It is well fitted by a power law over the whole UV-opt-IR wavelength range covered by GALEX, SDSS and AllWISE observations, compatible with an accretion disk dominating the emission from system in quiescence (La Dous 1989). The completeness limits of 2MASS survey in the area around PNV are 16.5, 16.0, and 15.5 and the corresponding fluxes lie well above the fitting line in Figure 4, in agreement with the non detection of PNV by 2MASS. For reference purposes it is useful to list the conventional Johnson-Cousins and 2MASS magnitudes corresponding to the linear fit in Figure 3: =18.76, =19.51, =19.53, =19.23, =19.09, =18.58, =18.11, and =17.55.
4 Historical lightcurve from Harvard plates
The superoutbursts in WZ Sge stars are separated by decades, and the normal outbursts in between are rare or even absent. To test if this is also the case for PNV, we went to the Harvard plate stack in Cambridge (USA) to inspect historical photographs covering the position of PNV. The vast majority of the plates at Harvard are blue sensitive and exposed through lense-astrographs without intervening photometric filters. In modern terms, this is roughly equivalent to observe in the band. The 2014 superoutburst peaked at 10.8, so we narrowed our search to plates going deep enough to reach at least a limiting magnitude of 10.8 in blue light. Out of the 600 plates that we inspected, 332 of them were of a photometric quality meeting such criterion, covering the time interval from Jan 1899 to Nov 1981. Given the short focal length of most of the astrographs used to expose the Harvard plates, we augmented the photometric sequence around PNV (described in sect.2 and optimized for the longer focal length CCD observations obtained during the 2014 superoutburst) with additional stars spanning a wider range in magnitude and at greater angular distances from PNV. They too were selected from the APASS survey. The final sequence extends from =10.152 to 17.155 mag, and it was used at the microscope eyepiece to estimate the brightness of PNV or the limiting magnitude of the plate (defined as the mid-point magnitude between the faintest sequence star still visible and the brightest of those not visible).
The limiting magnitude of the 332 plates ranged from 10.8 to 16.5. On all of them PNV was too faint to be detected. The results are listed in Table 4 (available electronic only) and are plotted in Figure 4. During the 2014 superoutburst, PNV took less than a month to decline below the limiting magnitude of the deepest Harvard plates. Such a fast evolution could easily accommodate similar events in the time gaps uncovered by the Harvard plates, including those due to Solar conjunction. Nonetheless, the very fact that PNV went undetected on all 332 plates we inspected suggests that its outbursts are a rare occurrence, in nice agreement with the well established behavior of WZ Sge stars as a class.
5 The 2014 outburst
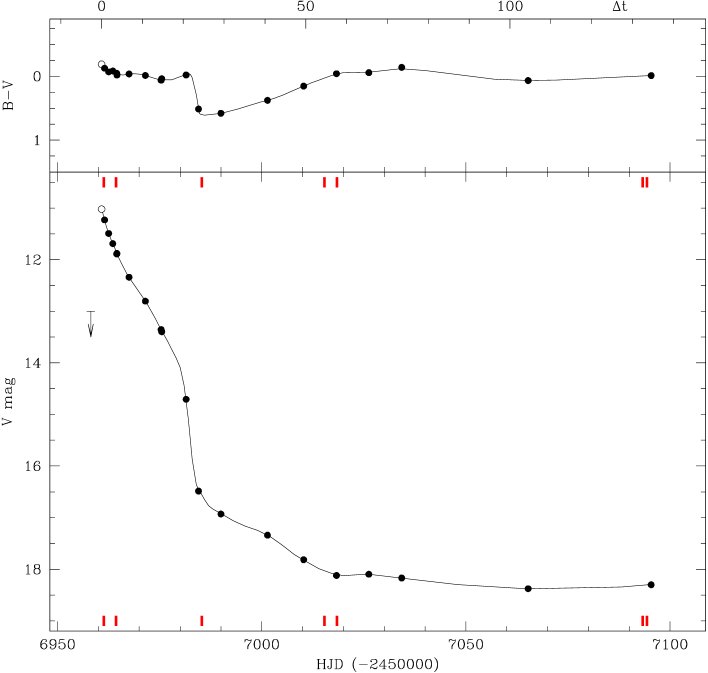
The photometric evolution of the outburst is presented in Figure 1. It is closely similar to that seen in the other WZ Sge-type objects (eg. Nogami et al. 2009, Chochol et al. 2012). It is composed of three distinct parts.
Our observations begun on JD=6961.511, about one day past the original discovery observations by S. Ueda, and as soon as darkness allowed after the announcement of the discovery was posted to TOCP. We catched the object already declining from maximum, 0.2 mag below it. S. Kiyota (Japan, as reported on TOCP) obtained =10.83, =11.02 and =10.92 on Oct 30.28 UT (JD=2456960.78), which we take to mark the optical maximum and that is plotted as an open circle in Figure 1. According to the discovery report by S. Ueda, nothing was visible down to 13 mag at the position of PNV two days before the discovery (marked by the arrow in Figure 1). Therefore, the rise to maximum was (very) fast and, upon hitting maximum brightness, PNV immediately begun declining. The initial decline, usually referred to as the ”plateau” in literature, developed at a nearly constant 0.0 and took PNV from peak =11.0 down to =14.0 in 19 days. The spectra of PNV soon after maximum (cf Figure 2) are typical of CV variables in outburst, with a strong A-type continuum and broad hydrogen Balmer and HeI absorption lines. The Balmer continuum is also in absorption and a weak emission core is visible in H and marginally in H.
This first phase was followed by a very rapid drop in brightness, from =14.0 to =16.5 in just 4 days, which was accompanied by cooling of the color from 0.0 to +0.6 mag. This change in color is nicely confirmed by the change in the slope of the continuum of the corresponding spectrum shown in Figure 2. Following this rapid drop, the spectrum of PNV developed strong hydrogen Balmer emission lines, the absorption in the Balmer continuum vanished and early hints emerged of the very wide hydrogen Balmer absorption lines from the underlying white dwarf. The apparent reinforcing of the Balmer emission lines was actually driven by the rapid drop in intensity of the underlying continuum. In fact, the integrated flux of the H emission line for the four spectra presented in Figure 2 declined steadily with time: it was 105, 81, 9.8 and 5.910-15 erg cm-2 sec-1, respectively.
The third and last phase saw PNV to slowly complete the final decline toward quiescence brightness, in pace with a gradual warming of the color from +0.6 back to 0.0 mag. This phase took PNV from =16.5 to =18.1 in 35 days, and to =18.4 in additional 45 days. This is still one mag brighter than the quiescence level, taken to be represented by the linear fit of Figure 3 (see sect. 3), suggesting that the return to proper quiescence required significant additional time. Our spectrum of PNV obtained when its was =18.1 mag, displays strong and very wide Balmer absorption lines from the underlying white dwarf. H emission completely fills in the corresponding absorption line, while higher Balmer lines are reduced to just emission cores. This is the combined effect of a reduction in the integrated flux of emission lines for higher term Balmer lines (5.9, 3.7, and 1.910-15 erg cm-2 sec-1 for H, H and H, respectively) and the underlying white dwarf spectrum rapidly increasing in intensity toward the blue. No terminal echo outbursts, of the type displayed for example by EG Cnc (Patterson et al. 1998), was observed in PNV during the return to quiescence brightness (cf Figure 1).
![[Uncaptioned image]](/html/1506.08526/assets/x8.png)
6 Discovery of a large, spatially resolved and outburst-ionized emission nebula around PNV J03093063+2638031
A very peculiar, probably unique feature of PNV among known WZ Sge-type stars, is the detection of a spatially extended nebula centered on the variable that became briefly visible because ionized by the 2014 outburst, proving its firm physical association to PNV. We discovered it during the spectroscopic observations with the Asiago 1.22m telescope, carried out in long-slit mode with the slit height extending for about 9.5 arcmin on the sky. The nebula is not of the reflection type (thus producing a light-echo of the outburst), because it is visible only in the Balmer emission lines and not in the continuum (which was brighter than the emission lines around outburst maximum).
On the first observation on 30 Oct 2014 (day +0.51) there is no hint of spectral emission features spatially extending more than the stellar continuum. However, on the next spectrum obtained on 2 Nov, day +3.52, the H emission was already noticeably extended, in a similar manner on both sides of the stellar spectrm. The spatial FWHM of the stellar spectrum (dominated by seeing dispersion) was 3.92 pixels, that of the H was 11.62 pixels. This corresponds to a seeing-corrected FWHM(H)=12.2 arcsec.
From this we may estimate a distance to PNV if we assume that this extended H emission is produced within a spherical and homogeneous nebula centered on PNV, that begins to emit by recombination as soon as the ionizing radiation from the outbursting central star reaches it. The time passed from discovery (when the object was already close to maximum brightness) to our spectroscopic detection of the extended nebula was 4.17 days. Assuming that the rise to maximum of PNV was nearly istantaneous, this means that the outer radius of the ionized volume was at that time 1.11016 cm from PNV, or 3.510-3 pc. Comparing with a FWHM of 12.2 arcsec, the distance turns out to be 120 pc, and the absolute magnitude in quiescence is MV=14.1 (assuming a negligible extinction at the high galactic latitude of PNV).
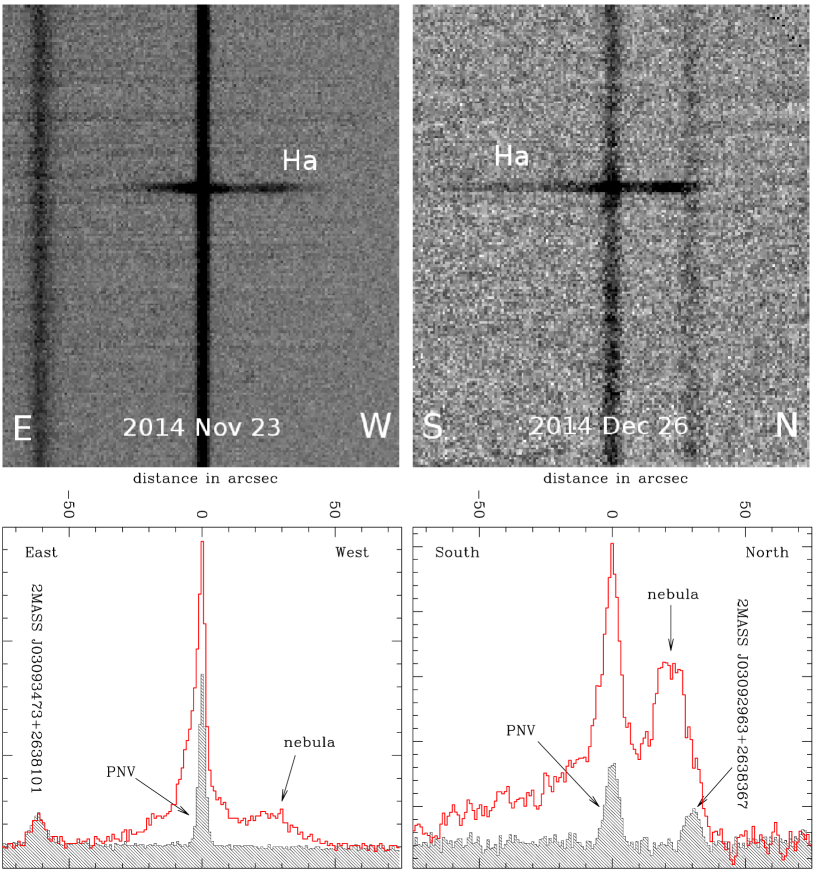
Next time we observed again PNV it was 21 days later (Nov 23), when the star was 4.6 mag fainter. The bright plateau past maximum was over by 6 days and with it the sustained input of ionizing photons to the circumstellar medium. By this time the spatial extent of the ionized nebula had significally grown. The appearance of the spatially extended H emission on this spectrum is shown on the left panel of Figure 4. The outer portion of the nebula extends to 40 arcsec toward East and 50 arcsec to the west of PNV, with considerable substructures visible in the intensity profile, indicating large departures from spherical symmetry in the distribution of the gas.
A month later, we invested considerable observing time at two distinct and nearby dates (Dec 23 and 26) to obtain long-slit spectra of PNV at two perpendicoular orientations, East-West and North-South. The spatially extended H emission along the East-West was similar to that of a month earlier, only with a reduced brightness. This indicates that not much gas exists external to that already ionized by Nov 23 (density bounded nebula), and that the ionized gas was already completing the recombination given the long gone photo-ionization from the central star. The spatially extended profile along the North-South direction for Dec 26 observations is shown on the right panel of Figure 4. The H profile along the North-South directions extends by similar amounts compared to East-West: 35 arcsec toward North and 65 arcsec toward South, indicating that PNV sits approximately at the projected center of the nebula. Considerable sub-structures are visible also along the North-South spatial extention of the nebula, as it is for the East-West.
To check on the photo-ionization/recombinations scenario for the nebula, we re-observed PNV with the same instrumentation in March 2015, exposing much longer than previous visits. No trace of the nebula was more visible, indicating that recombination within the ionized gas was by that time completed and the circumstellar nebula had returned to obscurity from which it had briefly emerged during the superoutburst of 2014. The great surface brightness it displayed (expecially at the time we discovered it) would have resulted in an easy detection on the red Palomar Sky Survey plates, but they shows just empty sky at the position of the nebula.
7 Discussion
At the limited spectral resolution of our spectra, the spectral width of the spatially extended H is comparable to that of the lines from the NeArFe calibration lamp or the night-sky lines (their FWHM corresponds to 250 km/sec at H wavelengths). This means that the local velocity dispersion within the circumstellar gas is low, in particoular the gas is not fast expanding. The nebula also does not rotate with a large angular velocity, nor it is subject to large scale motions because its emission is centered at the same wavelength along its whole spatial extent. In short, the circumstellar nebula looks like a quiet blob of gas, with considerable sub-structures and a clear physical association to PNV.
The hydrogen recombination time scale (in hours) is related to electron temperature and density by:
| (1) |
following Ferland (2003). With an observed recombination time scale of the order of two months, the electron density is 2.6, 4.5 or 7.9105 cm-3 for =5000, 10000 or 20000 K, respectively.
With a mean angular extension of 50 arcsec and a distance of 120 pc, the physical radius of the nebula is 0.03 pc, or 1/10 of a typical planetary nebula. If homogeneously filled by hydrogen at the density estimated above for =10000 K, its mass would be 1.1 M⊙. The marked sub-structures visible in Figure 4 suggest that a sizeable fraction of the available volume is indeed empty. Even if the filling factor would be just a tiny 1%, still the amount of mass in the nebula would be orders of magnitude greater than that ejected by outbursts on white dwarfs, like nova eruptions that - depending on the mass of the white dwarf - are observed to expel from 10-6 to 10-4 M⊙ (Bode & Evans 2008). Furthermore, the ejection velocities observed in novae (from several hundreds to a few thousand km/s, Warner 1995) are much larger than the low (if any) expansion velocity observed for the nebula around PNV.
Appreciable mass ejection cannot be expected from WZ Sge-type binaries, based on their nature. Such systems are composed by a white dwarf orbited every 80 min by a brown dwarf, the mass of the latter being of the order of a mere 0.06 M⊙ (Hellier 2001), below the limit for stable hydrogen burning in the core. The mass transfer rate in such system is extremely low, 10-12 M⊙/yr, and the mass reservoir in the donor star virtually null. Thus, it is highly improbable that the nebula around PNV originated from the brown dwarf companion.
It could be speculated that the nebula around PNV is the remnant of the slow wind the AGB progenitor blown off before turning into the present day white dwarf. There are however several problems with this origin too. The dilution of AGB wind into the surrounding instertellar space is rapid, of the order of 104 yrs which is the age of common planetary nebulae, and the evolutionary path leading to the formation of WZ Sge-type binaries is instead much longer than that (109 yrs). Furthermore, AGB winds produce a lot of dust. In fact, planetary nebulae show clear signs of thermal emission from dust mixed with the gas, but the 2MASS and AllWISE data indicate that no detectable dust is present in PNV.
The circumstellar nebula that should not exist is instead stubbornly there, with a clear physical association to PNV as proven by the sudden photo-ionization induced by the 2014 superoutburst. In light of the challenges this nebula seems to pose to theoretical models, it is highly advisable to search for similar nebulae around future WZ Sge-type transients. This will require spectrographs equipped with long slits and the investment of long integration times, not easy to accommodate in present times dominated by remote service observing and multi-object, fiber-fed spectrographs.
Acknowledgements.
We would like to thank Alison Doane, Curator of Astronomical Photographs at the Harvard College Observatory, for granting access to the Harvard plate stack, and Stella Kafka for hospitality at AAVSO Headquarters. This work was supported in part by the University of Rijeka under the project number 13.12.1.3.03. and by the Croatian Science Foundation under the project 6212 Solar and Stellar Variability.References
- (1) Bode M. F., Evans A., 2008, eds. Classical Novae, Cambridge University Press
- (2) Chochol D., Katysheva N. A., Shugarov S. Y., Zemko P. O., Andreev M. V., 2012, CoSka, 42, 39
- (3) Ferland G. J., 2003, ARA&A, 41, 517
- (4) Hellier A., 2001, Cataclysmic Variable Stars, Springer & Praxing Publishing (Chichester, UK)
- (5) Henden A. A., Levine S. E., Terrell D., Smith T. C., Welch D., 2012, JAVSO, 40, 430
- (6) Henden A., Munari U., 2014, CoSka, 43, 518
- (7) Kuulkers E., Henden A. A., Honeycutt R. K., Skidmore W., Waagen E. O., Wynn G. A., 2011, A&A, 528, AA152
- (8) La Dous C., 1989, A&A, 211, 131
- (9) Munari U., Moretti S., 2012, BaltA, 21, 22
- (10) Munari U., et al., 2012, BaltA, 21, 13
- (11) Munari U., et al., 2014, AJ, 148, 81
- Nogami et al. (2009) Nogami D., et al., 2009, ASPC, 404, 52
- (13) Patterson J., Richman H., Kemp J., Mukai K., 1998, PASP, 110, 403
- (14) Santangelo M., M. M., Gambogi S., 2014, ATel, 6653, 1
- (15) Warner B., 1995, Cataclysmic variable stars, Camb. Astrophys. Ser., Vol. 28
- (16) Wright E. L., et al., 2010, AJ, 140, 1868