∗New affiliation: ]Paul Scherrer Institut, 5232 Villigen PSI, Switzerland
New affiliation: ]University of Washington, Seattle, United States of America New affiliation: ]Department of Physics, North Carolina State University, Raleigh, USA
Experimental study of ultracold neutron production in pressurized superfluid helium
Abstract
We have investigated experimentally the pressure dependence of the production of ultracold neutrons (UCN) in superfluid helium in the range from saturated vapor pressure to 20 bar. A neutron velocity selector allowed the separation of underlying single-phonon and multiphonon processes by varying the incident cold neutron (CN) wavelength in the range from to 10 Å. The predicted pressure dependence of UCN production derived from inelastic neutron scattering data was confirmed for the single-phonon excitation. For multiphonon based UCN production we found no significant dependence on pressure whereas calculations from inelastic neutron scattering data predict an increase of 43(6) % at 20 bar relative to saturated vapor pressure. From our data we conclude that applying pressure to superfluid helium does not increase the overall UCN production rate at a typical CN guide.
I Introduction
Ultracold neutrons (UCN) have energies below 300 neV and can be stored for long observation time in magnetic or material bottles Golub1991 . This peculiarity makes them attractive for high precision measurements of fundamental properties of the neutron which are relevant for particle physics and cosmology Dubbers2011 . The most prominent example is their use for searches of a neutron electric dipole moment Baker2006 ; Pospelov2005 ; Lamoreaux2009 ; Baker2011 ; Altarev2012 ; Serebrov2014 which would give direct evidence of CP-violation beyond the Standard Model of particle physics. Other projects aim to improve the knowledge of the neutron -decay lifetime which is crucial for calculations of big bang nucleosynthesis Coc2007 . Together with correlation measurements in neutron decay it contributes to a more precise understanding of weak semileptonic processes in the first quark generation Severijns2006 ; Abele2008 . New developments might follow from observations and manipulations of quantum states of UCN in the Earth’s gravitational field Nesvizhevsky2002 ; Jenke2011 ; Jenke2014 . All of these endeavors greatly benefit from an increase of UCN counting statistics in their experiments.
Current projects to increase the density of UCN for physics experiments employ neutron converters of superfluid helium (He-II) Huffman2000 ; Masuda2002 ; Baker2003 ; Zimmer2007 ; Zimmer2010 ; Piegsa2014 and solid deuterium Trinks2000 ; Anghel2009 ; Korobkina2007 ; Saunders2013 ; Lauer2013 ; Lauss2013 . They exploit the concept of a superthermal source Golub1975 where the converter temperature can be much higher than the UCN “temperature”. Upscattering of UCN is suppressed by the Boltzmann factor if the energy of excitations in the converter is large compared to its temperature. Using liquid He as converter was proposed in Golub1977 and first experimentally realized in Ageron1978 .
In He-II the main contribution to UCN production is due to single-phonon excitations (see Baker2003 for a separation of UCN production in single- and multiphonon contributions), which occur at the crossing point of the dispersion relations of the free neutron and of He-II. At saturated vapor pressure (SVP), (derived from the data in Gibbs1999 ,111Note that a more accurate value for SVP may be derived from the comprehensive data collection Donnelly1998 . However, we wanted to base our comparisons with scattering data on one consistent data set.). Application of pressure shifts to lower values, where the differential flux is higher for a typical neutron beam in a guide coupled to a liquid deuterium CN source, which typically has its flux maximum around 4 Å. Combined with an increase in density of He-II with pressure one may anticipate an overall gain in UCN production.
However, a quantitative analysis based on a method described in Ref. Korobkina2002 using inelastic neutron scattering data at SVP and 20 bar from Gibbs1999 predicted a net decrease in single-phonon UCN production Schmidt-Wellenburg2009 ; Schmidt-WellenburgPhD . On the other hand, these same calculations also predicted an increase in the production from multiphonon excitations at 20 bar. We wished to test these calculations and quantify the UCN production in pressurized He-II by a direct measurement.
Independent of UCN production, another motivation for performing these studies is the larger dielectric strength of pressurized He-II Hara1998 . This is of particular interest for searches of the neutron electric dipole moment within He-II using electrical fields of several 10 kV/cm Harris2010 .
II Experimental setup
The experiment took place at the CN beam facility PF1b Abele2006 of the Institut Laue-Langevin, France. A schematic diagram of the experimental setup is shown in Fig. 1. The setup for the He-II UCN production target and UCN extraction was similar to the one described in Zimmer2007 ; Zimmer2010 ; Piegsa2014 : The target was located inside a cryostat equipped with a commercial two-stage Gifford McMahon cold head with a cooling power of 1.5 W at 4.2 K. In the cryostat, gaseous He with 99.999% purity was liquefied and cooled below the -transition to superfluidity by a continuous 4He evaporation stage. 3He was removed by passing the superfluid through a superleak (for technical details on the used design, see Zimmer2010 ) into the UCN production volume. Ultracold neutrons were extracted by an inverted U-shaped stainless steel UCN guide to a 3He UCN detector. For further details, see Zimmer2007 ; Piegsa2014 ; Schmidt-WellenburgPhD .
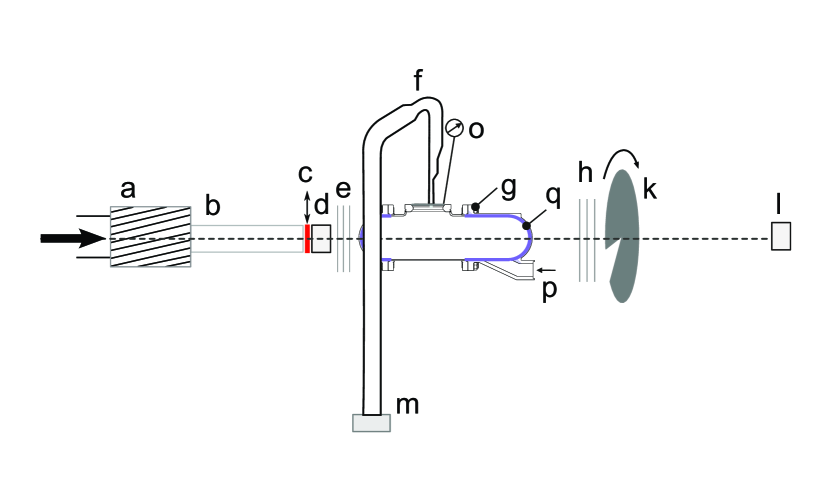
In order to allow for measurements at high pressure, a dedicated He-II container was used as converter vessel. It consisted of a stainless steel tube (inner diameter 66 mm, length 193.8 mm) with two spherical end caps from aluminum (radius , wall thickness 3 mm) for passage of the CN beam. Its total volume was and the intersection volume with the neutron beam about . The cylinder was coated with natural nickel and the end caps had nickel half-spherical shells inserted on the inside to increase the neutron optical potential for UCN storage. The UCN flapper valve used in Zimmer2007 for window-less extraction was replaced by an aluminum window ( thickness) supported by a stainless steel disk with an array of holes (effective hole area ). The 3He evaporation stage serving to further cool the production volume had to be operated with 4He due to the higher heat load of the high pressure volume. Therefore the target temperature reached only 1.1 K instead of 0.7 K obtained in Zimmer2007 . The temperature of the He-II was measured using a calibrated Cernox222Model: CX-1030-CU, Lake Shore Cryogenic, Inc. sensor screwed tightly to the outside of the He-II vessel. The pressure was applied from the gaseous He supply via the liquefaction chain through the superleak and measured with a room-temperature pressure gauge calibrated for relative to atmospheric pressure. The gauge was connected to the converter via a thin stainless steel tube which could also be used for pumping to establish SVP conditions.
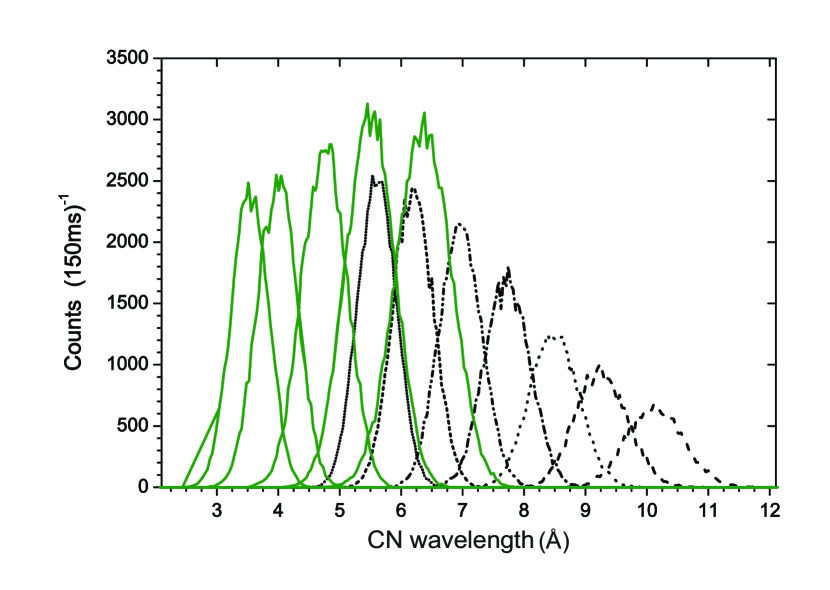
A neutron velocity selector Wagner1992 was used to scan the incident CN wavelength range. It had to be used in two orientations, and with respect to the incident beam, as the normal position () did not give access to the entire wavelength range of interest. Hence, two scans were performed: from Å to Å and from Å to Å. Depending on the angular and rotational settings of the velocity selector a wavelength spread of was obtained for , respectively. After passage of a m long secondary neutron guide (cross section mm2) with natural nickel coating, a fast shutter in front of the beam monitor was used to open and close the beam (opening and closing time less than 1 s). Before entering the beam monitor the beam’s cross section was reduced to with two circular apertures made from B4C. Images of the beam at various distances behind the monitor were taken before the cryostat was set up. They showed that the beam passed through the production volume without touching its cylindrical sidewall for all selected incident wavelengths. A time-of-flight (TOF) system for spectral analysis of the incident spectrum was set up behind the cryostat. It consisted of a chopper — a disc rotating at 1000 RPM with four radial rectangular slits (width 3 mm) passing by a fixed aperture of the same dimensions — and a 3He CN-monitor with a detection efficiency proportional to ( is the neutron velocity) placed 2 m downstream. The corresponding wavelength spectra for some selected velocity selector settings are displayed in Fig. 2.
III Measurements
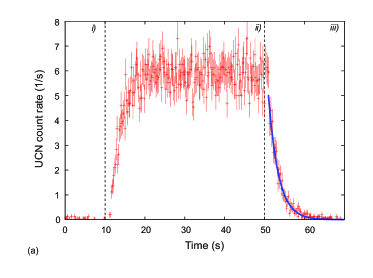
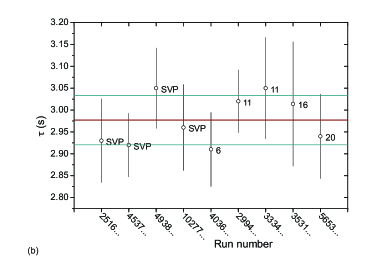
Scans of UCN count rate versus CN wavelength were performed at absolute pressures and temperatures , , , , and (SVP, 1.08), with temperature fluctuations during individual scans. The UCN production rate was first measured in the long wavelength range with the velocity selector angle set to for all pressures. Then the measurement of the UCN production rate in the short wavelength range () followed. For each pressure and angular setting, three up – down scans were performed with the same set of velocity selector frequencies corresponding to wavelength increments of about Å. During each scan the UCN production rate for a specific rotation frequency was measured five times. Each of these measurements was divided into three phases as shown in Fig. 3: i) 10 s with CN-shutter closed to verify the absence of UCN in the converter vessel; ii) 40 s with CN-shutter open to record the build-up and saturation of the UCN rate; iii) 20 s with CN-shutter closed to record the emptying of the converter vessel. The decrease in rate during phase (iii) was fitted with an exponential function (see Fig. 3): , where the fit parameter is the storage lifetime of the converter ( for SVP at ). The beam-independent background was determined in dedicated measurements with CN-shutter closed. This parameter was kept fixed in the fits. It was found that the storage lifetime was independent of pressure (see Fig. 3b). Increasing the temperature to 1.48 K decreased to 1.7(1) s. This temperature behavior combined with results from UCN Monte Carlo simulations with Geant4UCN Atchison2005 and simple gas kinetic arguments showed that the storage lifetime was dominated by UCN escaping through the extraction holes. Hence, changes in count rate due to the small temperature fluctuations of were negligible.
In phase (ii), the background was increased by a beam-dependent component causing a constant offset to the UCN build-up prompt with opening the CN shutter. A systematic error will follow if this offset is not properly taken into account. The component was determined by fitting the build-up with an exponential with constant background . It was expected to be proportional to the CN monitor count rate since CN monitor and UCN detector both had a low efficiency proportional to for CN. Therefore was determined for four different velocity selector settings (maximum of single-phonon production and three settings with low ratio of UCN production to CN monitor count rate). A fit of the four values with where was the CN count rate of the beam monitor (), yielded . All data of phase (ii) was corrected for both background contributions, by typically .
In addition to these scans the UCN production rates across the single-phonon peak at SVP were measured several times during the entire experiment to check the reproducibility. The UCN count rate was found to decrease with time. This is suspected to be due to gas freezing out on the thin aluminum window at the extraction holes or on the surface of the extraction guide. An exponential decrease with respect to the start of the first measurement (): with a large offset and time constant h was found to describe this effect well and thus was used to correct the data. The corrected UCN counts were normalized to the particle flux as measured by the beam monitor (monitor count rate is corrected for dead time and efficiency). Time-of-flight measurements (see Fig. 2) were used to determine a central wavelength for each setting of the velocity selector. The measured TOF spectra were deconvoluted taking into account the opening function of the chopper and the finite thickness of the TOF detector. A logarithmic normal distribution was found to describe the skewed deconvoluted spectra better than a symmetric Gaussian and was used to find the position of the maximum of each spectrum. Hence, each UCN production rate, which is in fact an integral UCN production rate of the specific CN spectrum of this velocity selector setting, was assigned to one wavelength . The uncertainty of the wavelength measurement was estimated as %.
IV Results
The measured wavelength-dependent UCN rates for all pressures, normalized to the incident particle flux, are shown in Fig. 4. Two different regions can be distinguished for all pressures: a broad distribution for short incident wavelengths from UCN production by multiphonon processes and a pronounced peak at long wavelengths from UCN production from single-phonon excitation in He-II. These regions are separated by a minimum which gets less pronounced with pressure at the available wavelength resolution. Note that the wavelength resolution was limited by the resolution of the velocity selector (the same for the range of all single-phonon peaks shown). With pressure the single-phonon peak decreases in intensity and moves towards shorter wavelengths.
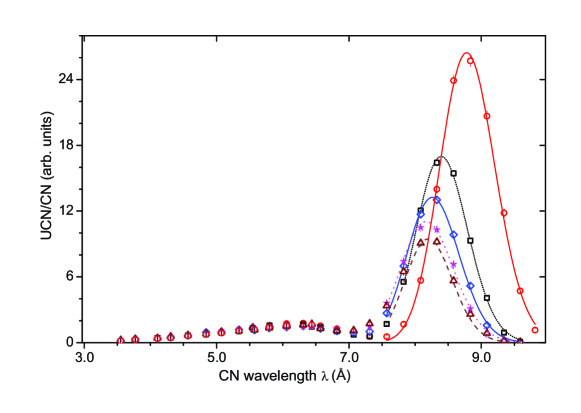
The area under the peak is proportional to the UCN production rate by single-phonon excitation. The apparent peak width comes from the convolution of the incident CN spectra with the extremely narrow single-phonon scattering function (the linewidth of the roton excitation in 4He at 1 K is of the order of 1 µeV, see e.g. Ref. Keller2004 , compared to the resolution of of the velocity selector at 8 Å). The peak was fitted with a logarithmic normal distribution in -space. This ansatz fitted best the CN spectra and was used here again since the single-phonon UCN production rate is proportional to the CN intensity at for each incident CN spectrum. Note that fits with logarithmic normal distributions gave for all pressures reduced values closer to unity than a symmetric Gaussian distribution. The fitting range was restricted to wavelengths larger than Å, hence excluding contributions from multiphonon processes. The positions of the maximum of each fit function were observed for all pressures at values smaller than expected from the crossing point of the dispersion relations of He-II and the free neutron. They are listed in Tab. 1 together with the UCN production rates normalized to the rate at SVP. All single phonon UCN production rates were taken from the integrals over the fitted curves for .
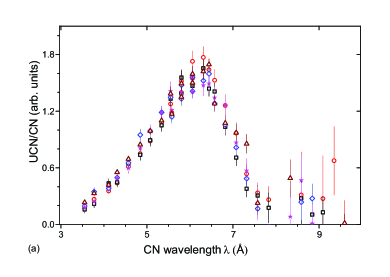
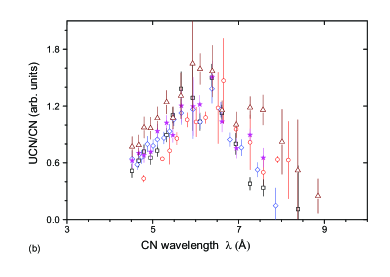
The obtained fits were then subtracted from the data in order to extract the UCN production rates due to multiphonon processes. These are shown scaled up in Fig. 5 and found to exhibit a broad, pressure-independent maximum at approximately 6.25 Å. For estimating the relative change of UCN production due to multiphonon excitation and multiple scattering with pressure we used a simple sum over data points for , which was found to remain constant within errors in this range (see Table 1).
V Discussion
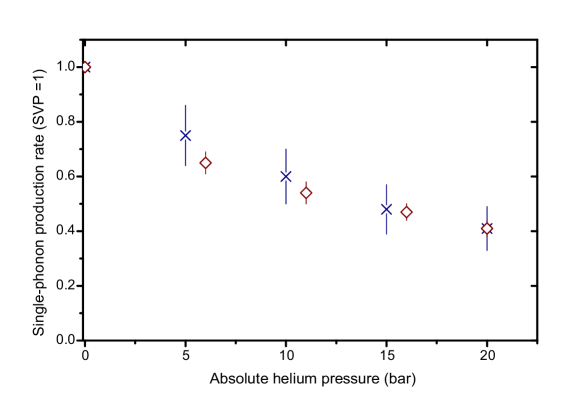
In our experiment we observed the anticipated decrease of UCN production due to single-phonon processes with pressure. This behavior can be well understood by taking a look at
| (1) |
as derived in an unpublished note of Pendlebury (see also Golub1991 ), where the single-phonon scattering intensity ) decreases from to Schmidt-Wellenburg2009 . This change of the structure factor explains most of the observed decrease. Smaller contributions come from the change of and from reduced overlap between the dispersion relations of He-II and of the free neutron taken into account by the parameter to (values deduced from the scattering data Gibbs1999 , see Schmidt-WellenburgPhD ). The increase in helium number density from to (calculated from the mass densities at 0.1 K from Abraham1970 ) cannot compensate these effects. Note that the factor does not contribute to the normalized data in Fig. 4. Its inclusion for a typical CN spectrum does also not compensate the discussed decreases. This behavior confirms the results from calculations, which agree within errors with the experimental results, see Tab. 1 and Fig. 6.
We observe a displacement of all measured single-phonon production rate peaks to lower wavelengths than anticipated from the crossing points of the free neutron dipsersion curve with the one of He-II. This can be explained by an unintentional displacement of TOF monitor by 5 cm, the width of the detector. This most probably has happened during the setup for the second measurement period (the only one which delivered data). For this reason we present all our results in table 1 using a “corrected” wavelength scale .
| experiment | from Ref. Schmidt-Wellenburg2009 ; Schmidt-WellenburgPhD | ||||||||||||||
|---|---|---|---|---|---|---|---|---|---|---|---|---|---|---|---|
| s-ph | m-ph | s-ph | m-ph | ||||||||||||
| [bar] | [Å] | [Å] | [bar] | [Å] | |||||||||||
| SVP | 8. | 70(1) | 8. | 92(set) | 1 | 1 | SVP | 8. | 92(2) | 1 | 1 | ||||
| 6 | 8. | 31(1) | 8. | 52(1) | 0. | 65(4) | 0. | 93(4) | 5 | 8. | 54(4) | 0. | 75(11) | 1. | 09(3) |
| 11 | 8. | 18(1) | 8. | 39(1) | 0. | 54(4) | 0. | 97(4) | 10 | 8. | 39(2) | 0. | 59(10) | 1. | 12(3) |
| 16 | 8. | 10(1) | 8. | 30(1) | 0. | 47(3) | 0. | 97(4) | 15 | 8. | 30(2) | 0. | 47(9) | 1. | 17(6) |
| 20 | 8. | 09(1) | 8. | 29(1) | 0. | 41(3) | 1. | 03(4) | 20 | 8. | 26(2) | 0. | 40(8) | 1. | 43(6) |
In the multiphonon range we observed a discrepancy between the measured and the calculated pressure dependence of the UCN production rate (see Tab. 1 and Fig. 5). From calculations we would have expected an increase with pressure, whereas no increase could be observed. The observed pressure independence of the storage time constant does not indicate a change of the UCN extraction probability from the converter vessel with pressure. Note that our experimental approach provides a direct relative comparison of the production rates at different pressures: For a fixed wavelength, the same incident beam was used. Pressure-dependent UCN losses (e.g. due to cracks in the coating of the storage vessel) are independent of the CN wavelength.
One explanation for the discrepancy in the multiphonon region could be a change in the dynamic structure factor with temperature. The calculations Ref. Schmidt-Wellenburg2009 ; Schmidt-WellenburgPhD employ scattering data measured at 0.5 K whereas our measurements were done at 1.1 K. Increasing temperature results, for example, in a broadening of the single-phonon excitation. This increase is small at low temperatures but becomes large towards the -transition Gibbs1999 . In Gibbs1999 the temperature dependence of the single-phonon excitation linewidth for different pressures was determined from fits to the measured dynamic structure factor. No significant change of these values was found below about 1.3 K. Likewise, the multiphonon scattering varies only weakly with temperature Gibbs1999 . Therefore we consider the scattering data measured at 0.5 K as adequate to predict UCN production at 1.1 K. Note that temperature also influences UCN up-scattering but this effect cannot explain the observed discrepancy as it is independent on the CN wavelength, and would also shift the single-phonon data from expectation.
Assuming no significant change of the dynamic structure factor between 0.5 K and 1.1 K, the observed discrepancy can only be explained by an effect depending on both, the CN wavelength and the He pressure, such as inelastic scattering to other than UCN energy. Inelastic scattering has two types of consequences: (i) reduction of the beam intensity averaged over the production volume with respect to the incident one, as scattered neutrons may leave the production volume sideways; and (ii) change in CN energy which may influence the probability of UCN production for the scattered neutron (multiple scattering). Both effects are not taken into account in the calculations.
In order to estimate the reduction of the beam intensity (i) we use the wavelength- and temperature-dependent transmission of neutrons through liquid He at SVP measured by Sommers et al. Sommers1955 . We calculate the volume-average CN flux in the multiphonon range (from 3.5 Å to 7.5 Å) inside the production volume relative to the incoming flux:
| (2) |
Values between 3.5 Å and 4.52 Å were obtained from linear extrapolation of the data given there. We obtain . For 8.9 Å, the correction is . Note that for a longer production volume, the correction would be larger. We define multiphonon and single-phonon production rates, and , as integrals over the respective regions in the CN-normalized UCN production spectrum shown in Fig. 4. In order to compare the observed ratio with the calculations, we need to correct the prediction with the geometry specific attenuation: .
A reduction of CN transmission with increasing pressure could explain the observed discrepancy between the measured and the calculated pressure dependence of multiphonon UCN production. Unfortunately, a quantitative confirmation of this hypothesis is not possible, due to lacking transmission data for higher pressures. Also scattering data for different pressures Gibbs1999 do not cover the high- range needed to calculate the transmission via total scattering.
The change of the CN energy by inelastic scattering (ii) depends on the incident wavelength and the pressure. Scattering to the wavelength is kinematically possible and would increase the probability of UCN production by the scattered CN; however, the width of single-phonon UCN production is very small. Multiple scattering was not taken into account in the calculations Schmidt-Wellenburg2009 ; Schmidt-WellenburgPhD . Its contribution to the UCN production in our setup was estimated by Monte Carlo simulations Farhi2013 based on the McStas package Lefman1999 ; Willendrup2004 . For SVP, multiple scattered CN were found to contribute about 6 % to the UCN production rate in the multiphonon region. This fraction decreases slightly with increasing pressure, to 5 % for . The weak pressure dependence of this small contribution cannot explain the discrepancy between observed and expected pressure dependence of multiphonon UCN production. It changes the calculated relative production rates at SVP to 0.12(1) .
However, it should be noted that the accuracy of the simulations and calculations is limited by the available scattering data: Single data sets cover only a limited -range or provide a limited resolution. Therefore, data sets Bossy2009 ; Bossy2000 ; Gibbs1995 from different instruments and with different resolution settings had to be combined in the simulations Farhi2013 . The scattering data Gibbs1999 used for the calculations Schmidt-Wellenburg2009 ; Schmidt-WellenburgPhD were obtained with two different incident wavelengths at IN6: 4.1 Å for SVP and 4.6 Å for higher pressures. Possibly uncorrected effects may contribute to the observed discrepancies.
VI Conclusion
We have investigated CN-wavelength-dependent UCN production in pressurized He-II for pressures up to bar. The single-phonon UCN production peak moves to shorter wavelength and decreases in intensity, whereas the absolute contribution from multiphonon processes stays constant within the experimental uncertainties. We have found that predictions from calculations based on inelastic neutron scattering data Schmidt-Wellenburg2009 ; Schmidt-WellenburgPhD agree well with the behavior of the single-phonon UCN production rate. However, the same calculations disagree with our measurement in the multiphonon range. There is no indication for a significant change in the dynamic structure factor between 0.5 K and 1.1 K that could invalidate the calculations for our experiment. However, the disagreement could be caused by a pressure- and wavelength-dependent attenuation of the CN beam in the He-II. This hypothesis could not be tested due to a lack of transmission data at higher He pressure. Note that the ratio of multiphonon to single-phonon UCN production would reduce for longer production volumes. The calculations also did not take into account modifications of the CN spectrum by inelastic scattering inside the He-II, but Monte-Carlo simulations showed that the contribution of UCN production by multiple scattered CN and its pressure dependence are too small to explain the observed disagreement.
The disagreement of the position of the single-phonon peak at SVP with earlier measurements by Yoshiki and coworkers Yoshiki1992 and Baker and coworkers Baker2003 can most probably be explained by an accidental displacement of the TOF detector in our experiment.
In general, the relative UCN production rate due to single-phonon and multiphonon processes depends upon the incident CN spectrum. For the spectrum in our experiment we have found that % of the total UCN production over all incident wavelengths are from multiphonon processes. Baker and coworkers Baker2003 found a multiphonon contribution of for a different CN beam. Note that, according to our previous discussion, also the length of the UCN production volume (which was 326 mm in the experiment of Baker and coworkers) influences this ratio.
Using the entire spectrum of a white beam might still be advantageous for a powerful UCN source, as monochromatization by a crystal not only cuts out a narrow wavelength band around Å, but also reduces the intensity of the Bragg reflected beam substantially (factor 2-5 Schmidt-Wellenburg2009 ; Piegsa2014 ). In whatever case, monochromatic or white incident beam, best results are obtained for He-II at SVP; without even taking into account the increase in technical complexity when going to higher pressures. For future searches of the neutron electric dipole moment it might still be beneficial to apply a pressure of a few 100 mbar to increase the dielectric strength without loosing significantly in UCN production. A future perspective to increase UCN production might be the use of solid helium as UCN converter, which was not possible to investigate during this experimental run.
We would like to thank the ILL staff, especially D. Berruyer, T. Brenner, P. Lachaume, P. Mutti, and P. Thomas who made this experiment possible thanks to their technical support. We would like to thank S. Mironov for his important contributions to the design of the cryogenic apparatus. This work has been funded by the German BMBF (contract number 06MT250).
References
- (1) R. Golub, D. Richardson and S. Lamoreaux. Ultra-Cold Neutrons. Adam Hilger, Bristol, Philadelphia, and New York (1991).
- (2) D. Dubbers and M. G. Schmidt. Rev. Mod. Phys. 83 (2011) 1111.
- (3) M. Pospelov and A. Ritz. Ann. Phys. 318 (2005) 119.
- (4) C. A. Baker, D. D. Doyle, P. Geltenbort et al. Phys. Rev. Lett. 97 (2006) 131801.
- (5) S. K. Lamoreaux and R. Golub. J. Phys. G Nucl. Phys. 36 (2009) 104002.
- (6) C. Baker, G. Ban, K. Bodek et al. Phys. Proc. 17 (2011) 159.
- (7) I. Altarev, S. Chesnevskaya, W. Feldmeier et al. Il Nuovo Cimento C 35(4) (2012) 122.
- (8) A. P. Serebrov, E. A. Kolomenskiy, A. N. Pirozhkov et al. JETP Lett. 99 (2014) 4.
- (9) A. Coc. EAS Publication Series 27 (2007) 41.
- (10) N. Severijns, M. Beck and O. Naviliat-Cuncic. Rev. Mod. Phys. 78 (2006) 991.
- (11) H. Abele. Prog. Part. Nucl. Phys. 60 (2008) 1.
- (12) V. Nesvizhevsky, H. Börner, A. Petoukhov et al. Nature 67 (2002) 297.
- (13) T. Jenke, P. Geltenbort, H. Lemmel and H. Abele. Nature Physics 7 (2011) 468.
- (14) T. Jenke, G. Cronenberg, J. Burgdörfer et al. Phys. Rev. Lett. 112 (2014) 151105.
- (15) P. Huffman, C. Brome, J. Butterworth et al. Nature 403 (2000) 62.
- (16) Y. Masuda, K. Hatanaka, S.-C. Jeong et al. Phys. Rev. Lett. 108 (2012) 134801.
- (17) C. Baker, S. Balashov, J. Butterworth et al. Phys. Lett. A 308 (2003) 67.
- (18) O. Zimmer, K. Baumann, M. Fertl et al. Phys. Rev. Lett. 99 (2007) 104801.
- (19) O. Zimmer, P. Schmidt-Wellenburg, M. Fertl et al. Eur. Phys. J. C 67 (2010) 589.
- (20) F. M. Piegsa, M. Fertl, S. N. Ivanov et al. Phys. Rev. C 90 (2014) 015501.
- (21) U. Trinks, F. J. Hartmann, S. Paul and W. Schott. Nucl. Instr. Meth. Phys. Res. A 440 (2000) 666.
- (22) A. Anghel, F. Atchison, B. Blau et al. Nucl. Instr. Meth. Phys. Res. A 611 (2009) 272.
- (23) E. Korobkina, B. W. Wehring, A. I. Hawari et al. Nucl. Instr. Meth. Phys. Res. A 579 (2007) 530.
- (24) A. Saunders, M. Makela, Y. Bagdasarova et al. Rev. Sci. Instr. 84 (2013) 013304.
- (25) T. Lauer and T. Zechlau. Eur. Phys. J. A 49 (2013) 1.
- (26) B. Lauss. Phys. Proc. 51 (2014) 98.
- (27) R. Golub and J. Pendlebury. Phys. Lett. A 53 (1975) 133.
- (28) R. Golub and J. Pendlebury. Phys. Lett. A 62 (1977) 337.
- (29) P. Ageron, W. Mampe, R. Golub, J.M. Pendelbury. Phys. Lett. A 66 (1978) 469.
- (30) M. R. Gibbs, K. Andersen, W. G. Stirling and H. Schober. J. Phys.: Cond. Matt. 11 (1999) 603.
- (31) E. Korobkina, R. Golub, B. Wehring and A. Young. Phys. Lett. A 301 (2002) 462.
- (32) P. Schmidt-Wellenburg, K. H. Andersen and O. Zimmer. Nucl. Instr. Meth. Phys. Res. A 611 (2009) 259.
- (33) P. Schmidt-Wellenburg. Production of Ultracold Neutrons in Superfluid Helium Under Pressure. Ph.D. thesis, Technische Universität München (2009). Note that the calculated values for multi-phonon production are erroneous in this thesis. The present paper contains the corrected values.
- (34) M. Hara and H. Okubo. Cryogenics 38 (1998) 1083 .
- (35) P. Harris. Private communication.
- (36) H. Abele, D. Dubbers, H. Häse, et al. Nucl. Instr. Meth. Phys. Res. A 562 (2006) 407.
- (37) V. Wagner, H. Friedrich and P. Wille. Phys. B: Cond. Matt. 180 (1992) 938.
- (38) F. Atchison, B. v. d. Brandt, T. Bryś et al. Phys. Rev. C 71 (2005) 054601.
- (39) T. Keller, K. Habicht, R. Golub and F. Mezei. Europhys. Lett. 67 (2004) 773.
- (40) B. M. Abraham, Y. Eckstein, J. B. Ketterson, et al. Phys. Rev. A 1 (1970) 250.
- (41) H. S. Sommers, J. G. Dash and L. Goldstein. Phys. Rev. 97 (1955) 855.
- (42) E. Farhi. Internal report, ILL (2013).
- (43) K. Lefmann and K. Nielsen. Neutron News 10 (1999) 20.
- (44) P. Willendrup, E. Farhi and K. Lefmann. Physica B 350 (2004) 735.
- (45) J. Bossy, A. Rahli, O. Zimmer and J. Ollivier. Data from experiment TEST-1715 at IN5 (incident wavelength 3 Å) at the ILL (2009).
- (46) J. Bossy, J. Neuhaus, W. Petry et al. Data from experiment 6-01-206 at IN5 (incident wavelength 5 Å) at the ILL (2000).
- (47) M. R. Gibbs, R. T. Azuah, W. G. Stirling et al. Data from experiment 6-01-140 at IN6 (incident wavelength 4.1 Å) at the ILL (1995).
- (48) H. Yoshiki, K. Sakai, M. Ogura et al. Phys. Rev. Lett. 68 (1992) 1323.
- (49) R. J. Donnelly and C. F. Barenghi. J. Phys. Chem. Ref. Data 27 (1998) 1217.