Unambiguous Detection of Reflection in Magnetic Cataclysmic Variables: Joint NuSTAR – XMM-Newton Observations of Three Intermediate Polars
Abstract
In magnetic cataclysmic variables (CVs), X-ray emission regions are located close to the white dwarf surface, which is expected to reflect a significant fraction of intrinsic X-rays above 10 keV, producing a Compton reflection hump. However, up to now, a secure detection of this effect in magnetic CVs has largely proved elusive because of the limited sensitivity of non-imaging X-ray detectors. Here we report our analysis of joint NuSTAR/XMM-Newton observations of three magnetic CVs, V709 Cas, NY Lup, and V1223 Sgr. The improved hard X-ray sensitivity of the imaging NuSTAR data has resulted in the first robust detection of Compton hump in all three objects, with amplitudes of 1 or greater in NY Lup, and likely 1.0 in the other two. We also confirm earlier report of a strong spin modulation above 10 keV in V709 Cas, and report the first detection of small spin amplitudes in the others. We interpret this as due to different height of the X-ray emitting region among these objects. A height of 0.2 white dwarf radii provides a plausible explanation for the low reflection amplitude of V709 Cas. Since emission regions above both poles are visible at certain spin phases, this can also explain the strong hard X-ray spin modulation. A shock height of 0.05 white dwarf radii can explain our results on V1223 Sgr, while the shock height in NY Lup appears negligible.
1 Introduction
In magnetic cataclysmic variables (CVs), a strongly magnetic (1–200 MG) white dwarf primary accretes matter from a Roche-lobe filling secondary. Intermediate polars (IPs) are a subset of magnetic CVs in which the spin period is significantly shorter than the orbital period. When the magnetically controlled accretion flow hits the white dwarf surface, a strong standing shock forms. The predominant cooling mechanism of shock-heated plasma in IPs is the collisionally excited, thermal, multi-temperature X-ray emission (Aizu, 1973). Since the shock is formed near the stellar surface, we expect that roughly half the intrinsic emission is directed towards the primary and is reprocessed and/or reflected. The strongest spectral signatures of reflection are the 10–30 keV Compton reflection hump and the Fe K fluorescent line at 6.4 keV. While the latter are routinely detected from magnetic CVs, they can also originate from intrinsic absorbers. The importance of reflection has nevertheless been inferred through a statistical analysis of the equivalent width of the 6.4 keV line vs. absorbing column (Ezuka & Ishida, 1999).
A direct detection of the Compton reflection hump in magnetic CVs has largely been elusive to date, due to a lack of X-ray spectra of sufficient quality above 10 keV. Positive detections are reported for AM Her (Rothschild et al., 1981; Beardmore et al., 1995; Matt et al., 2000) and for EF Eri (Done et al., 1995). However, the studies on AM Her used single-temperature models as the basis; Done et al. (1995) also started with this model, and although they also explored reflection of the expected multi-temperature emission, the data were not good enough to distinguish between the two. Beardmore et al. (2000) found residuals around the Fe K complex in their study of V1223 Sgr using Ginga data, and interpreted it as due to reflection. However, they were unable to verify this through the detection of the characteristic spectral curvature of reflection on the higher energy side of the 10–30 keV hump.
Previous hard X-ray data on these magnetic CVs generally had poor signal-to-noise ratios and suffered from systematic uncertainties of background models. With the advent of NuSTAR, the first mission to extend the energy range for imaging X-ray observations up to 79 keV, we can obtain much improved hard X-ray spectra. It also enables a reliable study of spin modulation of X-rays above 10 keV. In this Letter, we present the initial results from our joint observations of 3 IPs using NuSTAR (Harrison et al., 2013) and XMM-Newton (Jansen et al., 2001), and report the unambiguous detection of Compton reflection hump in all three targets.
2 Observations and Data Reduction
We have selected V709 Cas, NY Lup, and V1223 Sgr as our targets for this study, because they have the highest observed 14–195 keV Swift/BAT fluxes according to Brunschweiger et al. (2009). We have observed them jointly with NuSTAR and XMM-Newton during the summer of 2014, always with periods of simultaneity; the observations are summarized in Table 1. In this Letter, we present only the NuSTAR and the XMM-Newton EPIC data.
NuSTAR consists of two co-aligned telescopes and the two focal plane modules, FPMA and FPMB. We reduced the NuSTAR data using the NuSTAR Data Analysis Software (NSuTARDAS v1.4.1) available as a part of HEASOFT v6.16 and latest CALDB files. The NuSTAR observations were taken during intervals of normal Solar activity, and we used standard filtering to remove periods of high background during South Atlantic Anomaly (SAA) passages and Earth occultation. For each source, we used a 70″ radius circular region around the known position, and a 100″ radius, circular, source-free background region on the same detector. We generated the spectra, corresponding response files and light curves using nuproducts. We grouped all spectra using grppha to have at least 25 counts per bin, and used the statistic in spectral fitting. We produced background-subtracted, barycenter-corrected light curves in the 3–10 keV and 10–30 keV energy bands for all three IPs.
We processed the XMM-Newton data with SAS version 13.0.0 using the latest calibration files available in November 2014. All observations were performed with the EPIC cameras (PN and two MOS) in small window imaging mode to avoid pile-up, with the thin filter applied (with the exception of V709 Cas, where the medium filter was used). We confirmed that none of the observations was affected by pile-up following the thread procedure111 http://xmm.esac.esa.int/sas/current/documentation/threads/epatplot.shtml. Then, we extracted the source spectrum from a circular region of radius 40″, centered at the known source position. The background was obtained from a nearby source-free region of the same size for PN and 150″ for the MOSs. For the spectral analysis, we cleaned the observation of V709 Cas that was affected by background flares, by applying an intensity threshold, thereby retaining only the first ks. We grouped spectral channels with the specgroup tool so as to have a minimum of 25 and 15 counts per bin for the PN and MOSs, respectively. For the timing analysis, we applied the barycentric correction using barycen and produced background subtracted light curves in the 0.3–3, and 3–10 keV ranges using the task epiclccorr.
3 Results
3.1 Phenomenological Fits
Initially, we concentrated on what we could infer purely from the NuSTAR data. For this, we excluded the Fe K region (5.5–8.0 keV), and the data below 4.5 keV, and approximated the interstellar plus intrinsic absorber using a single phabs model. To fit the continuum, we used 3 different models with different degrees of curvature: a power law, a cooling flow model (mkcflow), and a single-temperature Bremsstrahlung. We then modeled reflection using the convolution model reflect (Magdziarz & Zdziarski, 1995), with the abundances fixed to solar as determined by Anders & Grevesse (1989). We also fixed the inclination angle of the reflecting surface at the default value of cos () (see §3.2). We fitted the data once with the reflection amplitude fixed to 0.0, and once with the amplitude thawed.
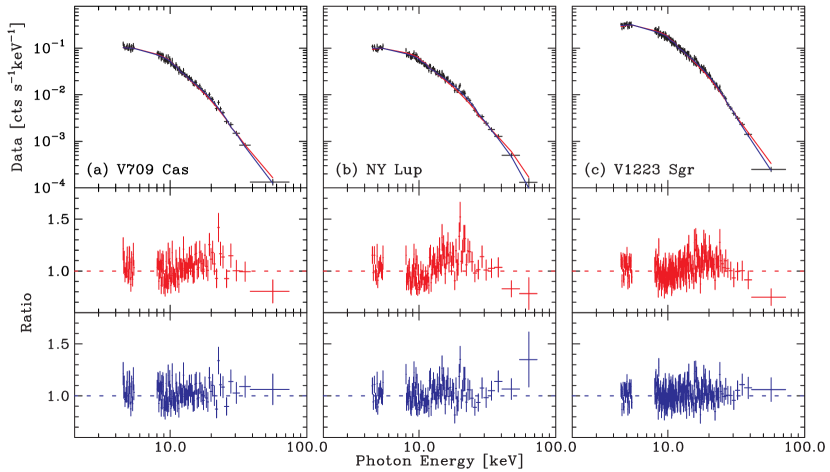
In Table 2, we report the best-fit and the degree-of-freedom of the latter case, the difference in () compared to the no reflection case, and the best fit reflection amplitude with the 90% confidence error range. The choice of continuum model affects the values, with the Bremsstrahlung continuum presents the stringent test of reflection (the smallest ). Nevertheless, reflection is detected with high significance for all 3 models and for all 3 objects (at a significance of 1, for V709 Cas fitted with Bremsstrahlung model, or higher, using the F-test). We also illustrate the improvement visually in (Figure 1) using the single-temperature Bremsstrahlung case. The residuals against the reflection-less model (middle panels) clearly show the continuum reflection hump, peaking around 20 keV. We are not aware of any explanation of the high energy end (30 keV) of the observed hump other than Compton reflection.
We conclude that, with NuSTAR data alone, we have achieved an unambiguous detection of reflection in all three IPs. However, intrinsic absorbers in IPs are complex and often include components with NH a few times 1023 cm-2. Such absorbers affect the observed continuum up to 6 keV and also create an Fe K edge at 7.0 keV (Ezuka & Ishida, 1999). We must determine the depth of the Fe K edge due to these Compton-thin absorbers before we can place quantitative constraints on the reflection amplitude (see §3.2).
We also performed simple phenomenological fits to the XMM-Newton EPIC spectra in the 5–9 keV region, where multiple emission lines are evident. Using a Bremsstrahlung continuum modified by a single phabs absorber, we clearly detected the H-like (7.0 keV), He-like (6.7 keV), and near neutral, fluorescent (6.4 keV) lines in all 3 objects, which is typical for IPs (Hellier & Mukai, 2004). The first two indicate the presence of kT10 keV and 5 keV plasmas, respectively. The equivalent width of the 6.4 keV line was found to be 10511 eV, 13212 eV and 90 18 eV, respectively, for V709 Cas, NY Lup, and V1223 Sgr.
3.2 Fits to Combined Data
Any absorbers capable of producing an Fe K edge will necessarily absorb soft X-rays below 2 keV almost completely. On the other hand, many IPs often exhibit additional spectral complexities below 1 keV, such as the soft, blackbody-like component (see, e.g., Bernardini et al. 2012) and the complex absorber may be ionized (see, e.g., de Martino et al. 2008). In this initial study, we have therefore opted to fit XMM-Newton EPIC (pn, MOS1 and MOS2) spectra in the 1.5–10 keV range simultaneously with the NuSTAR (both modules) spectra in the 3.5–78 keV range. Our preliminary analysis down to 0.3 keV confirms that the choice of low energy threshold does not significantly affect the depth of the Fe K edge in the model.
For these joint fits, we used two different combinations of models.
In the first case (“2T”), we approximated the underlying multi-temperature
thermal emission, evidenced by the presence of H-like and He-like Fe lines,
using two mekal (Mewe et al., 1985; Liedahl et al., 1995) components of different
temperatures. A single absorber is clearly inadequate to describe the data,
so we approximated the complex absorber using one fully covering and one
partial-covering absorbers. We applied the reflect model to the 2
mekal models and added a Gaussian to represent the 6.4 keV line
of cold iron222In xspec notation, this model can be written as
constant*phabs(partcov*phabs)(reflect(mekal+mekal)+gaussian)
where the constant allows for cross-normalization constant, and
the convolution model partcov is used to create a partial-covering
absorber model based on phabs..
In the second case (“mkcflow”), we modeled the underlying multi-temperature plasma emission using the isobaric cooling flow model, mkcflow (Mushotzky & Szymkowiak, 1988; Mukai et al., 2003). Although we expect post-shock plasma to cool to the photospheric temperature of the primary, the data above 1.5 keV have no sensitivity to plasma temperatures well below 1 keV. We therefore used a fixed minimum temperature of 0.0808 keV, the lowest value allowed by the mkcflow model. The intrinsic absorption in IPs is likely to occur in the immediate pre-shock flow, which is poorly approximated by one or several discrete partial-covering absorbers: Done & Magdziarz (1998) pointed this out and provided a complex absorber model with an power-law distribution of covering fraction as a function of NH, pwab. We used pwab with minimum NH set to 1.0 cm-2 (effectively 0.0) as well as a phabs to model the interstellar absorption333This model can be expressed as constant*phabs*pwab(reflect*mkcflow+gaussian) in xspec notation..
In both these models, we allowed the overall abundances of the thermal emission to vary (linked between the two mekal components for the “2T” model), which is necessary to reproduce the strengths of the H-like and He-like Fe lines. Moreover, we assumed that the reflection was from the part of the white dwarf surface that is covered by freshly accreted material, with the same abundances as the X-ray emitting plasma. We initially fixed the angle of reflection at cos =0.45 as before.
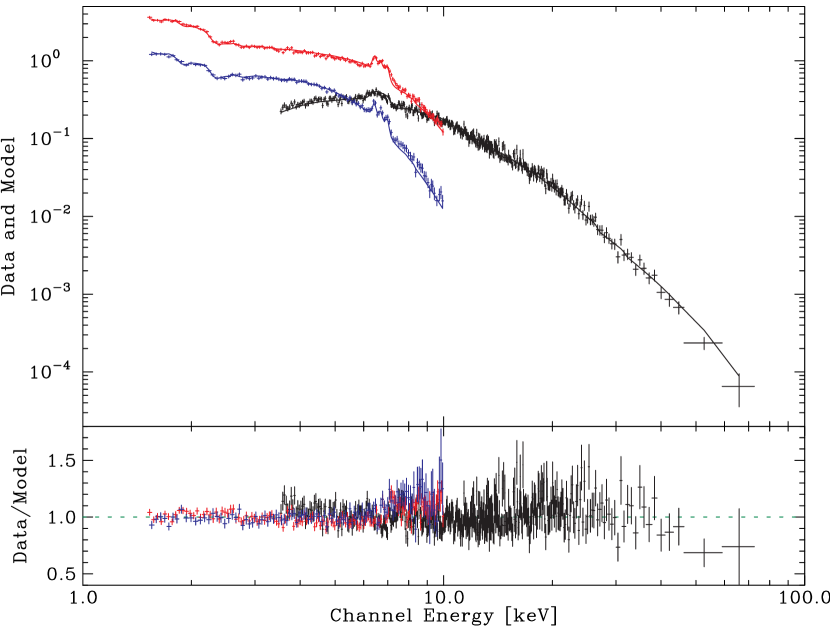
We allowed the cross-normalization factor relative to NuSTAR FPMA to vary, to allow for source variability and for the current limitation in the cross-calibration of these instruments (Burrows et al., 2014; Madesn et al., 2015). The best-fit values were all found to be within a few percent of 1.0. However, we found several specific manifestations of cross-calibration limitations at, e.g., 7–10 keV. This is the likely reason why the joint NuSTAR/XMM-Newton fits results in with , which might otherwise suggest that these fits are unacceptable. We summarize the reflection amplitudes and other selected results in Table 2, and show the results for V1223 Sgr in Figure 2.
The derived reflection amplitudes are lower than in NuSTAR-only fits, because our full fits indicate the presence of a complex intrinsic absorber up to NH a few times 1023 cm-2, which the NuSTAR-only fits did not account for. Correspondingly, these fits result in smaller but still statistically significant values of . We also note that there is good agreement in the reflection amplitude between the two models for V709 Cas and for V1223 Sgr, and that they are significantly less than 1.0: 0.65 (0.45–0.9) for V1223 Sgr and 0.35 (0.1–0.6) for V709 Cas. For NY Lup, the different models disagree but the reflection amplitude appears to be 0.8, possibly as high as 1.8. Alternatively, if we allow for different viewing geometry, we can obtain fits with similar quality with reflection amplitudes 1. For NY Lup fitted with mkcflow, this can be achieved with , resulting in a reflection amplitude of 0.83–1.20. For V709 Cas and V1233 Sgr, the data can be reconciled with reflection amplitudes of 1.0 only with edge-on () geometries. Finally, we note that we do not confirm the previous claim of an ionized Fe K edge at 8.0 keV in V709 Cas (de Martino et al., 2001).
3.3 High Energy Spin Modulation
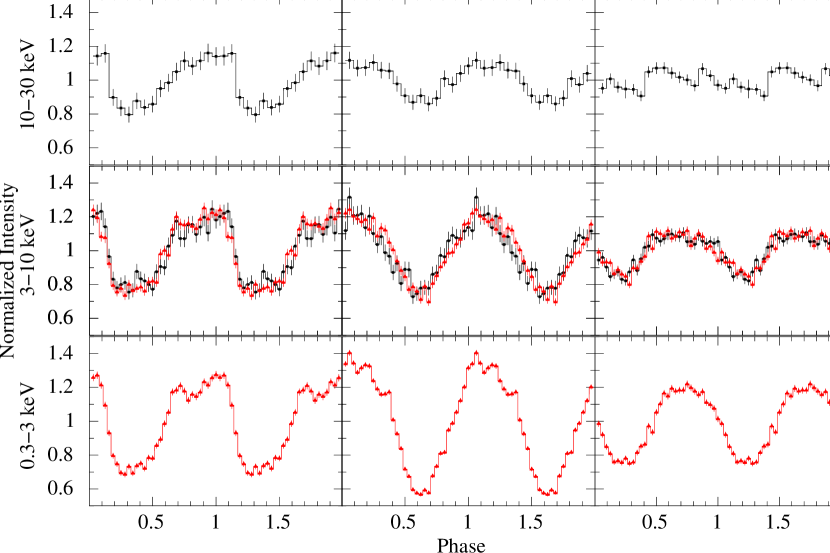
Energy-dependent X-ray spin modulation is a defining characteristic of IPs, and is generally understood as due to variable complex absorber (Norton & Watson, 1989). This mechanism predicts small or negligible spin amplitudes above 10 keV. The only previous claim of spin modulation above 10 keV is for V709 Cas, which shows 10 keV modulation in phase with the lower-energy modulation in the non-imaging RXTE and Beppo-SAX (PDS) data (de Martino et al., 2001). To confirm this earlier results, and to search for subtle spin modulation in the other objects, we folded the XMM-Newton and NuSTAR light curves in three energy bands (Figure 3) on the known spin periods of 312.75 s for V709 Cas (de Martino et al., 2001), 693.01 s for NY Lup (de Martino et al., 2006), and 745.63 s for V1223 Sgr (Osborne et al., 1985), using the integer part of Modified Julian Date of the starting time of each observation as the epoch of phase 0.0.
We found the pulsed fractions of 10–30 keV spin modulation to be 17.01.7%, 11.61.6%, and 4.21.1%, respectively, for V709 Cas, NY Lup, and V1223 Sgr, using the definition in, e.g., Bernardini et al. (2012). Our result for V709 Cas is consistent with that of de Martino et al. (2001). In NY Lup, the 10–30 keV spin modulation is roughly sinusoidal and in phase with the modulation below 10 keV; The 10–30 keV modulation of V1223 Sgr is the weakest and non-sinusoidal (Figure 3).
4 Discussion
The reflection signal is expected to be the strongest normal to the reflecting surface, even before taking projection effect into account (George & Fabian, 1991), with limited energy dependence. Magdziarz & Zdziarski (1995) chose cos as the default for their xspec model as having a spectral shape close to the ensemble average. In our fiducial fits, we used this default and found the reflection amplitude to be 1.0 in V709 Cas and V1223 Sgr, and high (quite possibly 1.0) in NY Lup. However, the primary surface can cover at most 2 steradian of sky. Our data on NY Lup can be reconciled with this if the viewing geometry is more face-on (). This would be the case if the binary inclination () is and the co-latitude of the emission region () is small, which we believe is plausible for NY Lup.
If we force the reflection amplitude to be 1.0 in V709 Cas and V1223 Sgr, the spin-averaged must be . This would require either a nearly aligned rotator seen edge-on or equatorial emission regions seen pole-on. However, our data are also consistent with non-negligible shock height. Unfortunately, given the abundance and NH values we infer, we cannot make a strong inference on the importance of reflection based on the equivalent widths of the 6.4 keV lines (see Figure 7 of Ezuka & Ishida 1999). Therefore, we use the spin modulations to break this degeneracy.
The soft X-rays (10 keV) are modulated predominantly due to photoelectric absorption and are at a minimum when the upper pole (the pole on the hemisphere nearer the Earth) points most directly towards us (Hellier et al., 1987). In contrast, the dependence of reflection should produce a hard X-ray maximum at this phase, resulting in anti-phased spin modulations between the soft and the hard bands. Since this is contrary to what we observe (§3.3), the hard X-ray spin modulations have a different mechanism.
For NY Lup and V1223 Sgr, the observed hard X-ray spin amplitudes are of order 10% or less. The complex absorbers we infer for these objects (Table 2) may produce a spin modulation of such amplitudes via Compton scattering (Figure 6 of Rosen 1992), provided that the angle-dependent reflection effects are small (i.e., the range of must be small).
Finite shock height is another potential mechanism for spin modulation (Mukai, 1999). If the shock height is negligible, as is often assumed in studies of reflection and spin modulations, the horizon is 90∘ from zenith and the primary surface covers 2 steradian, implying a reflection amplitude of 1.0. Moreover, in a pure dipole geometry, one and only one pole is observed at all phases, as the disappearance of one behind the primary rim exactly coincides with the the appearance of the other. Once we relax this assumption, the horizon is 90∘ from zenith, the surface covers steradian, and there is a range of viewing angles where the X-rays from both emission regions are simultaneously observable. This leads to an energy-independent spin modulation, since this effect is purely geometrical.
To explain the hard X-ray spin modulation of V709 Cas, already known to be non-sinusoidal from ROSAT data (Norton et al., 1999), de Martino et al. (2001) proposed that its shock height is 0.2 white dwarf radii (Rwd; see their Figure 9). Such an X-ray source has a horizon angle of 123.5∘, both poles are observable at the viewing angles of 66.5∘–123.5∘, and the reflection amplitude is 0.45. This scenario provides an explanation for our observation that the reflection amplitude is low, the 6.4 keV line is relatively weak, and the spin modulation is even above 10 keV.
The shock in NY Lup appears much closer to the primary surface. As for V1223 Sgr, a characteristic height of 0.05 Rwd would result in a reflection amplitude of 0.7, consistent with the data assuming a non-edge-on viewing geometry, and a horizon angle of 107.7∘. The geometry of V1223 Sgr is poorly known; we believe that there are plausible combinations of and (e.g., and , respectively) such that the lower pole is never visible. We can then explian the observed spin modulation as due primarily t the Compton scattering mechanism.
5 Conclusions
We have unambiguously detected the continuum reflection bump in all three IPs we observed jointly with NuSTAR and XMM-Newton. For two of them, V709 Cas and V1223 Sgr, either we view the reflecting surface edge-on or the reflection amplitude is low. Considering also the high energy spin modulation we detect in V709 Cas, we argue that a post-shock region with a significant height above the white dwarf surface can explain all available data. We plan to continue our analysis using the XMM-Newton RGS and OM data, using EPIC data down to the lowest energy, and performing spin-phase resolved spectroscopy of EPIC and NuSTAR data, to investigate if this framework can provide a quantitative description of the data.
Acknowledgments
This research has made use of data obtained with theNuSTAR mission, a project led by the California Institute of Technology (Caltech), managed by the Jet Propulsion Laboratory (JPL) and funded by NASA. We acknowledge financial support from NASA underXMM-Newton grant NNX15AK63G and from ASI/INAF contract I/037/12/0.
References
- Aizu (1973) Aizu, K. 1973, Prog. Theoret. Phys., 49, 1184
- Anders & Grevesse (1989) Anders, E. & Grevesse, N. 1989, Geochemica et Cosmochimica Acta, 53, 197
- Beardmore et al. (1995) Beardmore, A. P., Done, C., Osborne, J. P. & Ishida, M. 1995, MNRAS, 272, 749
- Beardmore et al. (2000) Beardmore, A. P., Osborne, J. P. & Hellier, C. 2000, MNRAS, 315, 307
- Bernardini et al. (2012) Bernardini, F., Israel, G.L., Dall’Osso, S., Stella, L., Rea, N., Zane, S., Turolla, R., Perna, R., Falanga, M., Campana, S., Götz, D., Mereghetti, S. & Tiengo, A. 2009, A&A, 498, 195
- Bernardini et al. (2012) Bernardini, F., de Martino, D., Falanga, M., Mukai, K., Matt, G., Bonnet-Bidaud, J.-M., Masetti, N. & Mouchet, M. 2012, A&A, 542, A22
- Brunschweiger et al. (2009) Brunschweiger A&A, 496, 121
- Burrows et al. (2014) Burrows, D., Gastaldello, F., Grant, C.E., Guainazzi, M., Madsen, K., Miller, E., Nevalainen, J., Plucinsky, P.P. & Sembay, S. 2014, arXiv:1412.6233
- de Martino et al. (2001) de Martino, D., Matt, G., Mukai, K., Belloni, T., Bonnet-Bidaud, J.-M., Chiappetti, L., Gänsicke, B.T., Haberl, F. & Mouchet, M. 2001, A&A, 377, 499
- de Martino et al. (2006) de Martino, D., Bonnet-Bidaud, J.-M., Mouchet, M., Gänsicke, B.T., Haberl, F. & Motch, C. 2006, A&A, 449, 1151
- de Martino et al. (2008) de Martino, D., Matt, G., Mukai, K., Bonnet-Bidaud, J.-M., Falanga, M., Gänsicke, B.T., Haberl, F., Marsh, T.R., Mouchet, M., Littlefair, S.P. & Dhillon, V. 2008, A&A, 481, 149
- Done et al. (1995) Done, C., Osborne, J. P. & Beardmore, A. P. 1995, MNRAS, 276, 483
- Done & Magdziarz (1998) Done, C. & Magdziarz, P. 1998, MNRAS, 298, 737
- Ezuka & Ishida (1999) Ezuka, H. & Ishida, M. 1999, ApJS, 120, 277
- George & Fabian (1991) George, I.M. & Fabian, A.C. 1991, MNRAS, 249, 352
- Harrison et al. (2013) Harrison, F.A., Craig, W.W., Christensen, F.E., et al. 2013, ApJ, A103
- Hellier et al. (1987) Hellier, C, Mason, K.O., Rosen, S.R. & Córdova, F.A. 1987, MNRAS, 228, 463
- Hellier & Mukai (2004) Hellier, C. & Mukai, K. 2004, MNRAS, 352, 1037
- Jansen et al. (2001) Jansen, F., Lumb, D., Altieri, B., Clavel, J., Ehle, M., Erd, M., Gabriel, C., Guainazzi, M., Gondoin, P., Much, R., Munoz, R., Santos, M., Schartel, N., Texier, D. & Vacanti, G. 2001, A&A, 365, L1.
- Liedahl et al. (1995) Liedahl, D.A., Osterheld, A.L. & Goldstein, W.H. 1995, ApJ, 438, 115
- Madesn et al. (2015) Madsen, K.K., Harrison, F.A., Markwardt, C., An, H., Grefenstete, B.W., Bachetti, M., Miyasaka, H., Kitaguchi, T., Bhalerao, V., Christensen, F.E., Craig, W.W., Fuerst, F., Walton, D.J., Hailey, C.J., Rana, V., Stern, D., Westergaard, N.-J., Zhang, W. 2015, arXiv:1504.01672
- Magdziarz & Zdziarski (1995) Magdziarz, P. & Zdiarski, A.A. 1995, MNRAS, 273, 837
- Matt et al. (2000) Matt, G., de Martino, D., Gänsicke, B.T., Negueruela, I., Silvotti, R., Bonnet-Bidaud, J.-M., Mouchet, M. & Mukai, K. 2000, A&A, 358, 177
- Mewe et al. (1985) Mewe, R., Gronenschild, E.H.B.M. & van den Oord, G.H.J. 1985, A&AS, 62, 197
- Mukai (1999) Mukai, K. 1999, ASP Conf. Ser. 157, 33
- Mukai et al. (2003) Mukai, K., Kinkhabwala, A., Peterson, J. R., Kahn, S. M. & Paerels, F. 2003, ApJ, 586, L77
- Mushotzky & Szymkowiak (1988) Mushotzky, R.F. & Szymkowiak, A.E. 1988, in “Cooling flows in clusters and galaxies; Proceedings of the NATO Advanced Research Workshop, Cambridge, England, June 22-26, 1987,” Kluwer Academic Publishers, Dordrecht, Netherlands, p53
- Norton & Watson (1989) Norton, A.J. & Watson, M.G. 1989, MNRAS, 237, 853
- Norton et al. (1999) Norton, A.J., Beardmore, A.P., Allan, A. & Hellier, C. 1999, A&A, 347, 203
- Osborne et al. (1985) Osborne, J.P., Rosen, S.R., Mason, K.O. & Beuermann, K. 1984, Space Sci. Rev., 40, 143.
- Rosen (1992) Rosen, S.R. 1992, MNRAS, 254, 493
- Rothschild et al. (1981) Rothschild, R. E., Gruber, D. E., Knight, F. K., Matteson, J. L., Nolan, P. L., Swank, J. H., Holt, S. S., Serlemitsos, P. J., Mason, K. O. & Tuohy, I. R. 1981, ApJ, 250, 723
| Object | Obs. Date | NuSTAR | pn | MOS | |||
|---|---|---|---|---|---|---|---|
| Start | Exp. | Start | Exp. | Start | Exp. | ||
| Time | (ks) | Time | (ks) | Time | (ks) | ||
| V709 Cas | 2014-07-07 | 02:01 | 26 | 04:43 | 23 | 04:37 | 31 |
| NY Lup | 2014-08-09 | 14:51 | 23 | 08:19 | 26 | 08:13 | 36 |
| V1223 Sgr | 2014-09-16 | 02:26 | 20 | 02:17 | 12 | 02:11 | 16 |
| Object | Data | ModelaaSee text for full descriptions of the models. | /DOF | bbDifference in between fits with reflection amplitude let free to fit and fixed to 0.0 | Amplitude | NHccThe column density for the partial covering absorber and the partial covering fraction (“2T”), or the maximum column and the power-law index for of the pwab absorber (“mkcflow”). | PCF/ccThe column density for the partial covering absorber and the partial covering fraction (“2T”), or the maximum column and the power-law index for of the pwab absorber (“mkcflow”). | kTddTemperature of the high temperature component (“2T”) or the highest temperature (“mkcflow”) in the best-fit model, with the best-fit value with reflection amplitude set to 0.0 in parentheses. | AbundeeOverall abundance of accreting plasma, assumed to be responsible for both emission and reflection. |
|---|---|---|---|---|---|---|---|---|---|
| 1023 cm-2 | keV | ||||||||
| V709 Cas | NuSTAR | PL | 1.16/557 | 78.9 | 2.16 (1.57–2.91) | ||||
| mkcflow | 1.02/557 | 81.7 | 1.71 (1.27–2.24) | ||||||
| Brems | 1.05/557 | 41.7 | 0.80 (0.56–1.07) | ||||||
| Joint | 2T | 1.29/1094 | 8.7 | 0.27 (0.11–0.44) | 1.5 | 31% | 27.0 (28.6) | 0.34 | |
| mkcflow | 1.30/1096 | 12.4 | 0.38 (0.21–0.60) | 4.7 | 0.84 | 46.6 (48.2) | 0.28 | ||
| NY Lup | NuSTAR | PL | 1.02/401 | 219.4 | 3.95 (3.07–5.12) | ||||
| mkcflow | 0.97/401 | 279.4 | 2.68 (2.13–3.26) | ||||||
| Brems | 1.00/401 | 146.0 | 1.47 (1.23–1.75) | ||||||
| Joint | 2T | 1.20/937 | 99.1 | 1.02 (0.79–1.15) | 1.6 | 49% | 38.9 (56.6) | 0.76 | |
| mkcflow | 1.30/939 | 40.0 | 1.62 (1.53–1.83) | 4.7 | 0.78 | 54.3 (37.6) | 0.68 | ||
| V1223 Sgr | NuSTAR | PL | 1.30/599 | 233.5 | 2.81 (2.30–3.41) | ||||
| mkcflow | 0.95/599 | 222.5 | 2.00 (1.67–2.39) | ||||||
| Brems | 0.97/599 | 119.5 | 1.13 (0.91–1.38) | ||||||
| Joint | 2T | 1.37/1141 | 71.1 | 0.62 (0.46–0.78) | 1.4 | 48% | 22.2 (23.5) | 0.33 | |
| mkcflow | 1.37/1143 | 43.6 | 0.66 (0.46–0.79) | 4.5 | 0.69 | 34.3 (34.2) | 0.26 |