Crystal and electronic structure of BiTeI, AuTeI, and PdTeI compounds: A dispersion-corrected density-functional study
Abstract
Published version available at http://dx.doi.org/10.1103/PhysRevB.91.245204
Semilocal and dispersion-corrected density-functional calculations have been performed to study the crystal structure, equation of state, and electronic structure of metal tellurohalides with chemical formula MeTeI where Me=Bi, Au, or Pd. A comparative investigation of the results of these calculations is conducted, which reveals the role of van der Waals attraction. It is shown that the prediction of crystal structure of metal tellurohalides is systematically improved thanks to the inclusion of van der Waals dispersion. It is found for BiTeI and AuTeI that the energy versus volume curve is anomalously flat in the vicinity of equilibrium volume and the calculated equation of state has an excessively steep slope in the low-pressure region, which are also fixed in the dispersion-corrected calculations. Analysis based on the computation of the volume and axial compressibilities shows that predicting the anisotropy of BiTeI via the semilocal calculations yields an unrealistic result whereas the results of dispersion-corrected calculations agree with the experimental compressibility data. Our calculations render that BiTeI (AuTeI) is a narrow band gap semiconductor with Rashba-type spin-splitting at the band edges (with an indirect band gap) while PdTeI is a metal with relatively low density of states at the Fermi level. The band gaps of BiTeI and AuTeI obtained via semilocal (dispersion-corrected) calculations are found to be greater (smaller) than the respective experimental values, which is against (in line with) the expected trend. Similarly, the Rashba parameters of BiTeI are bracketed by the respective values obtained via semilocal and dispersion-corrected calculations, e.g., a larger value for the Rashba parameter is obtained in association with the reduction of the band gap caused by modification of the crystal structure owing to van der Waals attraction. Excellent agreement with the experimental Rashba parameters is obtained via interpolation of the calculated (semilocal and dispersion-corrected) values.
pacs:
71.20.Ps,71.70.Ej,64.30.Jk,31.70.-fI Introduction
Bismuth tellurohalide (BiTeI) has recently been attracting a great deal of interest as a potential spintronic material due to emergence of giant Rashba-type spin-splittings in its band structureIshizaka et al. (2011) and of a pressure-induced topological insulating phase,Bahramy et al. (2012); Xi et al. (2013) albeit it has also been pointed outTran et al. (2014) that the latter would probably be hindered by a structural phase transition. Prompted by the discoveryIshizaka et al. (2011) of Rashba splittings in the band structure of BiTeI, density-functional calculations have increasingly been employedBahramy et al. (2011); Eremeev et al. (2012); Kulbachinskii et al. (2012); Sklyadneva et al. (2012); Fu (2013); Rusinov et al. (2013); Zhu et al. (2013); Kanou and Sasagawa (2013); Wang et al. (2013); Chen et al. (2013) to explore the electronic and crystal structure of this semiconductor. Curiously, although BiTeI is often described to have a layered structure where the triple Bi-Te-I layers are stacked along an axis perpendicular to the layers, the van der Waals attractions were not explicitly included in these studies. The lattice parameters of BiTeI were therefore needed to be fixed to their experimental valuesShevelkov et al. (1995) in most density-functional calculations. In order to provide a more complete description, we adopt here the dispersion-corrected density-functional (DFT-D2) approach,Grimme (2006) where the van der Waals forces are incorporated by means of a semiempirical force field. We employ the DFT-D2 calculations for not only BiTeI but also AuTeI and PdTeI as far as we are aware of few experimental studiesRabenau et al. (1970); Fenner and Mootz (1978); Seo et al. (1998) on the structure and properties of the latter, which have not been explored via first-principles methods before.
In order to reveal the effect of the dispersion correction on the crystal and electronic structure of MeTeI (Me=Bi, Au, or Pd) compounds, we carried out our calculations at two levels of approximations: the density-functional calculations performed within the generalized gradient approximation (GGA) using the functional of Perdew, Burke, and Ernzerhof (PBE)Perdew et al. (1996) without and with the semiempirical dispersion correction. Hence, we compare the results of the PBE (semilocal) and PBE-D2 (dispersion-corrected) calculations to each other and to the experimental data. The total energy calculations performed for compressed and dilated systems are used to derive equation of state for metal tellurohalides under consideration. Our results show that inclusion of van der Waals interactions is necessary for an adequate physical description of these compounds. In particular, predicting the anisotropy of BiTeI via the PBE calculations yields an unrealistic result whereas the results of the PBE-D2 calculations agree with the experimental compressibility data.
| Element | Reference | ||
|---|---|---|---|
| Pd | 24.67 | 1.639 | Grimme,2006 |
| Te | 31.74 | 1.892 | Grimme,2006 |
| I | 31.50 | 1.892 | Grimme,2006 |
| Au | 40.62 | 1.772 | Amft et al.,2011 |
| Bi | 63.55 | 1.900 | Clay et al.,2012 |
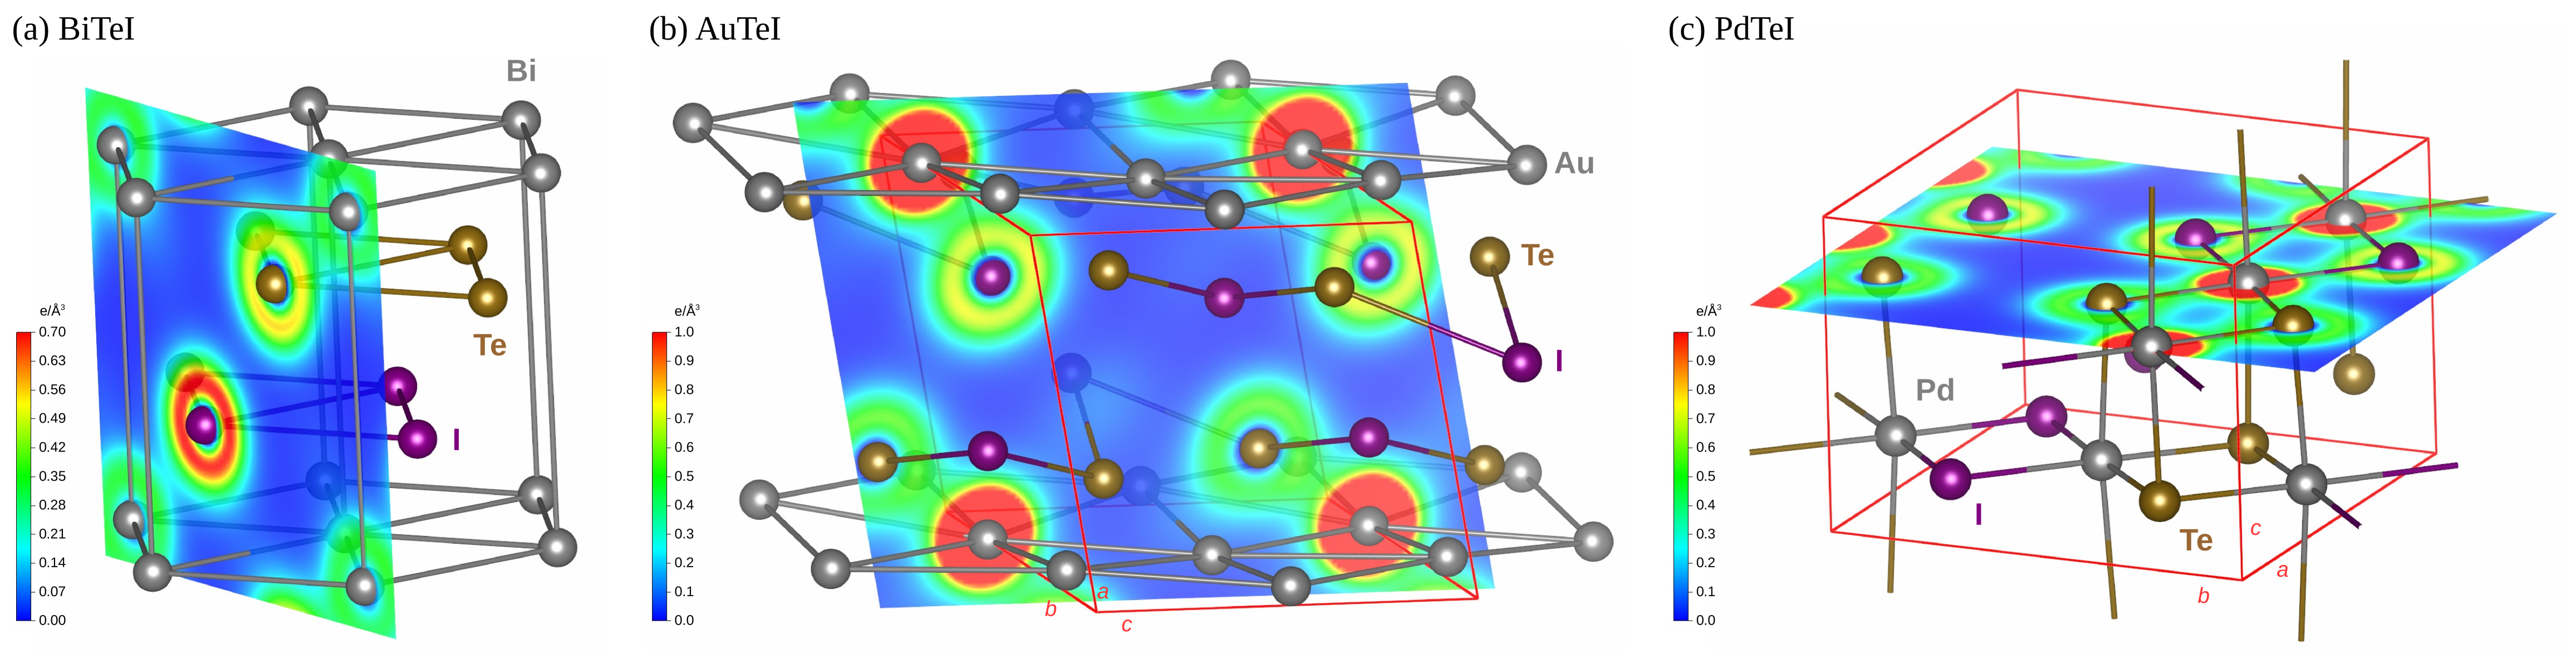
Although oxidation state of Bi, Au, and Pd atoms is the same () in the BiTeI, AuTeI, and PdTeI compounds, the crystal structures of the latter are quite different as shown in Figs. 1(a)-(c). BiTeI, AuTeI, and PdTeI crystallize in trigonal, monoclinic, and tetragonal structures with space groups (No. 156), (No. 14), and (No. 131), respectively. The crystal structure of BiTeI could be characterized by the hexagonal lattice parameters and , and two internal parameters since Bi, Te, and I atoms occupy the , , and positions with fractional coordinates (0,0,0), (2/3,1/3,), and (1/3,2/3,), respectively, cf. Ref. Shevelkov et al., 1995. As shown in Figure 1(a), adjacent trigonal layers formed by Bi, Te, and I atoms stack along the -axis of the hexagonal lattice in BiTeI. The crystal structure of AuTeI could be characterized by the monoclinic lattice parameters , , , and , and nine internal parameters since Au, Te, and I atoms occupy the positions with fractional coordinates (,,), (,,), (,,), respectively, cf. Ref. Fenner and Mootz, 1978. As shown in Fig. 1(b), the atoms form corrugated layers parallel to the -plane, which stack along the -axis in AuTeI. The crystal structure of PdTeI could be characterized by the tetragonal lattice parameters and , and three internal parameters since Pd, Te, and I atoms occupy the , , and positions with fractional coordinates (0,,0), (,0,0), and (,1/2,0), respectively, cf. Ref. Seo et al., 1998. As shown in Fig. 1(c), ladder chains made of TePdI units running along the - and -axes stack along the -axis in PdTeI. Note that the Te and I atoms are mixed in the layers or ladder chains of AuTeI or PdTeI, respectively, whereas the layers of BiTeI are unary, consisting of Bi, Te or I atoms. Accordingly, the space group of the BiTeI crystal is noncentrosymmetric while the crystal structures of AuTeI and PdTeI are centrosymmetric. This puts BiTeI in a unique position in terms of spintronic material properties,Ishizaka et al. (2011) which lacks inversion symmetry in the crystal structure.
The rest of the paper is organized as follows: Sec. II is devoted to the method of calculation, giving also a summary of the computational details. We focus on the crystal structure, equation of state, and electronic band structure in Sec. III where we discuss the results of our semilocal (PBE) or dispersion-corrected (PBE-D2) density-functional calculations. A summary of our findings is given in Sec. IV. Lastly, the spin-orbit coupling (SOC) effects on the BiTeI band structure are described in further details in the Appendix A.
II Method
All calculated properties reported here were obtained via semilocalPerdew et al. (1996) (PBE) or dispersion-correctedGrimme (2006) (PBE-D2) density-functional calculations performed by employing the projector augmented-wave (PAW) method,P. E. Blöchl (1994) as implementedKresse and Joubert (1999) in the Vienna ab initio simulation packageG. Kresse and J. Furthmüller (1996) (VASP). The calculations for BiTeI and AuTeI were performed in the noncollinear modeHobbs et al. (2000); Marsman and Hafner (2002) of VASP in order to take spin-orbit coupling into account. The 4 and 5, 5 and 5, 5 and 5, 5 and 6, and 6 and 6 states are treated as valence states for palladium, tellurium, iodine, gold, and bismuth, respectively. Plane wave basis sets were used to represent the electronic states, which were determined by imposing a kinetic energy cutoff of 325 eV. The long-range dispersion correctionsGrimme (2006) for periodic systems were treated as described in Ref. Bucko et al., 2010. The values of the dispersion coefficient and van der Waals radius used in this study are given in Table 1. The global scaling factor was set to 0.75, which is the adequate value for the PBE functional.Bucko et al. (2010)
We first carried out full optimization of the crystal structures where concurrent relaxations of the unit cell volume and shape as well as the ionic positions were performed with no symmetry constraints, until the maximum value of residual forces on atoms was reduced to be smaller than 0.01 eV/Å. Convergence criterion for the electronic self-consistency was set up to 10 eV. In these optimizations, we used the primitive unit cells of BiTeI, AuTeI, and PdTeI, whose Brillouin zones were sampled by , , and k-point meshes, respectively, which were generated according to Monkhorst-Pack scheme.Monkhorst and Pack (1976) Using the optimized crystal structures, we then carried out band-structure and (projected) density-of-states calculations. Besides, we performed geometry optimizations for the elemental solids of bismuth, gold, palladium, tellurium, and iodine, and employed the respective equilibrium energies per atom (Me=Bi, Au, Pd), and in the computation of the formation energy . It should be reminded that the form of the electronic Hamiltonian used in dispersion-corrected (PBE-D2) calculations is the same as in the calculations employing the PBE functional alone. In other words, the effect of dispersion correction on the electronic structure is indirectly through modification of the crystal structure since the van der Waals interactions are treated as semiempirical force fields in the DFT-D2 approach.Grimme (2006)
Secondly, we carried out constant-volume optimization of the crystal structures where the unit cell shape and the ionic positions were allowed to relax. Hence, we obtained the energy per formula unit as a function of the volume per formula unit, which was used to derive equation of state (EOS) at zero temperature. We found that the energy-volume curve is not accurately reproduced by a third-order Birch-Murnaghan (BM) fit that is in widespread use, which is further discussed in Section III. Thus, we performed forth- and fifth-order BM fitsAngel (2000); Strachan et al. (1999) as a function of the Eulerian strain that is defined from and the zero-pressure volume , employing
| (1) |
with 4 and 5, respectively. Here s are the fitting coefficients, and denotes the equilibrium energy (per formula unit). Note that . The pressure was computed by using
| (2) |
The isothermal bulk modulus and its pressure derivatives , , and (all evaluated at ) were obtained via
| (3) | |||||
respectively.
The volume compressibility was obtained as the inverse of the bulk modulus, i.e., . The axial (linear) compressibilities , with denoting the lattice constant along one of the crystal axes, were computed by dividing by , where the former [latter] was obtained via cubic spline interpolation of the lattice parameter as a function of the volume [via Eq. (2)]. The reliability of this procedure was tested by checking whether holds or not. The latter equality was satisfied in the cases of BiTeI and PdTeI, but not in the case of AuTeI. As discussed in Section III, the variation of the lattice parameter with the pressure is nonmonotonic in the case of AuTeI, which results in a substantial error in estimating derivatives via spline interpolation. The linear compressibilities of AuTeI are therefore not reported.
III Results and Discussion
III.1 Crystal Structure
The crystal structure optimizations result in the experimentally determined ground-state structures, i.e., a noncentrosymmetric (centrosymmetric) crystal for BiTeI (AuTeI and PdTeI) that are shown in Fig. 1(a)-(c) where color contour plots of computed electronic charge density are also displayed. Inspection of the charge-density plot in Fig. 1(a) reveals that the most electron-rich (electron-poor) regions in BiTeI are around I (Bi) atoms. This reflects the fact that bismuth is less electronegative than both iodine and tellurium.Lide (2008) It is also interesting to note that the electronegativity difference is positive and comparatively small whereas is also positive but comparatively large.ele ; Lide (2008) Accordingly, the electronic charge distribution around BiTe (BiI) bonds in Fig. 1(a) is rather of a covalent (ionic) character, which introduces an asymmetry between BiTe and BiI bonds. On the other hand, we have for both Me=Au and Pd, i.e., the differences and are both relatively small, which are of the opposite sign.ele ; Lide (2008) In agreement with the latter, the electronic charge distribution around not only MeTe bonds and but also MeI bonds in Fig. 1(b)-(c) look more like those of covalent bonds. Thus, the tellurium and iodine atoms prefer to coordinate with the metal atoms almost equally, and therefore tend to mix (as opposed to form unary layers) in the AuTeI and PdTeI compounds, rendering the crystal structures of the latter centrosymmetric.
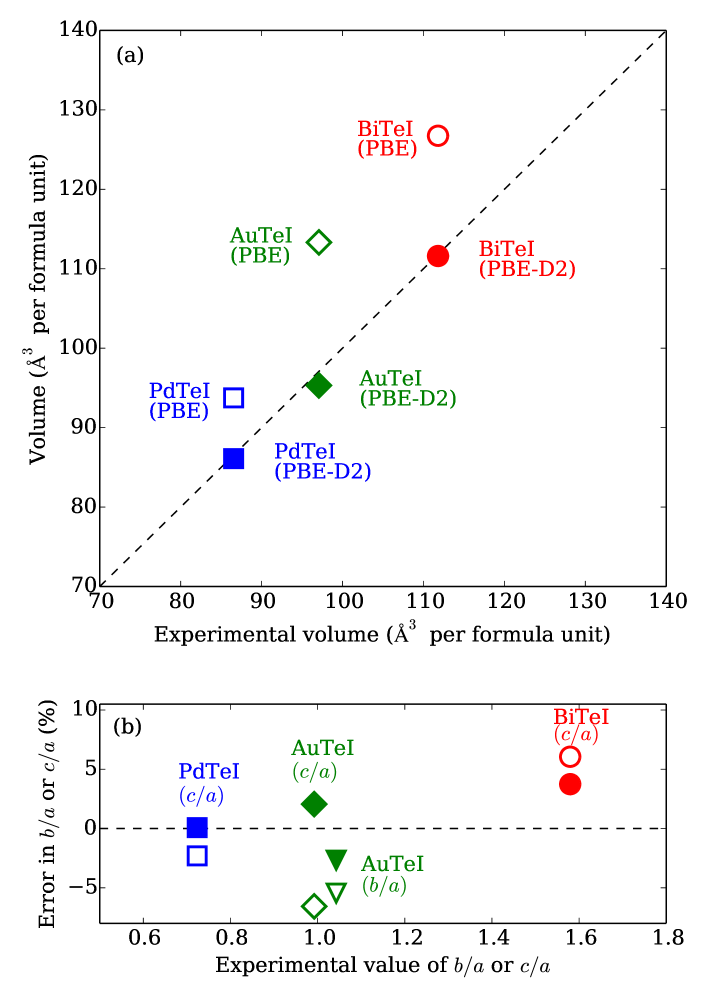
A comparison of the results of the crystal structure optimizations (PBE and PBE-D2) to the experimental data is given in Tables 2 and S1 (Ref. sup, ). It is seen in Table 2 that the improvement due to the dispersion correction is mostly on the lattice parameters (, , ) whereas the PBE and PBE-D2 calculations yield errors of similar magnitude in the prediction of the internal parameters (, , ). It is thus notable that the prediction of unit cell volume and shape is substantially improved: Figure 2(a) displays a plot of the calculated (PBE and PBE-D2) versus experimental values for the equilibrium volume per formula unit. Although it is well known the unit cell volume is overestimated within the GGA, the error in the PBE-optimized volume is clearly greater than expected, which is 13.4, 16.7, and 8.3 % for BiTeI, AuTeI, and PdTeI, respectively. As evident from the trend of the empty symbols in Fig. 2(a) this anomalous overestimation is widespread. Since the lattice parameters (, , ) obtained in the PBE-D2 optimizations are smaller than those in the PBE-D2 optimizations, cf. Table 2, the prediction of equilibrium volume is systematically improved thanks to the dispersion correction, as evident from the trend of the filled symbols in Fig. 2(a). Moreover, a comparison of the empty (PBE) and filled (PBE-D2) symbols of the same shape to each other in Fig. 2(b) shows that the errors in the prediction of and ratios are, at the same time, significantly reduced thanks to the dispersion correction.
| PBE | PBE-D2 | Exptl. | ||
|---|---|---|---|---|
| BiTeI | ||||
| (Å) | 4.4371 | 4.2843 | 4.3392 | |
| (Å) | 7.433 | 7.021 | 6.854 | |
| 0.7692 | 0.7479 | 0.6928 | ||
| 0.2828 | 0.3115 | 0.2510 | ||
| AuTeI | ||||
| (Å) | 8.0057 | 7.2579 | 7.3130 | |
| (Å) | 7.8918 | 7.3654 | 7.6242 | |
| (Å) | 7.4208 | 7.3483 | 7.2550 | |
| 104.81 | 103.95 | 106.26 | ||
| 0.4589 | 0.4746 | 0.4654 | ||
| 0.1333 | 0.1370 | 0.1395 | ||
| 0.2308 | 0.2405 | 0.2370 | ||
| 0.6481 | 0.6868 | 0.6720 | ||
| 0.1433 | 0.1331 | 0.1301 | ||
| 0.9821 | 0.9908 | 0.9910 | ||
| 0.1954 | 0.1626 | 0.1758 | ||
| 0.0659 | 0.1059 | 0.0857 | ||
| 0.3895 | 0.3799 | 0.3892 | ||
| PdTeI | ||||
| (Å) | 8.095 | 7.806 | 7.821 | |
| (Å) | 5.722 | 5.652 | 5.659 | |
| 0.2500 | 0.2495 | 0.2525 | ||
| 0.2086 | 0.2262 | 0.2164 | ||
| 0.2321 | 0.2462 | 0.2435 |
As for the prediction of the internal parameters of the BiTeI crystal, it is interesting to compare our results to the results of Bahramy et al.Bahramy et al. (2011) (Sklyadneva et al.Sklyadneva et al. (2012)) who predicted and ( and ). Note that our PBE-D2 and PBE values for and are in close agreement with those given by Bahramy et al.Bahramy et al. (2011) and Sklyadneva et al.,Sklyadneva et al. (2012) respectively -albeit in both Refs. Bahramy et al., 2011 and Sklyadneva et al., 2012 the PBE functional was employed with no additional terms for the dispersion correction. This is so because the lattice parameters and were fixed to their experimental values (that are close to our PBE-D2 values) in Ref. Bahramy et al., 2011, which was not done in Ref. Sklyadneva et al., 2012.
The predictions of Ref. Bahramy et al., 2011 and Sklyadneva et al., 2012 show that the computed values of the equilibrium BiTe and BiI distances correspond to the BiI and BiTe distances in the experimentally determined structure,Shevelkov et al. (1995) respectively, which is supported by our PBE-D2 values, cf. Table S1 (Ref. sup, ). Note that in Ref. Shevelkov et al., 1995 the bond lengths given in Table 3 are not consistent with the internal parameters given Table 2. It is therefore problematic to perform a direct comparison of experimental and optimized values of the internal lattice parameters and . Thereupon, we considered a second “phase” for BiTeI, which was generated by exchanging the positions of Te and I atoms so that the Te and I atoms occupy the and positions with fractional coordinates (1/3,2/3,), and (2/3,1/3,), respectively. The crystal structure optimization performed for this second phase yielded and , and the total energy the same as that of the BiTeI phase described in Sec. I and Table 2. In line with the latter, comparison performed with the aid of the COMPSTRU programTasci et al. (2012) proved that this second BiTeI phase (Te atoms residing at positions with and I atoms residing at positions with ) is indeed identical to the first one (Te atoms residing at positions with and I atoms residing at positions with ). It is interesting to point out that excellent agreement between experimental data and our computed values ( and ) is obtained once the positions of Te and I atoms are exchanged in the experimentalShevelkov et al. (1995) crystal structure of BiTeI. As long as the x-ray diffraction fails to distinguish the Te and I layers in BiTeI,Bahramy et al. (2011) we anticipate that a full-fledged experimental characterization would render the values of and in agreement with our optimized (PBE-D2) values given in Table 2.
III.2 Equation of State
| (eV) | (Å) | (eV) | (eV) | (eV) | (eV) | |||
|---|---|---|---|---|---|---|---|---|
| BiTeI | ||||||||
| PBE | 5 | -0.958 | 127.039 | 15.357 | 278.613 | 1091.512 | -8932.044 | |
| PBE-D2 | 5 | -0.978 | 111.626 | 88.806 | 228.317 | -4645.020 | 30756.053 | |
| AuTeI | ||||||||
| PBE | 4 | -0.404 | 113.317 | 13.558 | 172.994 | -444.287 | ||
| PBE-D2 | 4 | -0.337 | 95.308 | 58.526 | 244.128 | -1103.027 | ||
| PdTeI | ||||||||
| PBE | 4 | -0.973 | 93.742 | 61.728 | -11.560 | 506.408 | ||
| PBE-D2 | 4 | -0.961 | 86.101 | 90.574 | 103.902 | -695.661 |
| BiTeI | ||||||
|---|---|---|---|---|---|---|
| PBE | 5 | 4.3 | 22.1 | -59.6 | 658.8 | |
| PBE-D2 | 5 | 28.3 | 6.6 | -2.9 | 2.5 | |
| Experimental | 3 | 20.5 | 7.6 | |||
| AuTeI | ||||||
| PBE | 4 | 4.3 | 16.8 | -52.4 | ||
| PBE-D2 | 4 | 21.9 | 8.2 | -2.3 | ||
| PdTeI | ||||||
| PBE | 4 | 23.4 | 3.8 | 0.3 | ||
| PBE-D2 | 4 | 37.5 | 5.1 | -0.4 |
| BiTeI | |||||||
|---|---|---|---|---|---|---|---|
| PBE | 0.232 | 0.010 | 0.212 | 0.043 | 0.914 | 0.047 | |
| PBE-D2 | 0.035 | 0.011 | 0.013 | 0.314 | 0.371 | 0.846 | |
| PdTeI | |||||||
| PBE | 0.043 | 0.017 | 0.008 | 0.395 | 0.186 | 2.125 | |
| PBE-D2 | 0.027 | 0.010 | 0.007 | 0.370 | 0.259 | 1.429 |
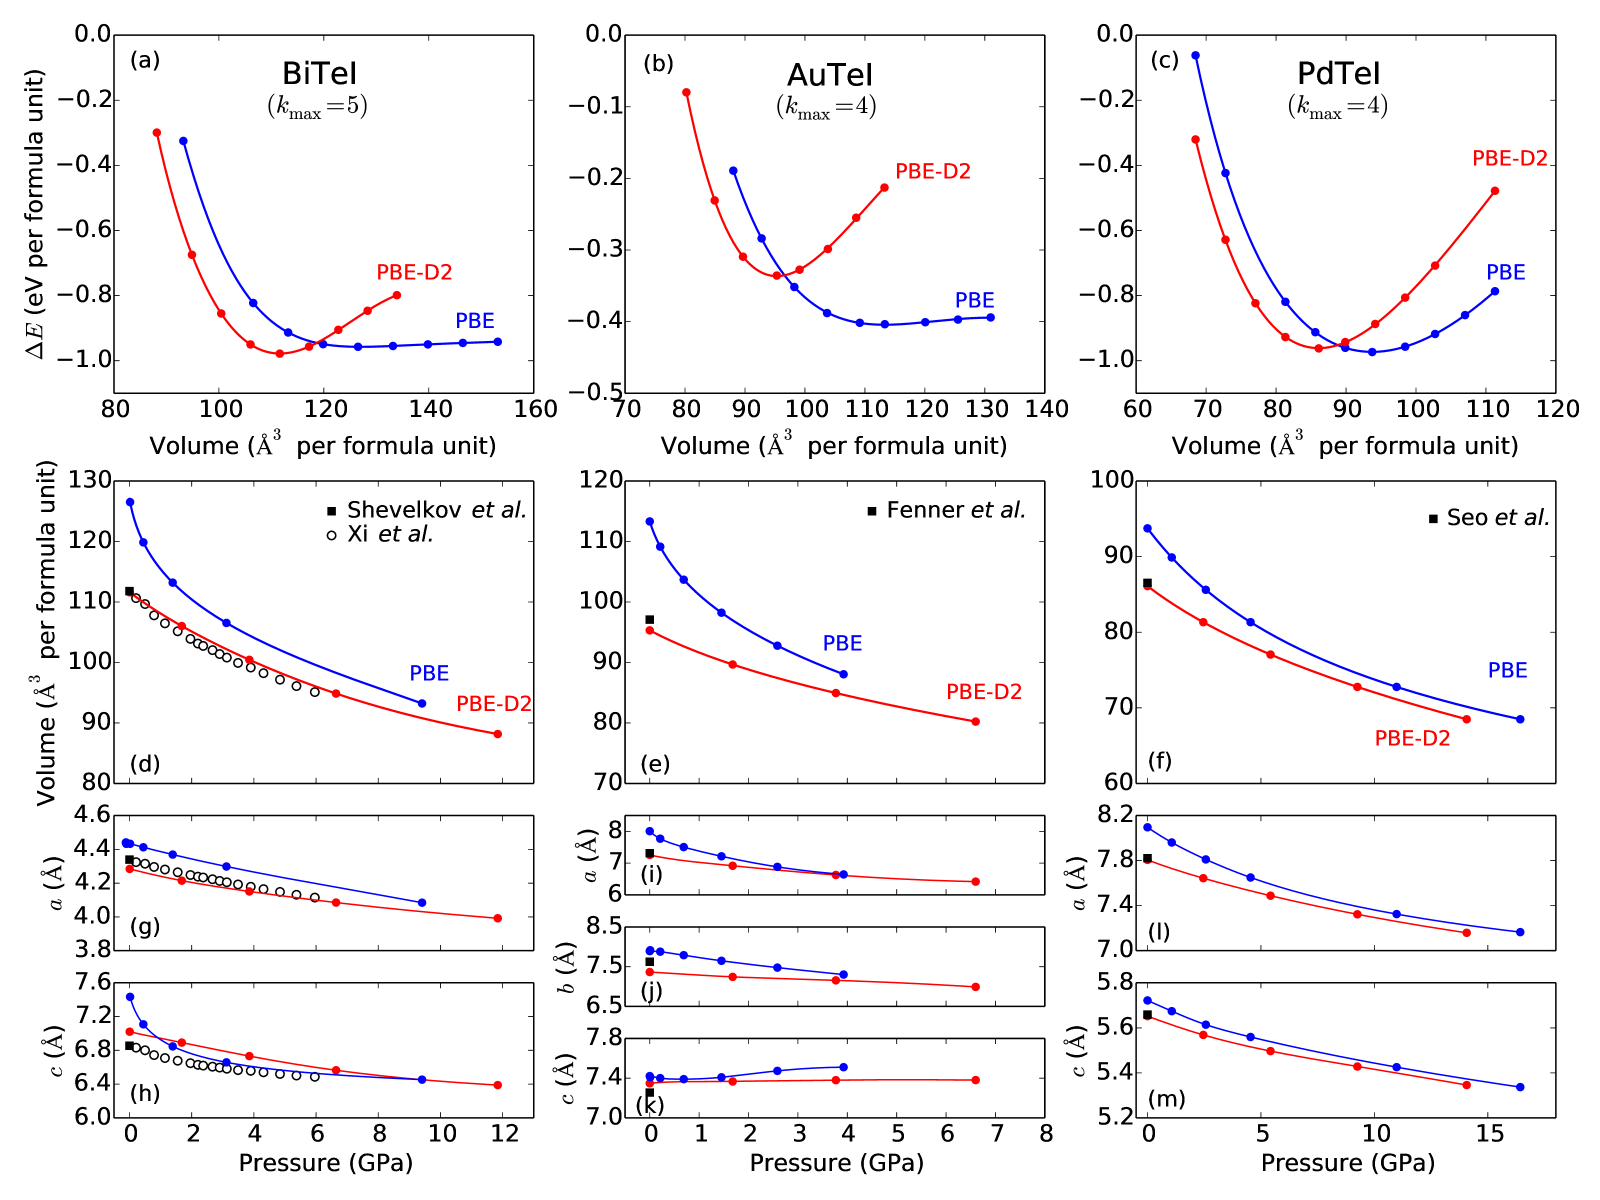
A plot of the energy difference with respect to the volume is given in Figs. 3(a), (b), and (c) for BiTeI, AuTeI, and PdTeI, respectively. The calculated values are represented by the blue (PBE) and red (PBE-D2) circles. The solid-line curves connecting the symbols show the forth- and fifth-order BM fits, whose equation is given by , cf. Eq. (1). Although we first performed the BM fits with , we found it necessary to increase to 4 for AuTeI and PdTeI and to 5 for BiTeI in order to ensure a satisfactory level of accuracy in the fitting procedure, as mentioned in Section II. It is discernible in Fig. S1 (Ref. sup, ) that a good fit is not obtained when is reduced to 4 for BiTeI, and 3 for AuTeI and PdTeI.
The values of parameters obtained via fitting as well as the formation energies are given in Table 3. Note that while is significantly (AuTeI) or slightly (PdTeI) reduced due to addition of the dispersion terms to the PBE functional, both PBE and dispersion-corrected (PBE-D2) calculations yield a similar degree of overbinding for BiTeI since the experimental valueAliev and Babanly (2008) of the enthalpy of formation for BiTeI is eV per formula unit. On the other hand, the interlayer binding energy of BiTeI was computed to be 24 and 332 meV per formula unit in our PBE and PBE-D2 calculations, respectively. Thus, the dispersion-corrected (PBE-D2) calculations yield a substantially stronger interlayer binding for BiTeI, compared to the PBE calculations. It is also notable that the PBE-calculated binding curves of BiTeI [Fig. 3(a)] and AuTeI [Fig. 3(b)] are anomalously flat in the vicinity of equilibrium volume (and especially for volumes larger than ), which is not the case for PdTeI [Fig. 3(c)]. This flatness of the binding curves could be attributed to lacking van der Waals interactions because the dispersion-corrected (PBE-D2) binding curves have a significantly increased curvature.
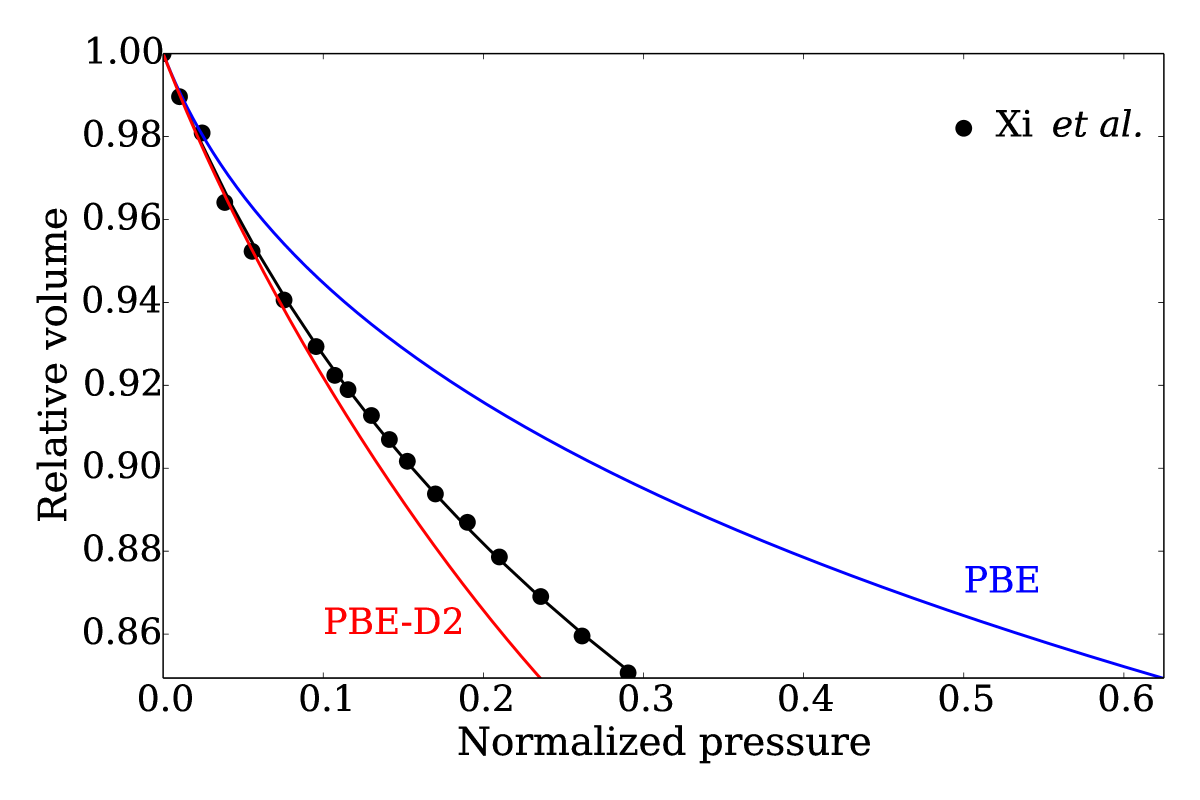
The pressure-volume curves are shown in Figs. 3(d), (e), and (f) for BiTeI, AuTeI, and PdTeI, respectively. The graphs given in Figs. 3(g)-(m) shows the variation of the lattice parameters (, , ) with the pressure. The experimental compressibility dataXi et al. (2013) is also included in Figs. 3(d), (g), and (h) for comparison. The experimental data employed in Fig. 5 of Ref. Chen et al., 2013 is not presented in Fig. 3(d) since is seems to be shifted in comparison to the data of Ref. Xi et al., 2013, cf. Fig. S2 (Ref. sup, ), which also does not agree with the equilibrium volume reported in Ref. Shevelkov et al., 1995. It is noticeable in Fig. 3(d) that the dispersion-corrected curve is in much better agreement with the experimental data (the empty circles) whereas the PBE-calculated curve has a substantially larger slope in the low-pressure region. The latter appears to be the case with AuTeI too, cf. Fig. 3(e). In contrast, the PBE-calculated and dispersion-corrected (PBE-D2) curves for PdTeI have comparable slopes even in the low-pressure region. Note that the steeper decay of curve in the low-pressure region could be traced back to the variation of lattice parameters and for BiTeI and AuTeI, respectively, cf. Figs. 3(h) and (i). Thereupon, the error in the PBE calculations is clearly not restricted to the overestimation of the volume for quasi-layered systems, e.g., Figs. 1(a) and (b). One should, on the other hand, also notice that the agreement between the PBE-D2 and experimental curves in Fig. 3(d) is rather coincidental since the lattice parameter () is overestimated (underestimated) in the PBE-D2 calculations, regardless the value of , cf. Figs. 3(g) and (h). Furthermore, the calculated and experimental values in Fig. 3 refer to zero and room temperature, respectively. Therefore, a comparison of the relative volume () versus normalized pressure () curves is given in Fig. 4 for BiTeI, following a proposal of Ref. Kunc and Syassen, 2010 [where using a simple scaling of variables was demonstrated to be practical in comparing the calculated equation to the experimental equation of state]. It is seen in Fig. 4 that the experimental data points are bracketed by the PBE-calculated and dispersion-corrected (PBE-D2) curves, which are seemingly in better agreement with the PBE-D2 curve than the PBE curve.
Turning back to Fig. 3, it is interesting to point out that the variation of the lattice parameter of AuTeI with the pressure is slightly increasing (nonmonotonic) according to the results of the PBE-D2 (PBE) calculations, as shown in Fig. 3(k). This implies that the lattice of AuTeI would expand along the -axis under compression. In other words, the linear compressibility of AuTeI is negative according to our calculations, cf. Fig. 3(k). It should be remarked that this prediction calls for experimental verification inasmuch as the compressibility of AuTeI has not been investigated before, to our knowledge. Note that the usual behavior under compression is that the individual lattice parameters decrease so that , which is the case in Figs. 3(g)-(j) and (l)-(m). The behavior of negative linear compressibility has nevertheless been observed in a number of systemsGoodwin et al. (2008); Fortes et al. (2011); Li et al. (2012); Cairns et al. (2013) recently.
The bulk modulus and its pressure derivatives , , and computed via Eq. (3) with coefficients listed in Table 3 are given in Table 4 where the experimental values for BiTeI are also included. The latter were obtained by performing a third-order BM fit, cf. the black solid curve in Fig. 4, to the experimental compressibility data.Xi et al. (2013) It is seen that the PBE calculation yields a substantially underestimated (overestimated) value for () of BiTeI. Recalling that (i) the PBE-calculated binding energy curve anomalously flat in the vicinity of equilibrium volume, cf. Fig. 3(a), and (ii) the PBE-calculated equation of state has an excessively steep slope in the low-pressure region, cf. Fig. 3(d), it is no surprise that the bulk modulus is substantially underestimated in the PBE calculations. The PBE-calculated first pressure derivative is consequently greatly overestimated, balancing this underestimation of . On the contrary, the dispersion-corrected (PBE-D2) calculations, albeit in much better agreement with the experimental values, result in overestimation (underestimation) for (). Hence, the experimental values of and are bracketed by the PBE-calculated and dispersion-corrected (PBE-D2) values.
The volume (bulk) and axial (linear) compressibilities and their ratios are given in Table 5 for BiTeI and PdTeI. Note that for these systems. For BiTeI (PdTeI), the PBE and PBE-D2 values for the -axis (-axis) compressibility are close to each other. In contrast, for BiTeI, and for PdTeI. Thus, the -axis compressibility of BiTeI is greatly overestimated in the PBE calculations (which reflects lacking van der Waals binding). We have furthermore (PBE) while (PBE-D2), and and (PBE) while and (PBE-D2) for BiTeI. Note that the ratio should be unity, and both and need to be equal to 1/3 for isotropic materials. For layered materials, on the other hand, one would expect to have the ratio () significantly smaller (larger) than 1/3 and the ratio much smaller than unity (e.g., , , for graphite,Hanfland et al. (1989) a most known layered material). Thus, the PBE calculations predict BiTeI to be an extremely layered material whereas the PBE-D2 calculations indicate a layered, but substantially less anisotropic material. In other words, predicting the anisotropy of BiTeI via the PBE calculations yields an unrealistic result, given that the PBE-D2 calculations are in much better agreement with the experimental compressibility data. It appears that the inclusion of van der Waals attraction, which was motivated by the quasi-layered structure of BiTeI, leads to a much less anisotropic crystal structure. Note that this issue does not raise in the case of PdTeI where van der Waals binding plays a much less prominent role and therefore the PBE and PBE-D2 calculations qualitatively yield similar results, cf. Table 5.
III.3 Electronic Structure
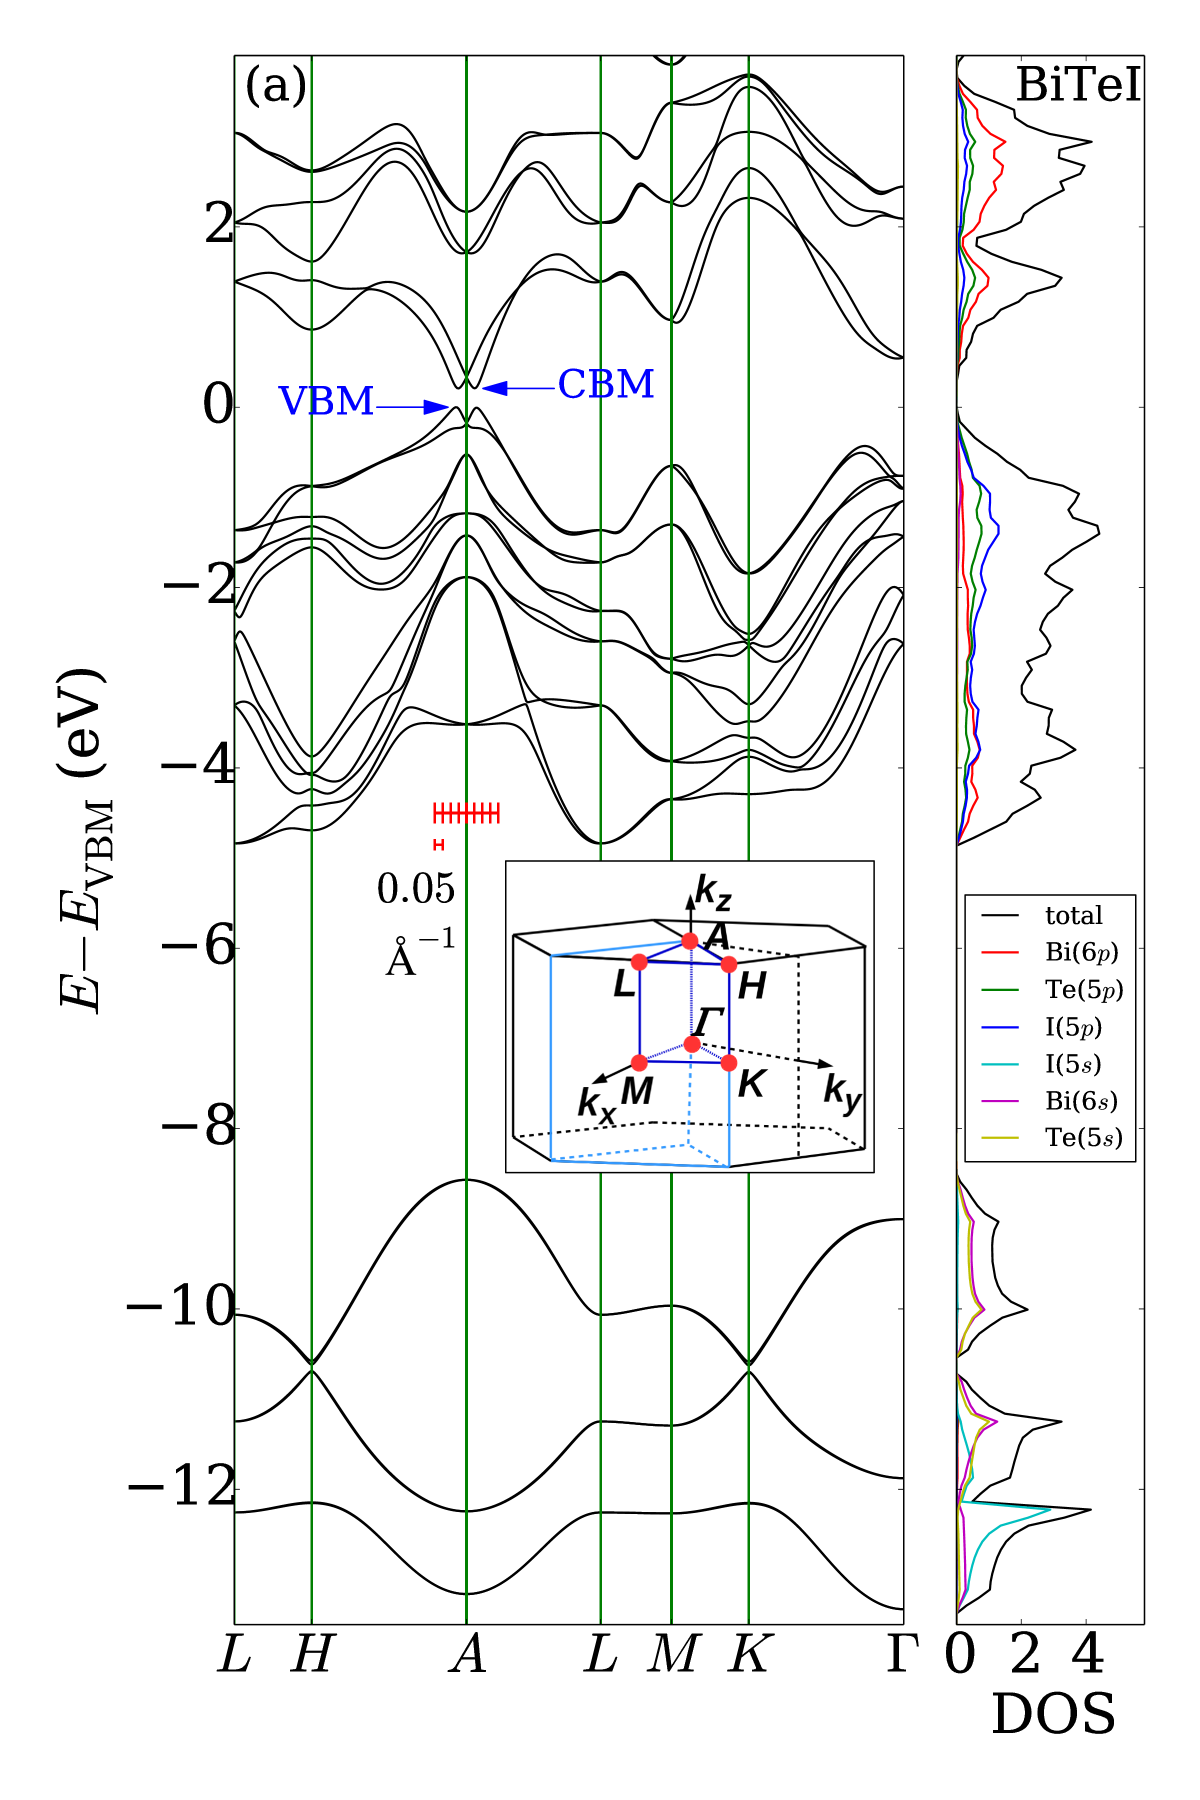
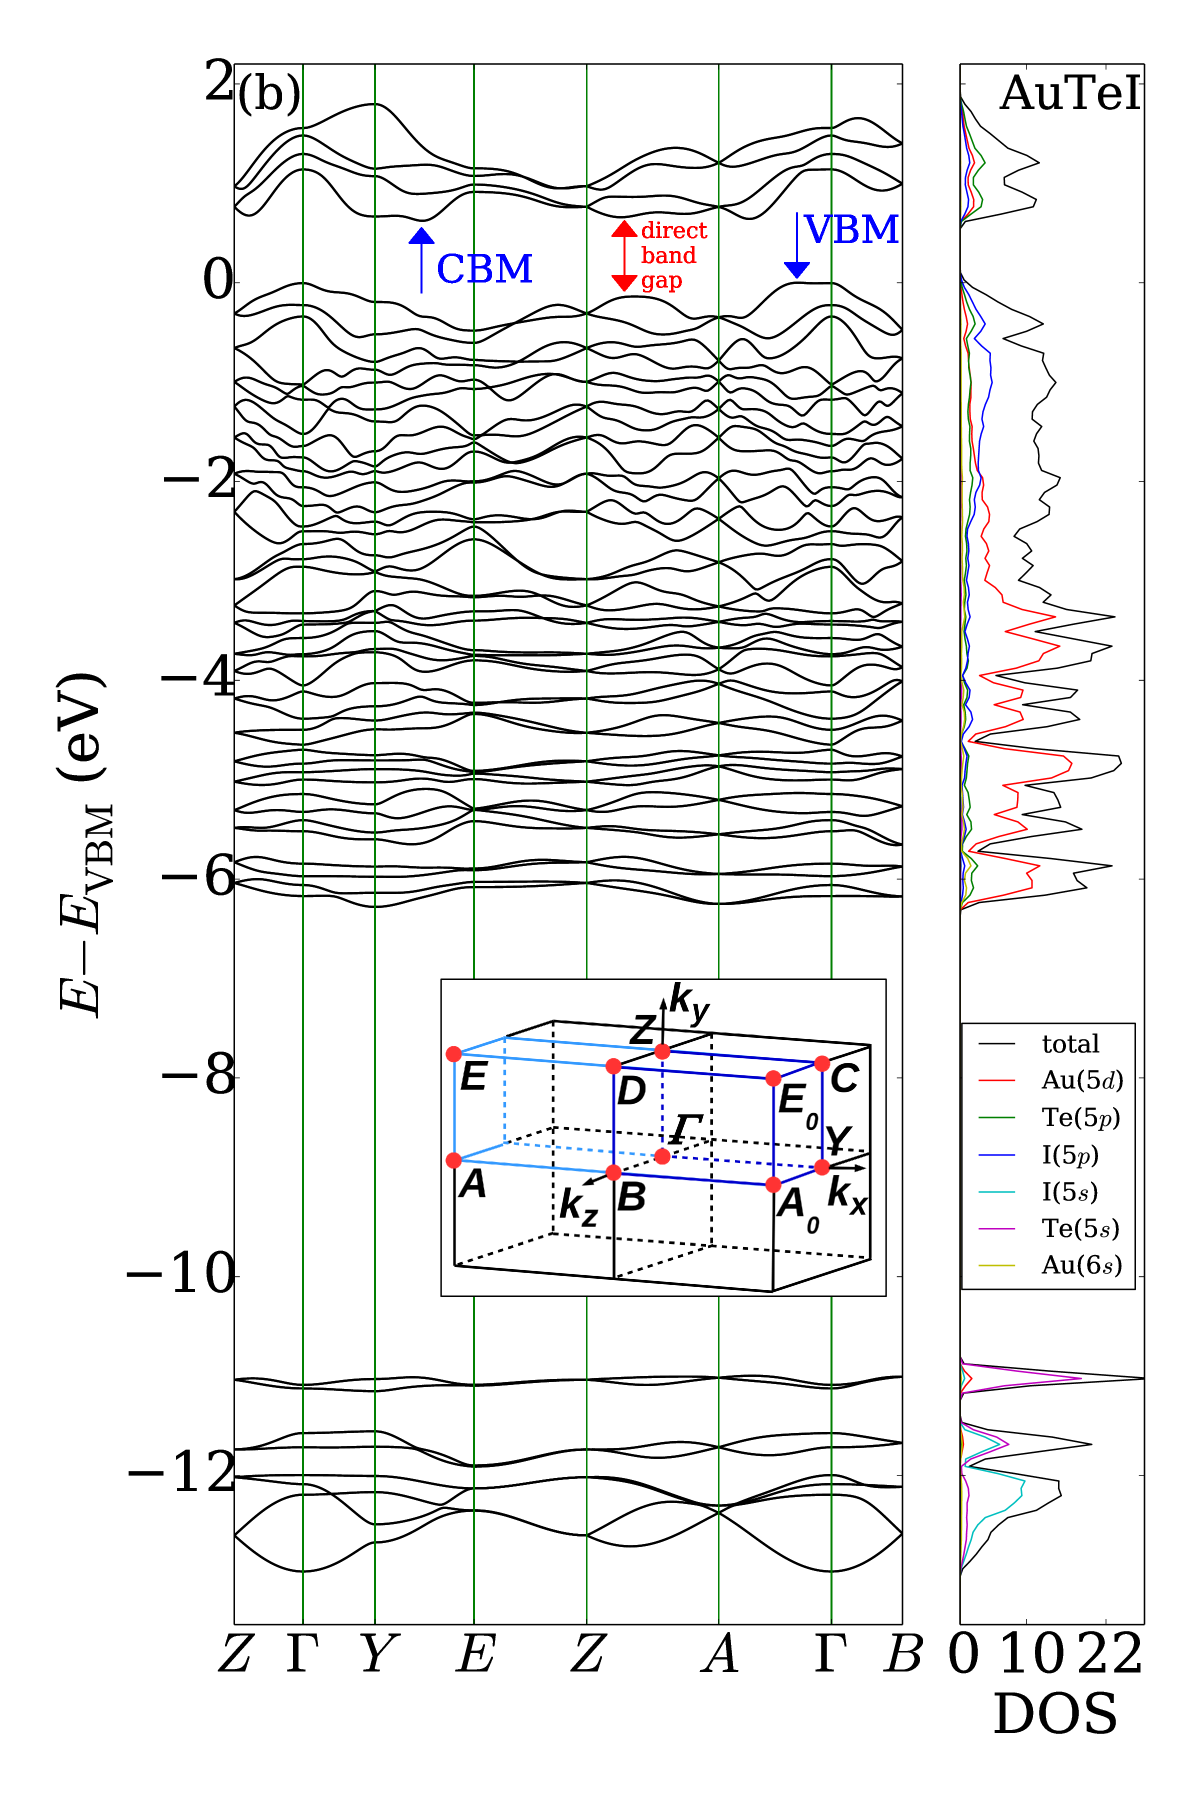
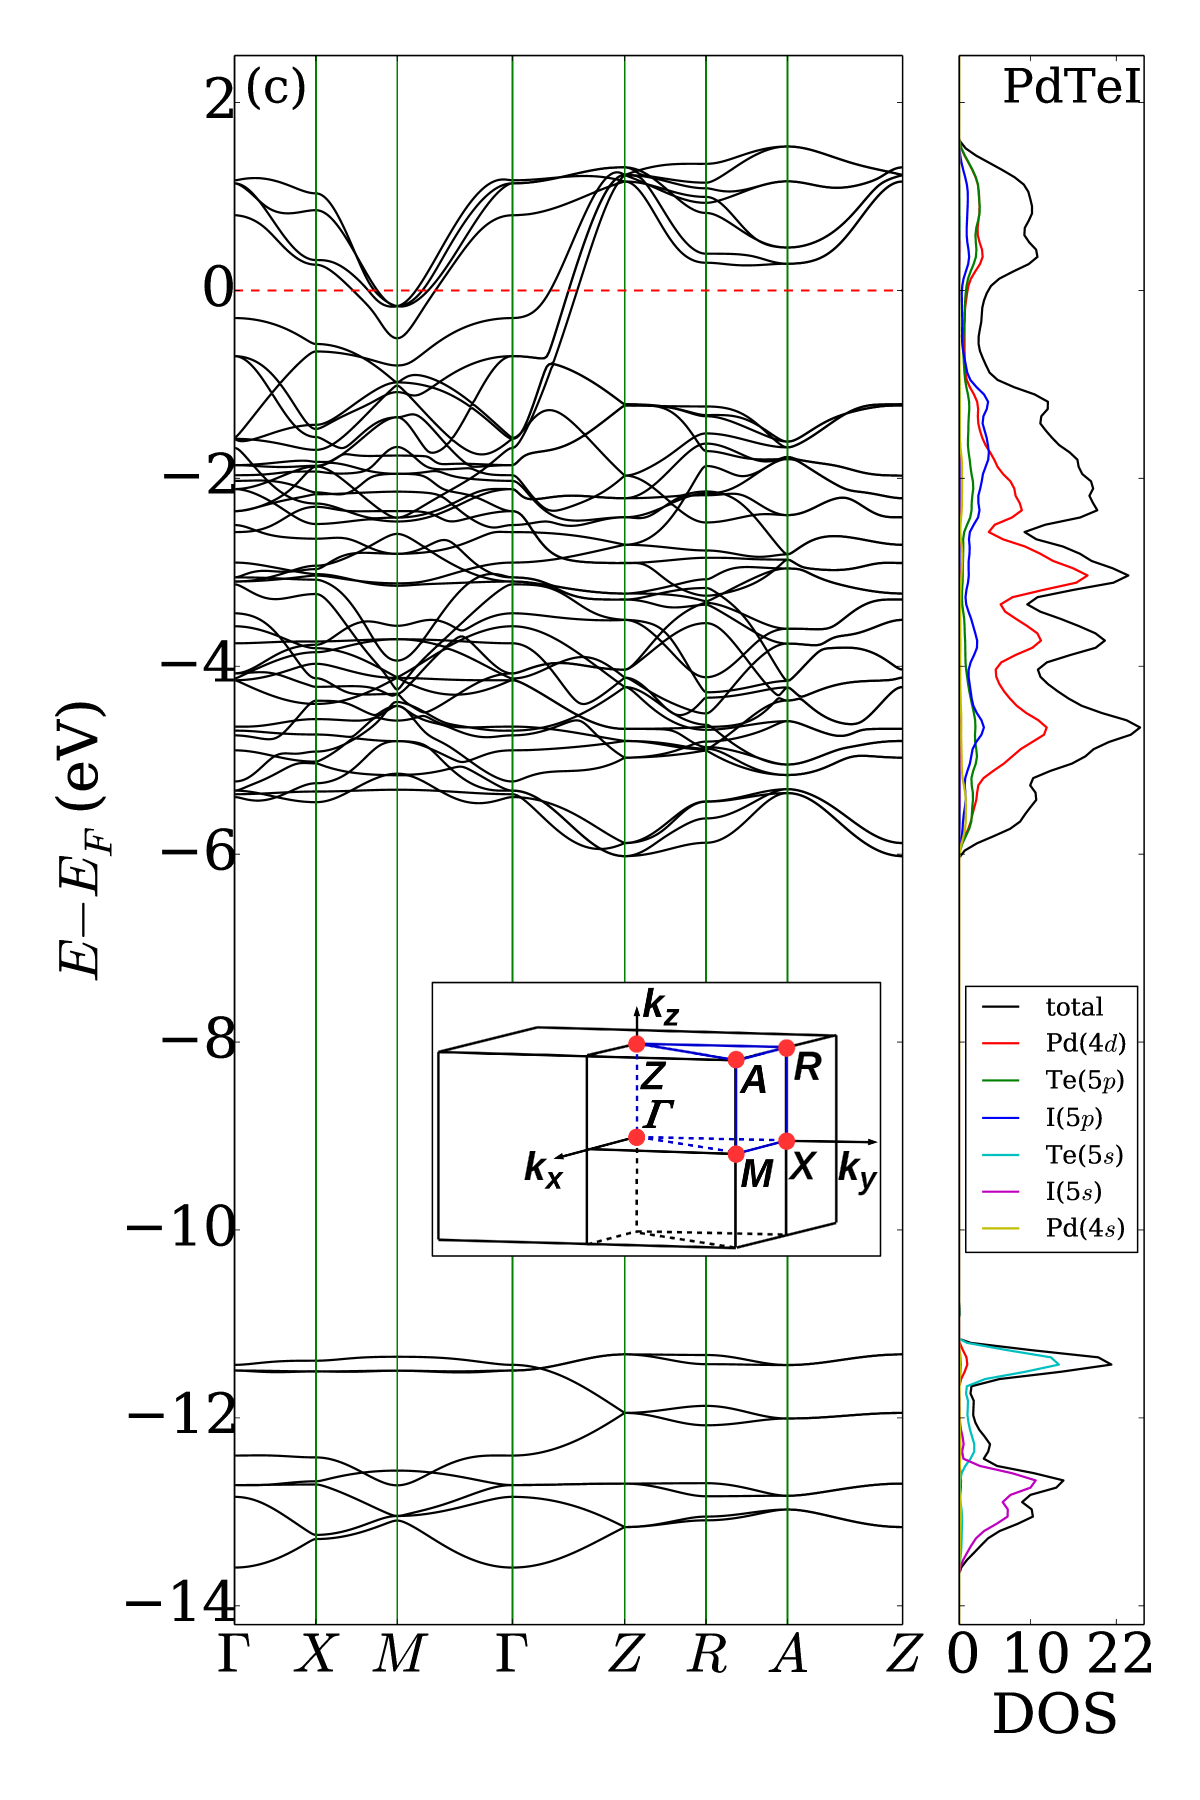
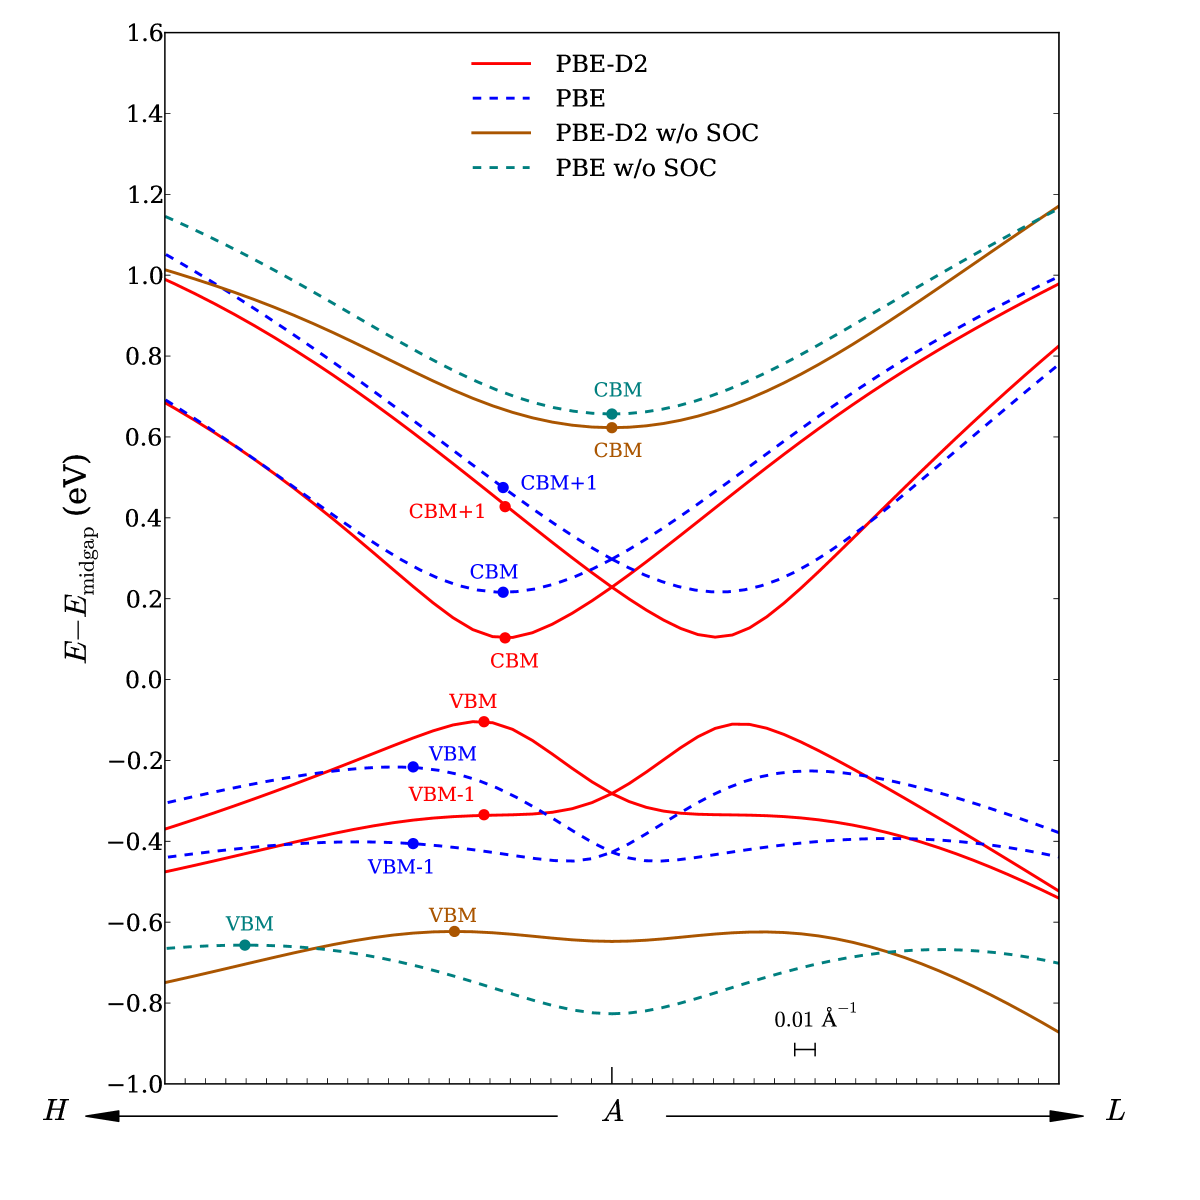
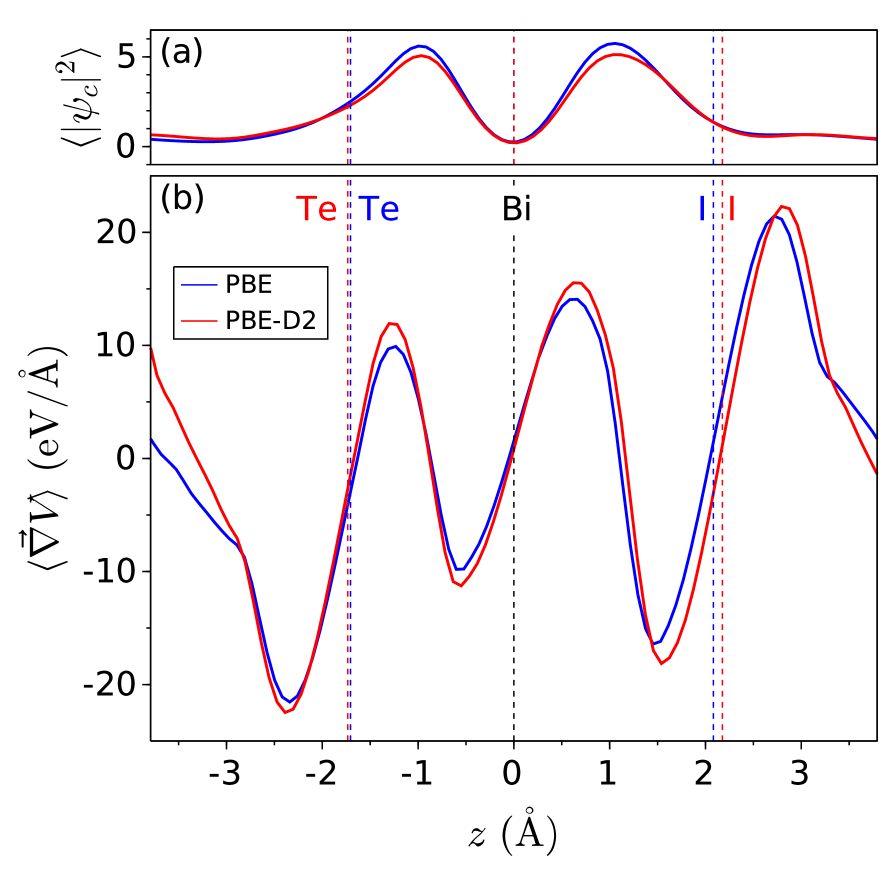
Figure 5(a)-(c) displays the calculated band structure (left panels in each subplot) and projected density of states (right panels in each subplot) of the MeTeI compounds under consideration, obtained by using the optimized (PBE-D2) lattice parameters given in Table 2. BiTeI and AuTeI appear to be narrow band gap semiconductors whereas PdTeI is predicted to be a metal with relatively low density of states at the Fermi level . In Fig. 5(a), Rashba-type splitting near the Brillouin zone point is visible, which is in agreement with the former studies.Ishizaka et al. (2011); Bahramy et al. (2011) This is important because the emergence of the bulk Rashba-type splittings in the calculated band structure depends on the reliable prediction of the BiTeI lattice parameters, cf. Fig. 4 of Ref. Wang et al., 2013. We present a comparison of the BiTeI band structures with and without SOC in the Appendix A, which confirms that splitting near the point in Fig. 5(a) manifests SOC-induced modification of the band edges. It is further shown that the gradient of the crystal potential leads predominantly to an asymmetric electric field along the -axis that facilitates the spin-orbit coupling. As long as the latter gives rise to an effective magnetic fieldOkuda and Kimura (2013) , a simple understanding is that Rashba-type splitting in Fig. 5(a) originates from the interaction of the crystal electrons with that is proportional to , where denotes the momentum operator. It is to be noted that a comprehensive analysis has already been given by Bahramy et al. in Ref. Bahramy et al., 2011, revealing the origin of (giant) Rashba-type splitting in BiTeI.
We see in Fig. 5(a) that the lower valence band consists of the Bi, Te, and I orbitals whereas the upper valence band as well as lower conduction band are derived from the Bi, Te, and I orbitals. Fig. 5(b) shows that the bands of AuTeI are relatively flat (nondispersive), which are derived primarily from Te and I orbitals (lower valence band), and Te and I and Au orbitals (upper valence band as well as lower conduction band). Au states dominate the bottom of the upper valence band. Fig. 5(c) shows that the bands of PdTeI around the Fermi level are quite dispersive along not only perpendicular Z direction but also parallel -M and XM directions. Thus our calculations indicate that opening a band gap owing to a possible -axis-doubling distortionSeo et al. (1998) would probably not render PdTeI a semiconductor. We see in Fig. 5(c) that the deep-lying bands consists mainly of the Te and I orbitals while the bands in the vicinity of the Fermi level are derived from the Te , I and Pd orbitals.
Table 6 gives some characteristic band structure parameters for BiTeI and AuTeI semiconductors, for which experimental data is available: the band gap and the Rashba energy and momentum offset for the conduction band minimum. As for the BiTeI band gap, it is interesting to point out that our PBE-D2 value is close the PBE value (0.242 eV) of Rusinov et al.Rusinov et al. (2013) who employed the experimentalShevelkov et al. (1995) lattice parameters and and PBE-optimizedEremeev et al. (2012) internal parameters and in their calculations. Similarly, our PBE-D2 values for the Rashba energy and momentum offset are in close agreement with the respective PBE values reported in Ref. Rusinov et al., 2013 (where 0.122 eV and 0.050 Å).
It is clear from the entries of Table 6 that the calculations with the PBE functional yield band gaps that are greater than the respective experimental values, which is against the expected trend inasmuch as the band gap is known to be underestimated within the GGA. Contrary to this, the calculated band gaps corresponding to the PBE-D2 optimized crystal structures are smaller than the respective experimental values, in line with the expected trend. Hence, the experimental band gaps are bracketed by the respective PBE and PBE-D2 values, i.e.,
Similarly, the experimental values of and are also bracketed by the respective PBE and PBE-D2 values (cf. Table 6) since
We accordingly anticipate that comparative usage of the PBE and PBE-D2 calculations would be a useful strategy for predicting the band structure of layered polar semiconductors, which eliminates the need to employ the experimental lattice parameters.
As for the Rashba parameter of BiTeI, which represents the strength of Rashba splitting, the PBE-calculated and dispersion-corrected (PBE-D2) values are and 4.82 eVÅ, respectively, bracketing the experimental valueIshizaka et al. (2011) of eVÅ. It is shown in the Appendix A that ending up with a larger Rashba parameter within the dispersion-corrected (PBE-D2) description is due to the enhancement of the asymmetric electric field along the -axis [Fig. A2(b)].
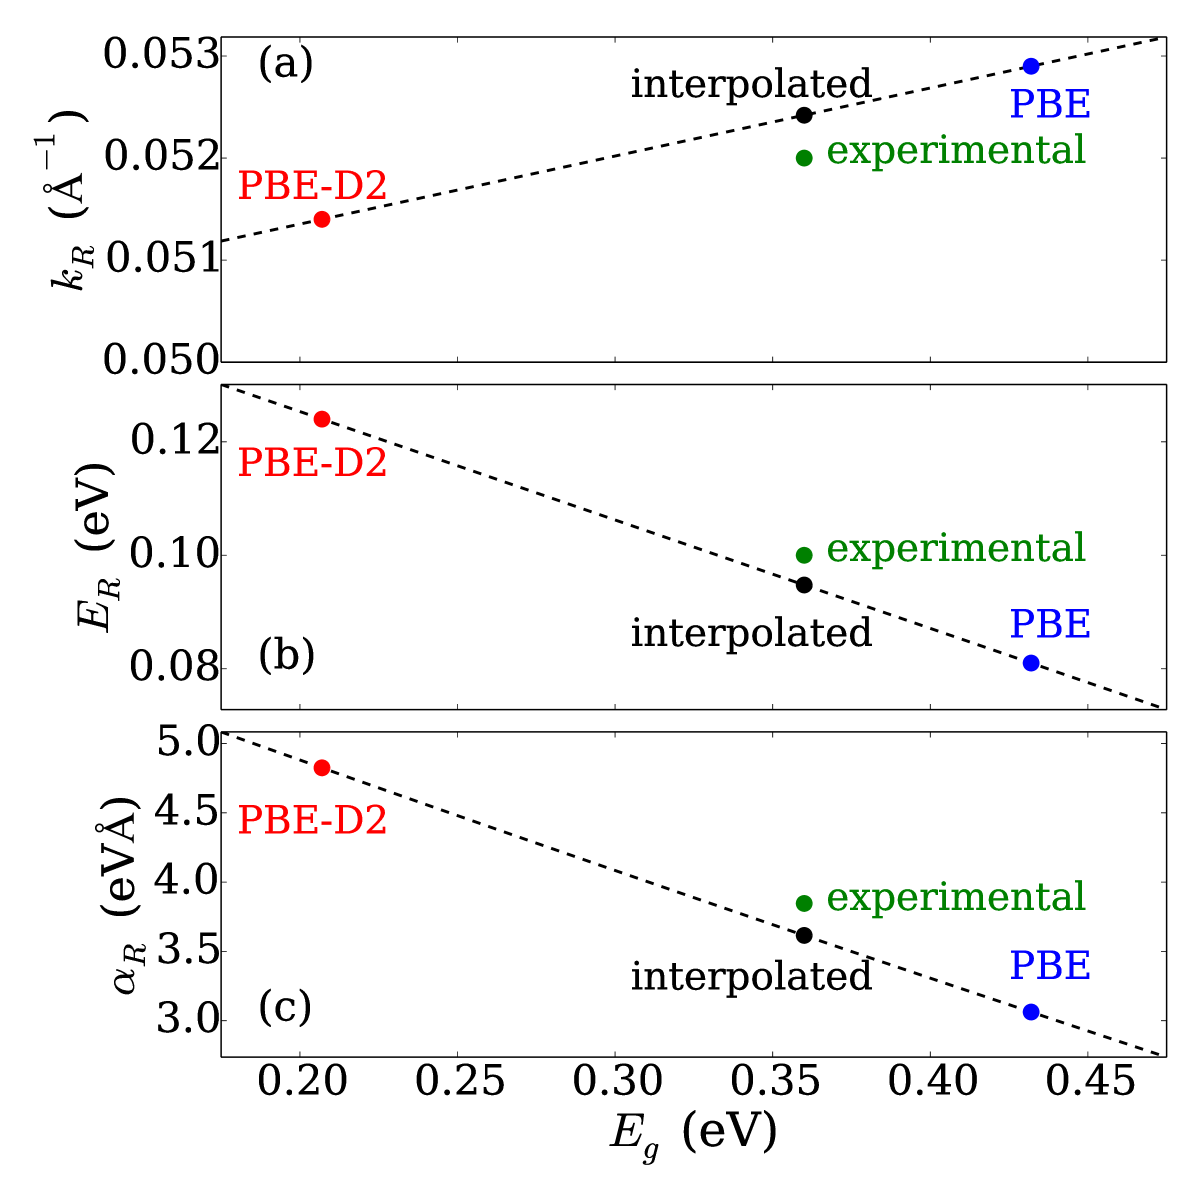
Given that the experimental values of , , and are bracketed by their calculated (PBE and PBE-D2) values, one might attempt to interpolate their PBE-calculated and dispersion-corrected (PBE-D2) values in order to obtain better estimates. The band gap can be used as an interpolation variable for this purpose since the values of and are in almost linear correlation with the band gap values, as shown in Figs. 6(a) and (b), respectively. Note that the error due to the underestimation (PBE-D2) or overestimation (PBE) of could then be corrected by using the experimental value of the band gap (i.e., eV) in the interpolation. The dashed lines in Figs. 6(a) and (b) passes though the calculated points, whose equations are given by
| (4) |
respectively. Combining the latter two equations, could be obtained as a function of , which is shown by the dashed line in Fig. 6(c). Substituting the experimental value of in Eq. (4) yields the interpolated values of 0.0524 Å, 0.095 eV, and eVÅ [which are marked by the black circles in Figs. 6(a), (b) and (c), respectively] in close agreement with the respective experimental valuesIshizaka et al. (2011) [marked by the green circles in Figs. 6(a)-(c)], cf. Table 6.
Finally, forasmuch as the pressure-induced closure of the BiTeI band gap has been explored in a number of recent studies,Bahramy et al. (2012); Chen et al. (2013); Xi et al. (2013); Tran et al. (2014); Ideue et al. (2014); VanGennep et al. (2014) we estimated the critical pressure at which the band gap disappears (the latter being a signature of the topological phase transition). We obtain GPa using our dispersion-corrected (PBE-D2) equation of state, cf. Section III.2, together with a series of band structure calculations (not shown), which confirms the refined value ( GPa) of Bahramy et al. (Refs. Ideue et al., 2014; Bahramy et al., 2012). Our investigation of the variation of the BiTeI band gap and Rashba parameters with pressure will be reported in detail in a separate publication.
IV Conclusion
In summary, our comparative investigation of the results of semilocal (PBE) and dispersion-corrected (PBE-D2) calculations reveals the effect of van der Waals attractions on the crystal and electronic structure of metal tellurohalides BiTeI, AuTeI, and PdTeI. We find that the prediction of crystal structure is systematically improved thanks to the inclusion of van der Waals dispersion. It is shown for the compounds with a quasi-layered crystal structure, viz. BiTeI and AuTeI, that (i) the PBE-calculated energy versus volume curve is anomalously flat in the vicinity of equilibrium volume, and especially for volumes larger than the equilibrium volume, and (ii) the PBE-calculated equation of state has an excessively steep slope in the low-pressure region, which are also fixed in the dispersion-corrected (PBE-D2) calculations. Our analysis based on the computation of the volume and axial compressibilities shows that predicting the anisotropy of BiTeI via the semilocal calculations yields an unrealistic result whereas the results of the PBE-D2 calculations agree with the experimental compressibility data. Our calculations render that BiTeI and AuTeI are narrow band gap semiconductors with Rashba-type spin-splitting at the band edges and with an indirect band gap, respectively. PdTeI, on the other hand, is predicted to be a metal with relatively low density of states at the Fermi level. It is notable that the band gaps computed by using the optimized crystal structures from the PBE (PBE-D2) calculations are found to be greater (smaller) than the respective experimental values, which is against (in line with) the expected trend inasmuch as the band gap is known to be underestimated within the GGA. We also find that the Rashba parameter, Rashba energy and momentum offset of BiTeI are bracketed by the respective values obtained via the semilocal (PBE) and dispersion-corrected (PBE-D2) calculations. Specifically, a larger value for the Rashba parameter is obtained in the PBE-D2 calculations, which could be attributed to the reduction of the band gap caused by modification of the crystal structure owing to the inclusion of van der Waals dispersion terms. Excellent agreement with the experimental data for the Rashba parameter, Rashba energy and momentum offset of BiTeI is obtained via interpolation of the calculated (PBE and PBE-D2) values.
Acknowledgements.
We thank X. Xi and Y. Chen for providing the experimental data used in Figs. 3, 4, and S2. The drawings in Fig. 1 were produced by the visualization software VESTA.Momma and Izumi (2011) The numerical calculations reported here were carried out at the High Performance and Grid Computing Center (TRUBA Resources) of TUBITAK ULAKBIM.*
Appendix A Spin-Orbit-Induced Modification of the BiTeI Band Edges
| Bi | Te | I | |||||||||||
|---|---|---|---|---|---|---|---|---|---|---|---|---|---|
| State | |||||||||||||
| CBM | |||||||||||||
| PBE-D2 | 2 | 13 | 10 | 22 | 2 | 14 | 15 | 4 | 1 | 14 | |||
| PBE | 11 | 9 | 30 | 3 | 14 | 17 | 1 | 2 | 1 | 9 | |||
| CBM | |||||||||||||
| PBE-D2 w/o SOC | 69 | 12 | 6 | 11 | |||||||||
| PBE-D2 | 12 | 16 | 28 | 5 | 14 | 10 | 2 | 2 | 3 | 6 | |||
| PBE | 10 | 13 | 35 | 5 | 13 | 8 | 2 | 2 | 5 | 4 | |||
| PBE w/o SOC | 72 | 10 | 6 | 9 | |||||||||
| VBM | |||||||||||||
| PBE-D2 w/o SOC | 16 | 1 | 3 | 9 | 44 | 24 | |||||||
| PBE-D2 | 14 | 2 | 6 | 12 | 37 | 1 | 1 | 23 | |||||
| PBE | 11 | 4 | 9 | 18 | 34 | 1 | 1 | 16 | |||||
| PBE w/o SOC | 13 | 5 | 8 | 17 | 33 | 2 | 4 | 16 | |||||
| VBM | |||||||||||||
| PBE-D2 | 13 | 4 | 2 | 1 | 7 | 10 | 35 | 1 | 6 | 3 | 14 | ||
| PBE | 10 | 4 | 2 | 13 | 14 | 32 | 5 | 4 | 13 |
A comparison of the calculated band structures with and without SOC has already been presented by Bahramy et al. in Ref. Bahramy et al., 2011 where the PBE-optimized values for and were employed together with the experimental values for and . Here we present a similar comparison in Fig. A1 where no experimental data are used. The lower conduction (upper valence) band states are marked by the solid circles labeled as “CBM” and “CBM” (“VBM” and “VBM”) in Fig. A1. Table A gives the projected wave function character of these states. It is seen in Fig. A1 that Rashba-type splitting is absent in the band structures calculated without SOC (marked as “PBE-D2 w/o SOC” and “PBE w/o SOC”) in both cases with and without the dispersion correction. When SOC is taken into account, Rashba-type splitting occurs on both (conduction and valence) band edges, cf. the curves marked as “PBE-D2” and “PBE” in Fig. A1. It is thus clear that Rashba-type splitting in Fig. A1 [and Fig. 5(a)] originates from spin-orbit interaction. Thanks to the latter, the band edge states have nonvanishing contributions from and orbitals in comparison to the cases without SOC, which could be seen via comparative inspection of rows in Table A. Note, for example, that when SOC is ignored the character of CBM wave function is mostly of Bi- by 72 % (PBE-D2) [69% (PBE)] and contribution from and orbitals is negligible. On the other hand, the contribution from Bi- is reduced to 35 % (PBE-D2) [28% (PBE)] at the expense of nonvanishing contributions from and orbitals when SOC is taken into account. Thus, as demonstrated in Fig. A2(a), the character of CBM wave function would facilitate formation of a two-dimensional electron gas once the Fermi level is above the conduction band minimum. Note that the latter is usually the case with the samples used in recent experimental studies, e.g., Refs. Ishizaka et al., 2011; Kanou and Sasagawa, 2013; VanGennep et al., 2014. It is seen in Fig. A2 that the conduction electrons are really subject to an asymmetric electric field along the -axis [Fig. A2(b)] as mentioned in Section III.3, which are to a significant extent confined in the interplanar regions (i) between Te and Bi layers as well as (ii) between the Bi and I layers [Fig. A2(a)].
Figure A2(b) also shows that the asymmetric electric field along the -axis is substantially enhanced within the dispersion-corrected (PBE-D2) description (the red curve), compared to the PBE-calculated (blue) curve. Note, for comparison, that there is an insignificant change in the planar average of , cf. Fig. S3 (Ref. sup, ). Clearly, the enhancement of the asymmetric electric field along -axis leads to stronger SOC. Hence the value of Rashba parameter obtained via the dispersion-corrected (PBE-D2) calculation turns out to be greater than the respective PBE-calculated value.
Going back to Fig. A1, it is interesting to point out that BiTeI turns out to be an indirect semiconductor in all calculations presented in Fig. A1, which is in line with the former studies.Kulbachinskii et al. (2010); Lee et al. (2011); Sakano et al. (2012) The difference is largest [0.181 Å for PBE w/o SOC] when SOC and dispersion correction are both ignored, which is reduced to 0.044 Å (0.077 Å) via inclusion of SOC (dispersion correction). Taking SOC and dispersion correction into account together yields the smallest difference Å (PBE-D2). Similarly the band gap is reduced from 1.313 eV (PBE w/o SOC) to 1.246 eV (PBE-D2 w/o SOC) owing to the dispersion correction, which is further reduced to 0.207 eV (PBE-D2) via inclusion of SOC. Thus, the reduction in the value of is largely due to SOC (rather than the dispersion correction). Accordingly, strong (weak) SOC implies a smaller (larger) band gap, which corresponds to a greater (smaller) value of the Rashba parameter. Hence and are roughly inversely proportional to each other, which is also noted in a recent studyZhou et al. (2014) on the (BiTeI)(BiTe) heterostructures.
References
- Ishizaka et al. (2011) K. Ishizaka, M. S. Bahramy, H. Murakawa, M. Sakano, T. Shimojima, T. Sonobe, K. Koizumi, S. Shin, H. Miyahara, A. Kimura, K. Miyamoto, T. Okuda, H. Namatame, M. Taniguchi, R. Arita, N. Nagaosa, K. Kobayashi, Y. Murakami, R. Kumai, Y. Kaneko, Y. Onose, and Y. Tokura, Nat. Mater. 10, 521 (2011).
- Bahramy et al. (2012) M. S. Bahramy, B. J. Yang, R. Arita, and N. Nagaosa, Nat. Commun. 3, 679 (2012).
- Xi et al. (2013) X. Xi, C. Ma, Z. Liu, Z. Chen, W. Ku, H. Berger, C. Martin, D. B. Tanner, and G. L. Carr, Phys. Rev. Lett. 111, 155701 (2013).
- Tran et al. (2014) M. K. Tran, J. Levallois, P. Lerch, J. Teyssier, A. B. Kuzmenko, G. Autès, O. V. Yazyev, A. Ubaldini, E. Giannini, D. van der Marel, and A. Akrap, Phys. Rev. Lett. 112, 047402 (2014).
- Bahramy et al. (2011) M. S. Bahramy, R. Arita, and N. Nagaosa, Phys. Rev. B 84, 041202 (2011).
- Eremeev et al. (2012) S. V. Eremeev, I. A. Nechaev, Y. M. Koroteev, P. M. Echenique, and E. V. Chulkov, Phys. Rev. Lett. 108, 246802 (2012).
- Kulbachinskii et al. (2012) V. A. Kulbachinskii, V. G. Kytin, A. A. Kudryashov, A. N. Kuznetsov, and A. V. Shevelkov, J. Solid State Chem. 193, 154 (2012).
- Sklyadneva et al. (2012) I. Y. Sklyadneva, R. Heid, K.-P. Bohnen, V. Chis, V. A. Volodin, K. A. Kokh, O. E. Tereshchenko, P. M. Echenique, and E. V. Chulkov, Phys. Rev. B 86, 094302 (2012).
- Fu (2013) H. Fu, Phys. Rev. B 87, 075139 (2013).
- Rusinov et al. (2013) I. P. Rusinov, I. A. Nechaev, S. V. Eremeev, C. Friedrich, S. Blügel, and E. V. Chulkov, Phys. Rev. B 87, 205103 (2013).
- Zhu et al. (2013) Z. Zhu, Y. Cheng, and U. Schwingenschlögl, New J. Phys. 15, 023010 (2013).
- Kanou and Sasagawa (2013) M. Kanou and T. Sasagawa, J. Physics: Condensed Matter 25, 135801 (2013).
- Wang et al. (2013) C.-R. Wang, J.-C. Tung, R. Sankar, C.-T. Hsieh, Y.-Y. Chien, G.-Y. Guo, F. C. Chou, and W.-L. Lee, Phys. Rev. B 88, 081104 (2013).
- Chen et al. (2013) Y. Chen, X. Xi, W.-L. Yim, F. Peng, Y. Wang, H. Wang, Y. Ma, G. Liu, C. Sun, C. Ma, Z. Chen, and H. Berger, J. Phys. Chem. C 117, 25677 (2013).
- Shevelkov et al. (1995) A. Shevelkov, E. Dikarev, R. Shpanchenko, and B. Popovkin, J. Solid State Chem. 114, 379 (1995).
- Grimme (2006) S. Grimme, J. Comp. Chem. 27, 1787 (2006).
- Rabenau et al. (1970) A. Rabenau, H. Rau, and G. Rosenstein, J. Less Common Metals 21, 395 (1970).
- Fenner and Mootz (1978) J. Fenner and D. Mootz, J. Solid State Chem. 24, 367 (1978).
- Seo et al. (1998) D.-K. Seo, M.-H. Whangbo, K. Neininger, and G. Thiele, J. Solid State Chem. 137, 206 (1998).
- Perdew et al. (1996) J. P. Perdew, K. Burke, and M. Ernzerhof, Phys. Rev. Lett. 77, 3865 (1996).
- Amft et al. (2011) M. Amft, S. Lebègue, O. Eriksson, and N. V. Skorodumova, J. Phys.: Condensed Matter 23, 395001 (2011).
- Clay et al. (2012) A. T. Clay, C. M. Kuntz, K. E. Johnson, and A. L. L. East, J. Chem. Phys. 136, 124504 (2012).
- P. E. Blöchl (1994) P. E. Blöchl, Phys. Rev. B 50, 17953 (1994).
- Kresse and Joubert (1999) G. Kresse and D. Joubert, Phys. Rev. B 59, 1758 (1999).
- G. Kresse and J. Furthmüller (1996) G. Kresse and J. Furthmüller, Phys. Rev. B 54, 11169 (1996).
- Hobbs et al. (2000) D. Hobbs, G. Kresse, and J. Hafner, Phys. Rev. B 62, 11556 (2000).
- Marsman and Hafner (2002) M. Marsman and J. Hafner, Phys. Rev. B 66, 224409 (2002).
- Bucko et al. (2010) T. Bucko, J. Hafner, S. Lebegue, and J. G. Angyan, J. Phys. Chem. A 114, 11814 (2010).
- Monkhorst and Pack (1976) H. J. Monkhorst and J. D. Pack, Phys. Rev. B 13, 5188 (1976).
- Angel (2000) R. J. Angel, edited by R. M. Hazen and R. T. Downs, High-pressure and high-temperature crystal chemistry, Reviews in Mineralogy and Geochemistry, Vol. 41 (2000) Chap. 2, pp. 35–59.
- Strachan et al. (1999) A. Strachan, T. Çağın, and W. A. Goddard, Phys. Rev. B 60, 15084 (1999).
- Lide (2008) D. Lide, CRC handbook of chemistry and physics : a ready-reference book of chemical and physical data (CRC, Boca Raton, Fla. London, 2008).
- (33) One obtains , , , , , , and , using the elemental electronegativitiesLide (2008) (on Pauling’s scale).
- (34) See Supplemental Material for (i) Table S1 that contains the calculated and experimental bond lengths and bond angles in the MeTeI (Me=Bi, Au, Pd) crystals, (ii) Figure S1 that displays the BM fits with 4 for BiTeI and 3 for AuTeI and PdTeI, (iii) Figure S2 that shows a comparison of the calculated and experimental pressure-volume curves for BiTeI. (iv) Figure S3 that displays the planar average of the gradient of the BiTeI crystal potential as a function of distance along the -axis.
- Tasci et al. (2012) E. Tasci, G. de la Flor, D. Orobengoa, C. Capillas, J. Perez-Mato, and M. Aroyo, EPJ Web of Conferences 22, 00009 (2012).
- Aliev and Babanly (2008) Z. Aliev and M. Babanly, Inorganic Materials 44, 1076 (2008).
- Kunc and Syassen (2010) K. Kunc and K. Syassen, Phys. Rev. B 81, 134102 (2010).
- Goodwin et al. (2008) A. L. Goodwin, D. A. Keen, and M. G. Tucker, PNAS (USA) 105, 18708 (2008).
- Fortes et al. (2011) A. D. Fortes, E. Suard, and K. S. Knight, Science 331, 742 (2011).
- Li et al. (2012) W. Li, M. R. Probert, M. Kosa, T. D. Bennett, A. Thirumurugan, R. P. Burwood, M. Parinello, J. A. K. Howard, and A. K. Cheetham, J. Am. Chem. Soc. 134, 11940 (2012).
- Cairns et al. (2013) A. B. Cairns, J. Catafesta, C. Levelut, J. Rouquette, A. van der Lee, L. Peters, A. L. Thompson, V. Dmitriev, J. Haines, and A. L. Goodwin, Nature Mat. 12, 212 (2013).
- Hanfland et al. (1989) M. Hanfland, H. Beister, and K. Syassen, Phys. Rev. B 39, 12598 (1989).
- Okuda and Kimura (2013) T. Okuda and A. Kimura, J. Phys. Soc. Jpn 82, 021002 (2013).
- Lee et al. (2011) J. S. Lee, G. A. H. Schober, M. S. Bahramy, H. Murakawa, Y. Onose, R. Arita, N. Nagaosa, and Y. Tokura, Phys. Rev. Lett. 107, 117401 (2011).
- Sakano et al. (2012) M. Sakano, J. Miyawaki, A. Chainani, Y. Takata, T. Sonobe, T. Shimojima, M. Oura, S. Shin, M. S. Bahramy, R. Arita, N. Nagaosa, H. Murakawa, Y. Kaneko, Y. Tokura, and K. Ishizaka, Phys. Rev. B 86, 085204 (2012).
- Ideue et al. (2014) T. Ideue, J. G. Checkelsky, M. S. Bahramy, H. Murakawa, Y. Kaneko, N. Nagaosa, and Y. Tokura, Phys. Rev. B 90, 161107 (2014).
- VanGennep et al. (2014) D. VanGennep, S. Maiti, D. Graf, S. W. Tozer, C. Martin, H. Berger, D. L. Maslov, and J. J. Hamlin, J. Phys.: Condensed Matter 26, 342202 (2014).
- Momma and Izumi (2011) K. Momma and F. Izumi, J. Appl. Cryst. 44, 1272 (2011).
- Kulbachinskii et al. (2010) V. Kulbachinskii, V. Kytin, Z. Lavrukhina, A. Kuznetsov, and A. Shevelkov, Semiconductors 44, 1548 (2010).
- Zhou et al. (2014) J.-J. Zhou, W. Feng, Y. Zhang, S. A. Yang, and Y. Yao, Sci. Rep. 4 (2014).
Supplemental Material
-
•
Table S1 lists the calculated and experimental bond lengths and bond angles in the MeTeI (Me=Bi, Au, Pd) crystals.
-
•
Figure LABEL:BM433 displays a plot of the energy difference versus the volume, and the BM fits with for BiTeI and for AuTeI and PdTeI.
-
•
Figure LABEL:VPexp shows a comparison of the calculated and experimental pressure-volume curves for BiTeI.
-
•
Figure LABEL:delVbc displays the planar average of the gradient of the BiTeI crystal potential as a function of distance along the -axis.
| PBE | PBE-D2 | Experimental | ||
|---|---|---|---|---|
| BiTeI | ||||
| 3.08 | 3.04 | 3.27 | ||
| 3.31 | 3.30 | 3.04 | ||
| 92.03 | 89.55 | 83.05 | ||
| 174.45 | 174.10 | 174.43 | ||
| 91.82 | 94.63 | 92.79 | ||
| 84.06 | 80.90 | 91.11 | ||
| AuTeI | ||||
| 2.719 | 2.711 | 2.680 | ||
| 2.671 | 2.665 | 2.642 | ||
| 2.702 | 2.694 | 2.654 | ||
| 2.727 | 2.694 | 2.684 | ||
| 3.337 | 3.375 | 3.235 | ||
| 3.711 | 3.584 | 3.500 | ||
| 3.753 | 3.791 | 3.633 | ||
| 4.212 | 4.163 | 4.193 | ||
| 4.143 | 4.034 | 4.000 | ||
| 3.998 | 3.700 | 3.843 | ||
| 160.89 | 158.97 | 160.26 | ||
| 85.99 | 84.27 | 86.17 | ||
| 100.78 | 100.79 | 100.09 | ||
| 76.77 | 78.07 | 75.29 | ||
| 98.02 | 98.44 | 99.40 | ||
| 163.69 | 170.06 | 167.71 | ||
| 103.23 | 101.93 | 104.71 | ||
| 100.25 | 97.65 | 97.34 | ||
| 94.86 | 86.75 | 92.12 | ||
| PdTeI | ||||
| 2.636 | 2.629 | 2.601 | ||
| 2.881 | 2.832 | 2.844 | ||
| 2.762 | 2.742 | 2.715 | ||
| 4.047 | 3.946 | 3.952 | ||
| 4.048 | 3.910 | 3.873 | ||
| 3.377 | 3.532 | 3.385 | ||
| 3.727 | 3.772 | 3.706 | ||
| 3.758 | 3.844 | 3.809 | ||
| 79.7 | 84.4 | 81.2 | ||
| 85.74 | 89.02 | 89.06 | ||
| 166.64 | 172.64 | 168.62 |
Computed by using the lattice parameters given in Tables 1 and 2 of Ref. 15 since in Ref. 15 the bond lengths given in Table 3 are not consistent with Tables 1 and 2, as noted by Bahramy et al. (Ref. 5).
Note that in Ref. 15 the bond angles given in Table 3 are consistent with Tables 1 and 2.