IRIS and SDO observation of recurrent explosive events
Abstract
Observations of recurrent explosive events (EEs) with time scale of 3-5 minutes are reported. These EEs have been observed with the Interface Region Imaging Spectrograph (IRIS) and have a spatial dimension of along the slit. The spectral line profiles of C II Å and Si IV Å become highly broadened both in red as well as blue wings. Several absorption lines on top of the broadened profiles were identified. In addition, emission lines corresponding to neutral lines such as Cl I 1351.66 Å, C I 1354.29 Å, and C I 1355.84 Å were identified. The C I 1354.29 Å, and C I 1355.84 Å lines were found only during the EEs whereas Cl I 1351.66 Å broadens during the EEs. The estimated lower limit on electron number density obtained using the line ratios of Si IV and O IV is about cm-3, suggesting that the observed events are most likely occurring at heights corresponding to lower chromosphere. To the best of our knowledge, for the first time we have detected short-period variability (30 s and 60–90 s) within the EE bursts. Observations of photospheric magnetic field underneath EEs indicate that negative polarity field emerges in the neighbourhood of oppositely directed positive fields which undergo repetitive reconnection (magnetic flux cancellation) events. The dynamic changes observed in AIA 1700 Å, 1600 Å, C II 1330 Å and Si IV 1400 Å intensity images corresponded very well with the emergence and cancellation of photospheric magnetic field (negative polarity) on the time scale of 3–5 min. The observations reported here suggests that these EEs are formed due to magnetic reconnection and are occurring in the lower chromosphere.
Subject headings:
Sun: atmosphere — Sun: transition region — Sun: chromosphere — Sun: UV radiation — line: profiles — Magnetic fields1. Introduction
The solar atmosphere is highly dynamic changing on time-scales of minutes to hours. Among many, explosive events (EEs) are one of the prominent phenomena observed in the solar transition region. They were discovered by Brueckner & Bartoe (1983) using the observations recorded by the High-Resolution Telescope and Spectrograph (HRTS) onboard Black Brant sounding rockets. EEs are characterized with broad line profiles with high velocity components ( km s-1), which form around 105 K. They have a spatial scale of km (2 ″) and life time of s (Dere et al., 1989).
Using the observations recorded from the Solar Ultraviolet Measurements of Emitted Radiation (SUMER; Wilhelm et al., 1995) spectrograph onboard SOHO, Innes et al. (1997b) reported observations of EEs in chromosphere, which revealed the presence of bi-directional plasma jets as predicted by theoretical models of magnetic reconnection. It was also found that these events often occur in bursts lasting up to 30 min, whereas individual events may have typical lifetimes of about 1–6 min (Innes et al., 1997a; Chae et al., 1998). EEs may occur at the same location with period around 3–5 min and may be triggered by waves found in the solar atmosphere (Ning et al., 2004; Doyle et al., 2006). It has also been reported that EEs are preferentially located in the regions with weak and mixed magnetic polarity (Chae et al., 1998) and are associated with the canceling magnetic flux (see e.g., Muglach, 2008; Huang et al., 2014).
Recently, Peter et al. (2014) studied similar events using the observations recorded by the Interface Region Imaging Spectrograph (IRIS; De Pontieu et al., 2014) and found example of a bi-directional jet from the emission profiles of Si IV 1394/1403 Å doublet. They also found absorption lines from cooler ions superimposed on these lines suggesting that these hot events are occurring in the cooler atmosphere of the Sun. Schmit et al. (2014) also found absorption features from a multitude of cool atomic and molecular lines while studying the broadened profiles of Si IV transition region lines during the brightening events. Huang et al. (2014) studied single event of EE along with underlying magnetic field evolution. They found the evidence of magnetic flux cancellation and suggested that magnetic reconnection must have taken place during the EE.
In this paper, we present observations of recurrent EEs using the high-resolution spectroscopic and imaging observations from IRIS. We also study the evolution of underlying magnetic field and explore the relationship between the EEs and the presence of waves in the atmosphere. The paper is organized as follows. We describe the observations in section 2 and discuss the results in section 3. We have summarized the results and concluded in section 4.
2. Observations
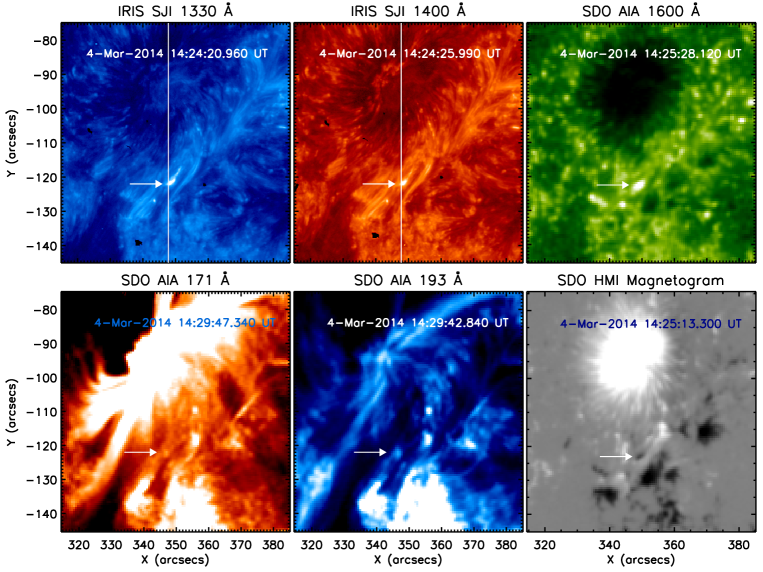
Data analyzed in this work were obtained by IRIS on 2014 March 4 between 12:39 UT to 14:37 UT using sit-and-stare mode. The top left and middle panels of Figure 1 shows the location of the IRIS slit above the slit-jaw images (SJI) obtained in C II 1330 Å and Si IV 1400 Å. The top right, bottom left and middle panels show corresponding images taken in 1600 Å, 171 Å and 193 Å passbands of the Atmospheric Imaging Assembly (AIA; Lemen et al., 2012) on board the Solar Dynamics Observatory (SDO). The bottom right panel displays line-of-sight (LOS) magnetic field measurement obtained from the Helioseismic and Magnetic Imager (HMI; Schou et al., 2012), also on-board SDO. The arrows in all the panels mark the location of the recurrent EEs.
IRIS spectra were obtained with an exposure time of 4 s resulting in cadence of approximate 5 s, whereas SJI were obtained with an exposure time of 4 s and effective cadence of 15 s. In this study, we have used IRIS level-2 data provided by the IRIS team. IRIS slit-jaw images from different filters and detectors are already co-aligned for level-2 data111http://iris.lmsal.com/itn26/calibration.html#coalignment-between-channels-and-sji-spectra. We also used the fiducial mark along the slit and SJI to correct any offset between them. The wobble effect due to thermal flexing between the guide telescope and the main IRIS telescope is already corrected in regular IRIS operations based on the orbital wobble tables (De Pontieu et al., 2014, and private communication, Hui Tian). This correction may still leave an uncertainty of about 1-2 pixels, which will not be important for the analysis performed over several spatial pixels.
Data obtained from AIA and HMI have also been utilized in this work. IRIS and AIA observations were co-aligned using IRIS-SJI Si IV 1400 Å and AIA 1600 Å images. All the HMI and AIA images obtained in different filters were co-aligned and de-rotated with respect to AIA 1600 Å image obtained at 14:09:52 UT using the standard Solar Software (SSW) routines. The obtained dataset provide an unique opportunity to study time evolution of recurrent EEs using both imaging and spectroscopic observations and to study the evolution of underlying magnetic field.
3. Results and Discussions
Transition region EEs are identified by very broad emission line profiles showing non-Gaussian enhancements in both the wings (Brueckner & Bartoe, 1983). We identified one such small-scale bright structure (with spatial width ) in the slit-jaw images of C II 1330 Å and Si IV 1400Å at the location [348.07 ″, -121.44 ″]. The identified EE is marked with arrows in all the panels in Figure 1. A corresponding animation is provided online, see ee.mp4. An enhancement in intensity corresponding to the location and time of EEs identified in C II 1330 Å and Si IV 1400 Å images is observed in AIA 1600 Å image (top right panel). The enhancement can also be identified in images taken in AIA 171 Å and AIA 193 Å images, though not as clearly as in AIA 1600 Å. The bottom right panel displays magnetic field map. The arrow locates a small-scale () negative polarity region (average field strength 350 G) surrounded by the positive magnetic polarity regions, which spatially and temporally corresponds to the identified EEs. The vertical white line in the IRIS slit-jaw images locates the IRIS slit. Fortuitously, the slit was located right at the location where the EE occurred allowing us to perform detailed spectroscopic study. Below we discuss the spectroscopy properties of this feature.
3.1. Evolution of Spectral Line Profiles
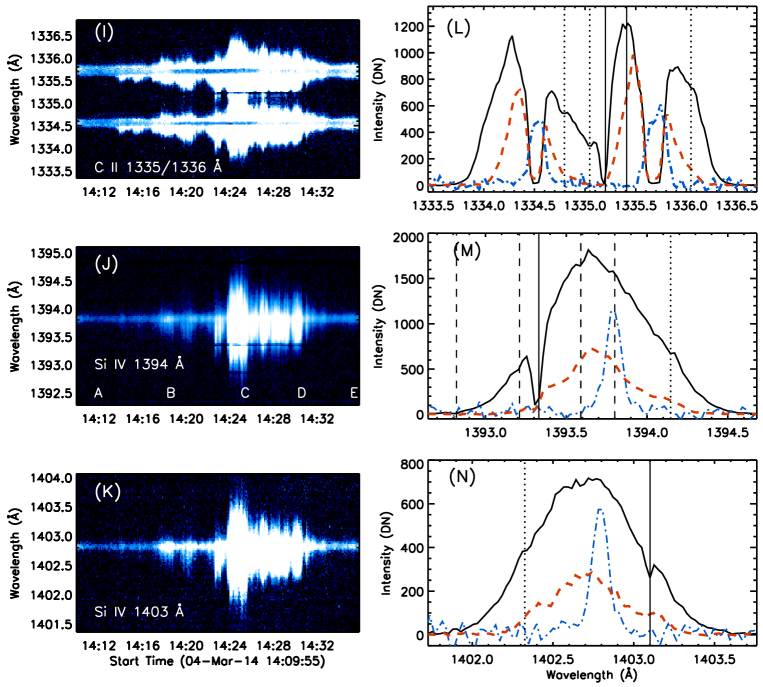
We selected a small portion of IRIS slit data corresponding to the spatial location the EE during the time interval of 14:09 UT to 14:36 UT. In Figure 2, we plot time evolution of the spectral line profiles of C II 1335/1336 Å doublet, Si IV 1394 Å, and 1403 Å (see panels I, J and K). An analysis of the time evolution of the profiles revealed that the EE occurred in multiple bursts with a time period of 3–5 min and each burst lasted approximate for 2–3 min. Time evolution of event indicated by the enhancement in the intensity and width correspond to each burst (see panels I, J and K).
In the beginning, for the first few bursts, the enhancement in the intensity was by a factor of 4–12 whereas for later events the enhancement in intensity was about a factor of 20–40 with respect to the pre-EE phase at the same location (see section 3.2). Since, as can be seen in the animation ‘ee.mp4’, the spatial extent and locations of the bursts changed with time, a few bursts in the beginning and at the end could only be observed marginally.
Panels L, M and N, respectively, show spectral line profiles of C II doublet, and two Si IV lines (1394 Å and 1403 Å) at different times. The solid lines show the spectra at the peak time of EE (labeled as C in panel J) and dashed line show the spectra for the time labeled as D in panel J. For comparison, we have also over-plotted the spectra at a quiescent time (labeled as A in panel J) with dashed- dotted line. As can be inferred from the plots, during quiescent phase C II 1335/1336 Å doublet line show extremely weak self-absorption feature (almost non-existent) in the line center, which could be due to large opacity as was pointed out by Peter et al. (2014). At the times when EEs have started, profiles of C II and Si IV have strongly broadened. This is essentially due to the enhancement in both the wings, which were sometimes observed to be asymmetric. During the bursts phase, self-absorption features in highly broadened C II lines increase sharply and bifurcate the spectral line in two (see panel L, solid line and dashed line). The O IV 1401 Å spectral line show only about 50% enhancement in the intensity during the peak phase of the EEs, unlike the spectral lines of C II and Si IV, where the enhancement is much higher.
During the initial times, when EEs were caught marginally by IRIS slit, profiles showed mostly blue-shifted emission (or blue wing enhanced). However, during the later time, profiles became very broad with enhancements in both red and blue wings. We fitted the complete C II doublet with two positive and two negative amplitude Gaussian functions and each Si IV lines with a single Gaussian function. While fitting, we used error bars, which were provided with IRIS level-2 data on the measured data numbers (DN). As EEs are believed to have highly non-Gaussian profiles, the reduced and the residuals of the fit were generally higher during the peak activity of the EEs. We measured Doppler velocity and width (FWHM) of the line with respect to the corresponding average line center position obtained at the quiescent phase (at position A labeled in panel J). Doppler width at quiescent phase is about 35 km s-1 for both C II and 25 km s-1 for both Si IV lines.
Both the prominent Si IV lines show almost identical Doppler velocity and width variation with time. Doppler velocity and width measured from both the Si IV lines exceeds -50 km s-1 and 150 km s-1 at the peak of activity around 14:25 UT. However, at the same location and time, C II lines measured Doppler velocity and width exceeding -35 km s-1 and 140 km s-1 at the peak activity time, whereas C II self-absorption lines measured -10 km s-1 and 65 km s-1 respectively. Unlike the two Si IV lines, the two C II emission lines do not show similar Doppler velocity and width. C II 1335.7 Å emission line consistently shows lower Doppler velocity and width as compared to C II 1334.5 Å. The lower values of Doppler shift and width in C II 1335.7 Å may result due to the presence of strong Ni II 1335.2 Å absorption line.
From the Figure 2, we identify presence of several absorption features in the emission line profiles. The most prominent absorption feature corresponds to Ni II 1335.20 Å line observed on the top of broadened emission line profile of C II 1335.71 Å. Absorption features of Ni II 1393.33 Å, and Fe II 1403.10 Å were also observed very prominently on the top of profiles of Si IV 1393.76 Å, and 1402.77 Å respectively. These lines are marked with vertical solid lines. Other less prominent absorption features were also found at 1334.82 Å, 1335.07 Å, Fe II 1335.41 Å, 1336.07 Å, Fe II 1392.81 Å, Fe II 1393.21 Å, Fe II 1393.59 Å, Si IV 1393.80 Å, 1394.17 Å, 1402.35 Å, Si IV 1402.77 Å. The identified absorption lines are marked with vertical dashed lines whereas unidentified lines are marked with vertical dotted lines. Many of these absorption features were reported very recently by Schmit et al. (2014); Peter et al. (2014) and Yan et al. (2015). Some of them have also reported the presence of self-absorption lines on the top of broadened profiles of C II 1334.54 Å and 1335.71 Å, Si IV 1393.76 Å and 1402.77 Å during the explosive events.
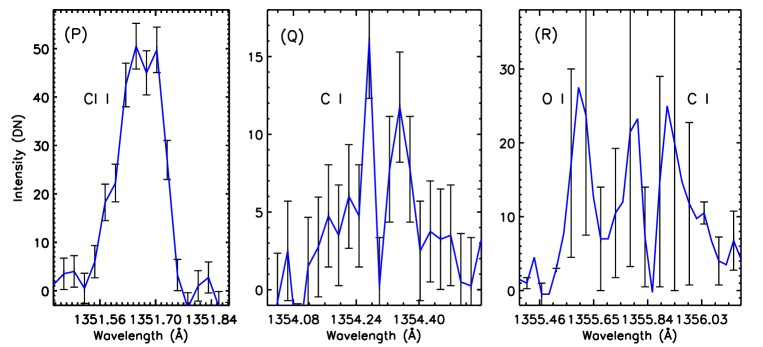
We have also identified several emission lines coming from neutral atoms such as Cl I 1351.66 Å, C I 1354.29 Å, C I 1355.84 Å and O I 1355.60 Å. All these lines except the O I 1355.60 Å show presence of either self-absorption or absorption features (see Figure 3) during the peak activity time of explosive events. To the best of our knowledge, this is first report of appearance of self-absorption features in the emission lines of neutral atoms. However, we note that the associated error bars on the data points are relatively large. Therefore, a more detailed investigation is required to confirm that these are indeed self absorption features. The C I 1354.29 Å, and 1355.84 Å lines were not present during the quiescent phase and were detected only during the EE, whereas Cl I 1351.66 Å line was present during the quiescent phase and broadened during the EEs. The O I 1355.6 Å was present both during the quiescent phase as well as during EEs. However, surprisingly, we didn’t find any absorption feature and noticeable line broadening of O I 1355.6 Å line during any time. such as Cl I 1351.66 Å, C I 1354.29 Å, and C I 1355.84 Å during the EEs in the IRIS spectra.
3.2. Intensity Evolution of Explosive Events
IRIS records both spectroscopic and imaging data of the solar atmosphere simultaneously. While spectra recorded with the slit has very limited field of view, IRIS slit-jaw imager (SJI) can record data in the bigger field of view. As mentioned in the Section 3.1, IRIS slit caught few bursts marginally. Thus we also use SJI images obtained in 1330 Å and 1400 Å passbands of IRIS to study the full time evolution of the whole EEs sequence. We also looked into the different AIA passbands to find any signatures of these events in the upper layers of the atmosphere.
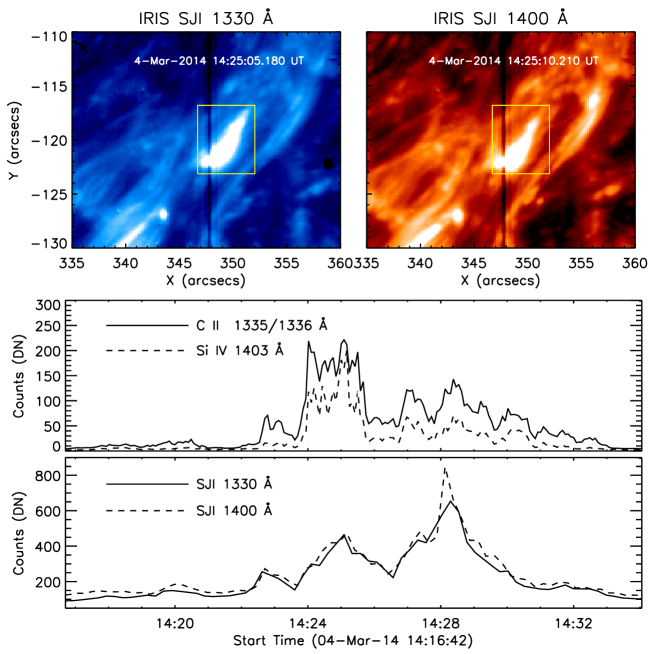
In top panels of Figure 4 (see movie ), we show an area chosen to study the intensity evolution in IRIS 1330 Å and 1400 Å passbands. Middle panel of Figure 4 displays the change in the intensity with time as recorded by IRIS spectrometer. The light curves clearly reveal that the first and last few bursts were weak. The strongest burst were seen starting at around 14:24 UT. In the bottom panel of Figure 4, we plot intensity obtained in the chosen area with time in different passbands of IRIS. Recently, Martínez-Sykora et al. (2015) found that IRIS passbands have significant contributions from the continuum. However, continuum effect will be significant only when signals in the C II and Si IV lines are too weak to explain the presence of observed features in the 1300 and 1400 Å SJIs. In the case of EEs, signals in C II and Si IV profiles are very strong (stronger by a factor of 4-40), which are seen in the SJIs, thus, the contribution from the continuum may be ignored. The light curve for two IRIS passbands show very similar evolutionary characteristics. The light curve obtained from IRIS passbands indicate that total intensity of EEs was increasing with time in the beginning and started decreasing only after 14:28 UT. The strongest burst in SJI images were seen at around 14:28 UT, which is partially being captured by the IRIS slit. It should also be noted that since the IRIS spectra were recorded at higher cadence as compared with the SJI images, we are able to see even shorter bursts within each EE recorded by SJI.
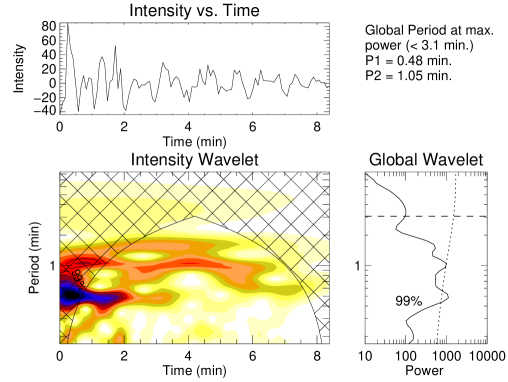
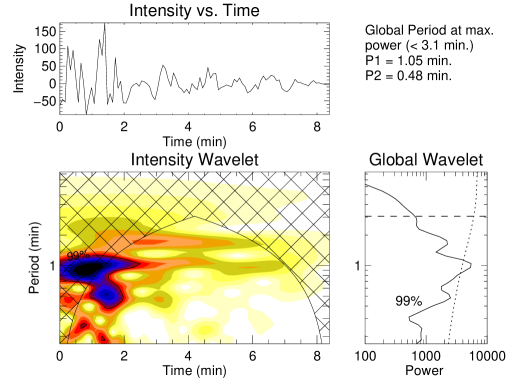
To find the period of intensity variability within the EE, we performed wavelet analysis (Torrence & Compo, 1998) on the intensity variation with time as recorded by C II 1335/1336 Å (see Figure 5) and Si IV 1394 Å and 1403 Å (see Figure 6) spectral lines. The top panels in both the figures show the variation of intensity with time starting at 14:21:28 UT. The bottom left panels are wavelet power spectrum (color inverted) with 99 % confidence levels and bottom right panels are global wavelet power spectrum (wavelet power spectrum summed over time) with 99% global confidence. We used background (trend) subtracted intensity to obtain the wavelet power spectrum. Background (trend) was obtained by taking the 10-point running average of the intensity variation. The power spectra obtained for both the spectral lines reveal the presence of short-period intensity variability in the EE light curves with two distinct periods of around 30 s and 60–90 s in addition to 3–5 min variability. We also find that even without background (trend) subtraction, the obtained power peaks at the same periods in the wavelet spectra, though with lower confidence level. We note here that plots shown here is created for the intensities which were obtained after taking summation over the spectral profile range of the lines. However, we have found that the variability obtained after performing wavelet analysis on Gaussian amplitudes, and product of Gaussian width and amplitude are essentially the same. Further, we rule out the effect of wobble, if any, on the obtained short term variabilities. It has been found that during a course of half orbit ( min), IRIS pointing moves by about 17 –18 pixels (, in course of full orbit, pointing may come back to its original position) on the Sun (De Pontieu et al., 2014). This means that slit location will change by about 1 pixel in 2.8 min, whereas, in this analysis, we found intensity variabilities of the order of 1 min and less within the individual EEs extended over several spatial pixels. Therefore, instrumental wobble do not have affected our analysis and henceforth the obtained short-period intensity variabilities.
Repetitive nature of explosive events and jets with periodicities of 3–5 min have been reported earlier (see e.g, Ning et al., 2004; Doyle et al., 2006) and have been attributed to presence of MHD waves in the atmosphere with similar periods. However, to the best of our knowledge, this is the first time a short-period variability with periods of 30 s and 60–90 s has been detected in EEs. Recently, using Hi-C data Pant et al. (2015) found evidence of short-period (30 s and 53–73 s) oscillations in braided magnetic region, providing evidence in favor of connection between short period waves and bursts. However, at this point we can not conclude whether oscillations are driving burst events or vice-versa.
3.3. Electron Density in Explosive Events

To estimate electron density during the EEs, density sensitive O IV 1401 Å and 1399 Å line pair may be used, although see (Dudík et al., 2014). Both these lines are very weak in the IRIS spectra. By binning over a few pixels the signal to noise ratio (SNR) for O IV 1401 Å can be improved. However, this does not improve the SNR for O IV 1399 Å.
Based on the suggestions provided by Peter et al. (2014), we estimated electron density using O IV 1401.16 Å and Si IV 1393.76 Å (see however Doyle et al., 2013), which only provides a lower limit of the electron density. Since our goal is to get an order-of-magnitude estimate for the electron density, method suggested by Peter et al. (2014) will serve the purpose. For this calculation, we have used the photospheric abundances of Grevesse & Sauval (1998) and CHIANTI ionization equilibrium (Landi et al., 2012).
In order to improve the signal to noise ratio, we binned spectra over 7 pixel along the direction of the slit. The top two panels in Figure 7 show two examples of O IV 1401 Å line profiles at two different times. As can be seen from the line profiles there are still not enough counts to allow to fit a Gaussian, we summed over the profile (wavelength range from 1400.94 Å to 1401.50 Å) and subtracted the contribution of continuum to estimate the O IV 1401 Å contribution. Although the Si IV 1393.76 Å line is strong enough to fit a Gaussian and obtain the Gaussian integrated intensity, however, for consistency we have used the same method to obtain the intensity as for O IV 1401 Å.
The resultant intensity variation of both the lines are plotted in middle panel of Figure 7. Electron number densities estimate during the quiescent time is around cm-3 which increases to cm-3 during the peak of the activity (see bottom panel of Figure 7). We note that since the intensities derived for O IV 1401 Å is the upper limit, the densities obtained here are essentially the lower limit. This estimated lower limit on the electron number density together with appearance of neutral lines (C I 1354.29 Å, and C I 1355.84 Å) during the EE strongly suggests that event probably occurred somewhere in the lower chromosphere, as was also pointed out by Peter et al. (2014)
3.4. Comparison with AIA Observations
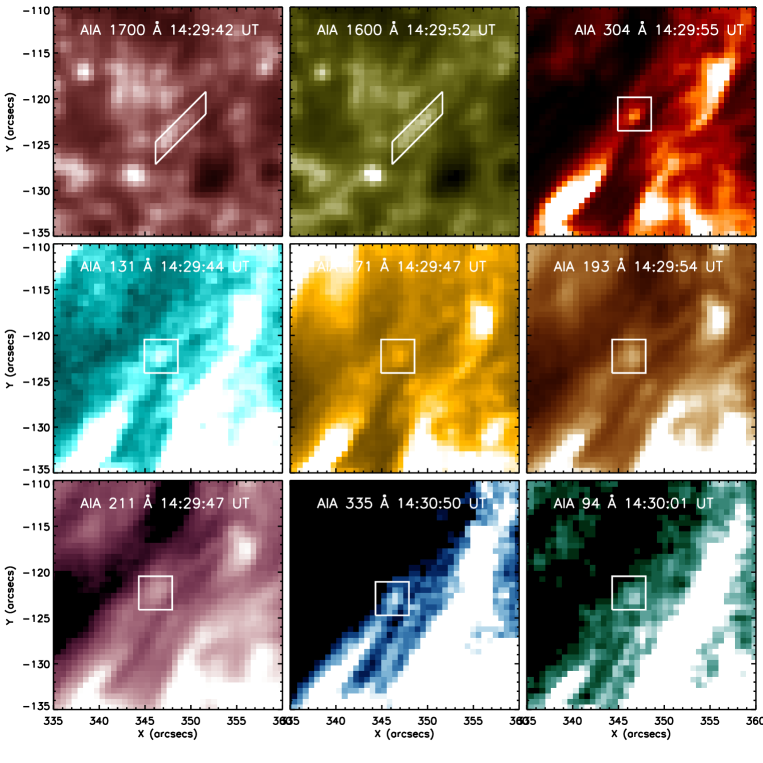
To study if there were any hotter counterparts of the repetitive EEs, we examined the different AIA passbands. Figure 8 displays AIA images taken just after the peak at 14:28 UT as seen in the bottom panel of Figure 4 in all its passbands. For complete time evolution, see movie . The observations recorded using 1700 Å and 1600 Å passband show appearance and movement of EEs in full extent – marked by a rectangular box – similar to that seen in IRIS-SJI images, see the light curves plotted in Figure 9. The light curves are plotted using normalized intensities, which were obtained as . However, the hotter channels of AIA show only a small but distinguishable brightening that is spatially correlated to that of the EEs. These brightening are located in the images using a square. The full extent of these brightening is not clear in these hotter channels. Also, their is a time lag of about 5 minutes in the appearance of these brightening in hotter channels. This makes us wonder if these brightening are similar to those observed using SJI as well as AIA 1700 Å and 1600 Å images. We would also like to point out that coronal loops that connect to more southerly negative flux from the sunspot is more likely crossing the field of view. As pointed out by Peter et al. (2014), EUV radiation is strongly attenuated by overlying hydrogen so it would not be surprising to see no signature of the events in AIA passbands at the same time. However, as time progress more energy is released, resulting in ionization of hydrogen with time, we see response in AIA passbands for later events.

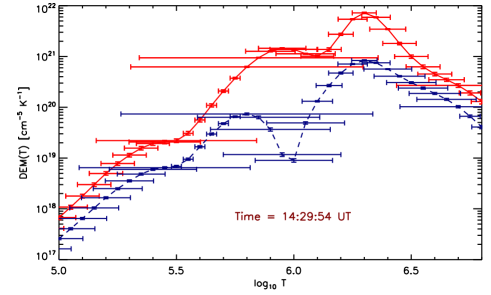
In order to understand the nature of the small brightening seen in the AIA hotter channels, we performed differential emission measure (DEM) analysis to obtain the differential emission measure distribution using the regularized inversion method of Hannah & Kontar (2012). The DEM was obtained using AIA 131 Å, 171 Å, 193 Å, 211 Å, 335 Å, and 94 Å intensities recorded at nearby time of 14:29:54 UT when emission in AIA 193 Å channel peaks. The obtained DEM curve is plotted in Figure 10. The red curve is DEM before background subtraction and the blue curve is after the background subtraction. Background intensities are intensities obtained at the EE location just before the brightening start appearing in AIA images. As expected, the overall DEM values decreases after the background subtraction. The DEM curve show rather a strong dip at 1 MK after the background subtraction. However, the peak emission is still coming from a temperature of . This suggests that the brightening seen in the AIA channels is at coronal temperature. There is also another peak at . However, the error bars are much bigger at this location in the plot.
If the brightening seen in hotter AIA channels are related to those seen in IRIS-SJI as well as AIA 1600 Å and 1700 Å images, then the plasma must be heated to about 2 MK. As mentioned earlier, the time analysis shows that there is a lag about 5 minutes in the appearance of these brightening in hotter channels. Also we note that by the time these brightening appear in hotter channels, they disappear from the SJI images. However, at this point, we are not able to conclude if these brightening are exactly related to each other.
3.5. Magnetic Field Evolution of Explosive Event
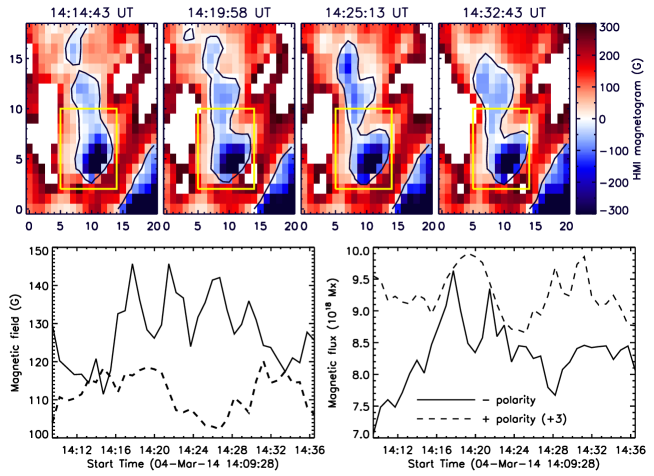

We analyzed HMI/SDO magnetogram data to study evolution of photospheric magnetic field during the EE. Figure 11 (see movie ) shows presence of small-scale negative field (enclosed with a rectangular box) surrounded by the positive field at the location of EE. We have studied the temporal evolution of positive and negative magnetic field as well as flux in the the boxed region and plotted in Figure 11. As can be seen from the plots, negative polarity field and flux (solid lines in bottom panels) increases and decreases during the EEs on the time scale of 3–5 min. Whereas positive polarity field and flux (dashed lines in bottom panels) show somewhat decay during that time.
To find any correlation between fluctuations in magnetic field measured from HMI and in intensity during EE measured from AIA and IRIS, we perform correlation analysis at different time delays. HMI magnetogram is obtained at photospheric height whereas AIA 1700 Å is formed at photosphere and temperature minimum height, thus, are more suitable for direct correlation study. Correlation of intensity fluctuations obtained from AIA 1600 Å, IRIS 1330 Å, and 1400 Å are performed with respect to that obtained from AIA 1700 Å. As cadence of HMI is 45 s whereas that of AIA 1600 Å, 1700 Å and IRIS 1330 Å, 1400 Å are 24 s and 15 s respectively. We interpolated AIA 1700 Å with respect to HMI time sequence using spline routines. We also interpolated AIA 1600 Å, and IRIS 1330 Å, 1400 Å light curves with respect to time sequence of original AIA 1700 Å. Thus, we obtained cross-correlation coefficients at different time delays for the pairs of HMI magnetogram (negative polarity) and AIA 1700 Å light curve, AIA 1700 Å and 1600 Å, AIA 1700 Å and IRIS 1330 Å, and AIA 1700 Å and IRIS 1400 Å light curves. We plot respective pairs of light curves and correlation coefficients at different time delays in Figure 12. Maximum correlation value between HMI magnetogram (negative polarity) and AIA 1700 Å light curve is about 0.77 at the time delay of 135 s, which corresponds to 3 HMI time frames. However, that between AIA 1700–1600 Å, AIA 1700–IRIS 1330 Å, AIA 1700–IRIS 1400 Å pairs are about 0.84, 0.82, 0.79 respectively at the time delay of 0 s. Maximum cross-correlation co-efficient between AIA 1600 Å and IRIS 1330 Å and 1400 Å are above 0.90 at time delay of 0 s (not shown here). Thus, the obtained results suggest that intensity fluctuations as recorded from AIA 1600 Å and 1700 Å and IRIS passbands are connected to fluctuations in photospheric magnetic fields as recorded from HMI with the time delay of about 135 s. Increase in flux and field could be related to flux emergence, whereas decrease in magnetic field and flux could be associated with magnetic flux cancellation resulting due to magnetic reconnection. Magnetic flux cancellation events underneath EEs had been previously reported by Chae et al. (1998) and recently by Huang et al. (2014). However, to the best of our knowledge, this is first time we report such a correlated change in AIA 1700 Å, 1600 Å, C II 1330 Å, and Si IV 1400 Å intensity with photospheric magnetic field (in this case negative polarity) on the time scale of 3–5 min during the recurrent bursts of EEs.
In order to get further insight of the magnetic field evolution, we performed a long term study of the sunspot region i.e. from the time when it first emerged on the east limb on Feb 25, 2014 AR 11990 till the time of the analyzed EEs using HMI observations. The region appeared as a simple sunspot (with negative polarity) within which an emergence of a positive field region was detected. This positive field region evolved with time and developed as a complete sunspot with positive polarity, suggesting a highly complex field evolution and formation of a delta-sunspot (Gupta et al. in preparation). With the evolution of the sunspot, various moving magnetic features (MMFs) were observed. Therefore, in the context, it is plausible to conclude that the active region is relatively a young with several small-scale MMFs around the sunspot. The EEs studied in current paper was related to one of the MMFs.
4. Summary and Conclusions
In this paper we studied observations of recurrent EEs using simultaneous spectroscopic and imaging observations recorded by IRIS, AIA images and HMI magnetogram. To the best of our knowledge, this is first report of such recurrent EEs using IRIS data. The recurring time scale of these EEs were about 3-5 min. During the event, line profiles of C II and Si IV showed enhanced broadening with Doppler velocity and width exceeding more than -50 km s-1 and 150 km s-1 respectively. In addition, we identified several absorption lines on the top of broadened emission lines of C II and Si IV. Moreover, we also found a few neutral atom lines such as Cl I 1351.66 Å, C I 1354.29 Å, and C I 1355.84 Å with possible self- absorption features. While C I 1354.29 Å,1355.84 Å lines appeared only during the EEs, the Cl I 1351.66 Å, which was present before the EEs, showed broadening during the EEs. The lower limit on electron densities obtained using the method proposed by Peter et al. (2014) was about cm-3. Using the high cadence spectroscopic observations we also discovered short period variability ( 30 s and 60–90 s) within the EE bursts.
The analysis the LOS of photospheric magnetic field measured by HMI underneath explosive events indicated emergence as well as cancellation of magnetic flux. The negative polarity magnetic flux showed continuous increase with a periodic fluctuations, suggesting localized cancellations (see bottom panels of Figure 11). The changes in AIA 1700 Å, 1600 Å, C II 1330 Å, and Si IV 1400 Å intensities correlated extremely well with the changes in the negative polarity magnetic flux on the time scale of 3–5 min during the recurrent bursts of explosive events, which has not been reported earlier, to the best of our knowledge.
The observations of strong broadening in C II and Si IV spectral lines along with self-absorption and estimated high electron density suggests that these are lower chromospheric features. The correlation with canceling magnetic features supports the idea of formation of these features due to magnetic reconnection. We believe that these features can be explained by resistive emergence of magnetic flux underneath the photosphere and expanding in the upper layers (see e.g., Pariat et al., 2004; Isobe et al., 2007). This concept has successfully explained the formation of Ellerman Bombs, which were originally detected in H observations (Ellerman, 1917). In this scenario, a number of loops rise due to well known Parker’s instability from underneath the photosphere and expand. While emergence and expansion, they interact with each other and the process of magnetic reconnection occurs. The process of reconnection may produce the EEs and heat the plasma locally. This process may result in a cool material being stacked upon locally heated material, thus resulting in a cool absorption lines superimposed on the hot emission lines as proposed by Peter et al. (2014). Therefore, the observed EEs are most likely the upper atmospheric counterpart of Ellerman Bombs. This concept, however, needs to be throughly verified using observations recorded in H line core and wings along with IRIS observations and forward modeling of the spectral lines using MHD simulations of realistic solar atmosphere.
References
- Brueckner & Bartoe (1983) Brueckner, G. E., & Bartoe, J.-D. F. 1983, ApJ, 272, 329
- Chae et al. (1998) Chae, J., Wang, H., Lee, C.-Y., Goode, P. R., & Schühle, U. 1998, ApJ, 497, L109
- De Pontieu et al. (2014) De Pontieu, B., Title, A. M., Lemen, J. R., et al. 2014, Sol. Phys., 289, 2733
- Dere et al. (1989) Dere, K. P., Bartoe, J.-D. F., & Brueckner, G. E. 1989, Sol. Phys., 123, 41
- Doyle et al. (2013) Doyle, J. G., Giunta, A., Madjarska, M. S., et al. 2013, A&A, 557, L9
- Doyle et al. (2006) Doyle, J. G., Popescu, M. D., & Taroyan, Y. 2006, A&A, 446, 327
- Dudík et al. (2014) Dudík, J., Del Zanna, G., Dzifčáková, E., Mason, H. E., & Golub, L. 2014, ApJ, 780, L12
- Ellerman (1917) Ellerman, F. 1917, ApJ, 46, 298
- Grevesse & Sauval (1998) Grevesse, N., & Sauval, A. J. 1998, Space Sci. Rev., 85, 161
- Hannah & Kontar (2012) Hannah, I. G., & Kontar, E. P. 2012, A&A, 539, A146
- Huang et al. (2014) Huang, Z., Madjarska, M. S., Xia, L., et al. 2014, ApJ, 797, 88
- Innes et al. (1997a) Innes, D. E., Brekke, P., Germerott, D., & Wilhelm, K. 1997a, Sol. Phys., 175, 341
- Innes et al. (1997b) Innes, D. E., Inhester, B., Axford, W. I., & Wilhelm, K. 1997b, Nature, 386, 811
- Isobe et al. (2007) Isobe, H., Tripathi, D., & Archontis, V. 2007, ApJ, 657, L53
- Landi et al. (2012) Landi, E., Del Zanna, G., Young, P. R., Dere, K. P., & Mason, H. E. 2012, ApJ, 744, 99
- Lemen et al. (2012) Lemen, J. R., Title, A. M., Akin, D. J., et al. 2012, Sol. Phys., 275, 17
- Martínez-Sykora et al. (2015) Martínez-Sykora, J., Rouppe van der Voort, L., Carlsson, M., et al. 2015, ApJ, 803, 44
- Muglach (2008) Muglach, K. 2008, ApJ, 687, 1398
- Ning et al. (2004) Ning, Z., Innes, D. E., & Solanki, S. K. 2004, A&A, 419, 1141
- Pant et al. (2015) Pant, V., Datta, A., & Banerjee, D. 2015, ArXiv e-prints, arXiv:1501.06507
- Pariat et al. (2004) Pariat, E., Aulanier, G., Schmieder, B., et al. 2004, ApJ, 614, 1099
- Peter et al. (2014) Peter, H., Tian, H., Curdt, W., et al. 2014, Science, 346, C315
- Schmit et al. (2014) Schmit, D. J., Innes, D., Ayres, T., et al. 2014, A&A, 569, L7
- Schou et al. (2012) Schou, J., Scherrer, P. H., Bush, R. I., et al. 2012, Sol. Phys., 275, 229
- Torrence & Compo (1998) Torrence, C., & Compo, G. P. 1998, Bull. Am. Meteorol. Soc., 79, 61
- Wilhelm et al. (1995) Wilhelm, K., Curdt, W., Marsch, E., et al. 1995, Sol. Phys., 162, 189
- Yan et al. (2015) Yan, L., Peter, H., He, J., et al. 2015, ArXiv e-prints, arXiv:1501.05706