Study of the stellar population properties in the discs of ten spiral galaxies
Abstract
We investigated the properties of the stellar populations in the discs of a sample of ten spiral galaxies. Our analysis focused on the galaxy region where the disc contributes more than 95 per cent of total surface brightness in order to minimise the contamination of the bulge and bar.
The luminosity-weighted age and metallicity were obtained by fitting the galaxy spectra with a linear combination of stellar population synthesis models, while the total overabundance of -elements over iron was derived by measuring the line-strength indices.
Most of the sample discs display a bimodal age distribution and they are characterised by a total [] enhancement ranging from solar and supersolar. We interpreted the age bimodality as due to the simultaneous presence of both a young (Age Gyr) and an old (Age4 Gyr) stellar population. The old stellar component usually dominates the disc surface brightness and its light contribution is almost constant within the observed radial range. For this reason, no age gradient is observed in half of the sample galaxies. The old component is slightly more metal poor than the young one. The metallicity gradient is negative and slightly positive in the old and young components, respectively.
These results are in agreement with an inside-out scenario of disc formation and suggest a reduced impact of the radial migration on the stellar populations of the disc. The young component could be the result of a second burst of star formation in gas captured from the environment.
keywords:
galaxies: abundances – galaxies: evolution – galaxies: formation – galaxies: kinematics and dynamics – galaxies: spirals – galaxies: stellar content1 Introduction
Studying the properties of the stellar populations of galaxies is essential to give a comprehensive picture of their formation and evolution. Indeed, all the processes driving the assembly history of galaxies leave a fingerprint in the radial profiles of the luminosity weighted age, metallicity, and [] enhancement of the stellar component. Thus, the observed properties of the stellar populations can be used against the predictions of theoretical models and numerical simulations.
Many studies focus on the colours of galaxies and their structural components. The mean colours of the stellar populations change smoothly from red to blue along the Hubble sequence. Moreover, the galactic discs tend to be bluer than spheroids, with them being either elliptical galaxies or bulges of lenticular and spiral galaxies (de Jong, 1996; Taylor et al., 2005; Driver et al., 2006). However, photometric data alone is not enough to distinguish whether these systematic differences are an effect of age or metallicity then making impossible to drive conclusive results about the stellar populations in galaxies beyond the Local Group (Worthey, 1994).
| Galaxy | Type | Source | ||||||||
|---|---|---|---|---|---|---|---|---|---|---|
| (arcmin) | (mag) | () | (Mpc) | (mag) | (arcsec) | () | ||||
| (1) | (2) | (3) | (4) | (5) | (6) | (7) | (8) | (9) | (10) | (11) |
| ESO-LV 1890070 | SABb | 12.31 | 2981 | 37.5 | 31.1 | 91 | 2,4 | |||
| ESO-LV 2060140 | SABc | 14.89 | 4672 | 60.5 | 17.8 | 54.3 | 3 | |||
| ESO-LV 4000370 | SBc | 14.47 | 2876 | 37.5 | 22.4 | 42.0 | 3 | |||
| ESO-LV 4500200 | SBbc | 13.03 | 2118 | 31.6 | 17.3 | 112 | 2,4 | |||
| ESO-LV 5140100 | SABc | 12.88 | 2888 | 40.4 | 27.1 | 60 | 2,4 | |||
| ESO-LV 5480440 | S0/a | 14.26 | 1696 | 22.6 | 10.1 | 63.8 | 1 | |||
| IC 1993 | SABb | 12.52 | 1065 | 17.0 | 21.9 | 182.8 | 1 | |||
| NGC 1366 | S0 | 12.80 | 1308 | 17.0 | 12.9 | 175.8 | 1 | |||
| NGC 7643 | Sab | 14.12 | 3837 | 50.2 | 11.1 | 116.9 | 1 | |||
| PGC 37759 | Sc | 15.89 | 14495 | 193.2 | 7.20 | 64.4 | 3 |
Spectroscopic data allow us to highly reduce the age-metallicity degeneracy by studying the absorption features which are connected to the properties of the stellar populations. Coupling the measurements of both the line-strength indices of the Lick system (Faber et al., 1985) and other systems with higher spectral resolution (Johansson et al., 2010; Vazdekis et al., 2010) with the predictions of single stellar population (SSPs) models (Thomas et al., 2003, 2011; Vazdekis et al., 2010) is the most widely used method to derive the age, metallicity, and [] enhancement of unresolved stellar populations in galaxies. However, most of targets are elliptical galaxies (Mehlert et al., 2003; Sánchez-Blázquez et al., 2006; Annibali et al., 2007) and bulges of disc galaxies (Moorthy & Holtzman, 2006; Jablonka et al., 2007; Morelli et al., 2008; Morelli et al., 2012; Seidel et al., 2015) for which the assumption of SSP is a good approximation. To date, only a few papers focused on the stellar populations of galactic discs have been published because of their low surface brightness and the presence of intense nebular emission lines which make the spectroscopic analysis quite difficult. In addition, the discs of galaxies are a reservoir of molecular gas (Davis et al., 2012) feeding more than one single episode of star formation. Therefore, the SSP approach can not be used in discs and multiple stellar populations are required to correctly recover the star formation history and the stellar population properties in galaxy discs (Morelli et al., 2013; González Delgado et al., 2014; McDermid et al., 2015).
Yoachim & Dalcanton (2008) and MacArthur et al. (2009) detected the presence of an old stellar population (8-10 Gyrs) in the disc-dominated region of 9 edge-on and 8 low inclined spirals, respectively. This result was confirmed by Sánchez-Blázquez et al. (2011) and Sánchez-Blázquez et al. (2014) who studied 62 nearly face-on spirals without finding any significant difference between the discs of unbarred and barred galaxies. Discs are characterised by a large spread in metallicity spanning values between []=0 and []=-0.2 (Yoachim & Dalcanton, 2008). The age and metallicity radial profiles derived by MacArthur et al. (2009), Sánchez-Blázquez et al. (2011), and Sánchez-Blázquez et al. (2014) display shallow or negative metallicity gradients. The [] enhancement was only measured by Yoachim & Dalcanton (2008). They found that the stars of both the thick and thin disc have a solar abundance ratio.
Tracing the radial profiles of the age, metallicity, and [] enhancement in the discs in several nearby galaxies will allow to extract statistically significant conclusions and perform a comparison with the Milky Way (Freeman & Bland-Hawthorn, 2002; Yong et al., 2006), and the other disc galaxies of the Local Group, (Worthey et al., 2005; Davidge, 2007; Cioni, 2009; Gogarten et al., 2010), in order to understand the mechanisms driving the disc formation.
Galactic discs are believed to form immediately after a major merging of gas dominated systems (Robertson et al., 2006), through an inside-out process with the inner parts forming first due to their lower angular momentum and the outer parts with higher angular momentum forming later (Brook et al., 2004; Muñoz-Mateos et al., 2007). The inside-out scenario was confirmed by Trujillo & Pohlen (2005) studying the disc truncations at high . Within this framework, age and metallicity gradients are expected to be measured across galactic discs with the older (Matteucci & Francois, 1989; Boissier & Prantzos, 1999) and more metal rich stars (Muñoz-Mateos et al., 2007; Roškar et al., 2008; Prochaska Chamberlain et al., 2011) confined in the inner regions. Nevertheless, this prediction is correct under the assumption that stars remain in the same region of the disc where they formed. Recently it has been shown the possibility that the stellar orbits change in time and stars might move inward or outward across the disc. This effect is referred as stellar migration and it has been investigated both with a theoretical approach (Jenkins & Binney, 1990; Sellwood & Binney, 2002) and using numerical simulations (Roškar et al., 2008; Di Matteo et al., 2013; Kubryk et al., 2013; Minchev et al., 2014). The process of radial migration is expected to mix the stellar populations and flatten the metallicity gradient with time.
The paucity of data to address such a relevant topic makes worthwhile any effort to measure the properties of the stellar populations in galactic discs. Therefore, we decided to study the stellar populations in the discs of a sample of 10 spiral galaxies for which the structural and kinematical properties of the bulge and disc were already known (Morelli et al., 2008; Pizzella et al., 2008; Morelli et al., 2012; Morelli et al., 2015). The paper is organized as follows. We present the sample of galaxies in §2 and investigate the properties of the stellar populations of their discs in §3. Finally, we discuss our conclusions in §4.
2 Sample selection
The sample comprises 10 disc galaxies with morphological types ranging from S0 to Sc whose properties, including size, magnitude, and distance, are listed in Table 1. The galaxies belong to the sample of nearby lenticulars and spirals studied by Pizzella et al. (2008) and Morelli et al. (2008); Morelli et al. (2012); Morelli et al. (2015) who measured the surface-brightness distribution from broad-band photometry and the stellar and ionized-gas kinematics from long-slit spectra. We refer to these aforementioned papers for the details about the selection criteria, photometric decomposition, and measurements of the stellar kinematics and Lick indices of the sample galaxies.
The properties of the stellar populations of the bulges of the sample galaxies were already investigated (Morelli et al., 2008; Morelli et al., 2012; Morelli et al., 2015), and here we extend the analysis deriving the stellar populations in the discs.
3 Stellar populations of the discs
Measuring the stellar populations of the different galaxy components from integrated spectra suffers from contamination. The properties inferred for one component are indeed affected by those of the others depending on their relative contribution to the galaxy surface brightness. This issue is critical for bulges and bars, which are always embedded in discs and overlap one to each other at small radii, nonetheless it can be easily overcome for discs which dominate the surface brightness distribution at large radii.
Since we were interested in investigating the stellar populations of the disc component, we focused our analysis on the disc-dominated region between , which is the radius where the disc contributes more than of the galaxy surface brightness, and , which is the farthest radius where the signal-to-noise ratio is sufficient to measure the properties of the stellar populations in the available spectra ( per resolution element).
For each galaxy, we adopted the photometric decomposition performed by Pizzella et al. (2008) and Morelli et al. (2008); Morelli et al. (2012); Morelli et al. (2015) to define . The structural parameters of the galaxies were derived with Galaxy Surface Photometry Two-Dimensional Decomposition (GASP2D, Méndez-Abreu et al., 2008) by assuming the observed surface-brightness distribution to be the sum of a Sérsic bulge, an exponential disc, and, if necessary, a Ferrers bar (Méndez-Abreu et al., 2014). The values of and for all the sample galaxies are listed in Table 2.
3.1 Age and metallicity
The age and metallicity of the galactic components are crucial in reconstructing the assembly history of galaxies, since the past events of merging and star formation are imprinted in the stellar populations.
3.1.1 Fitting synthetic population models
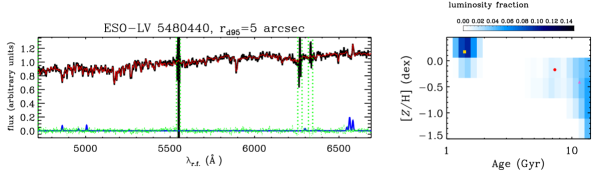
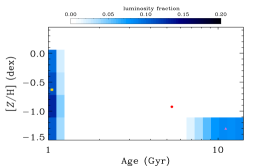
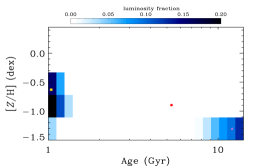
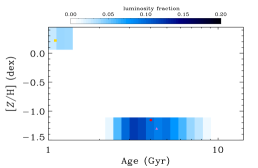
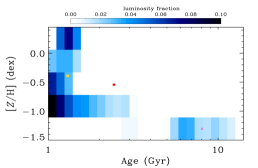
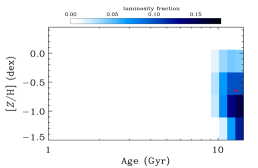
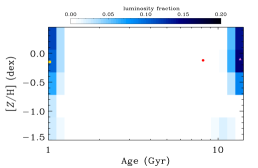
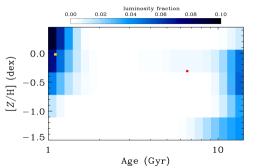
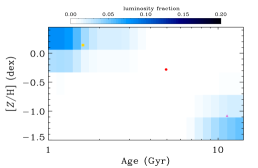
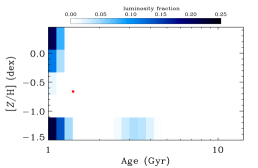
We analysed the galaxy spectra of Pizzella et al. (2008) and Morelli et al. (2008); Morelli et al. (2012); Morelli et al. (2015) to derive at and the relative contribution of the stellar populations with different age and metallicity to the observed surface-brightness distribution. As done by Onodera et al. (2012) and Morelli et al. (2013), we applied the Penalized Pixel Fitting code (pPXF, Cappellari & Emsellem, 2004), including the Gas and Absorption Line Fitting algorithm (GANDALF, Sarzi et al., 2006) and a linear regularization of the weights (Press et al., 1992), which were adjusted for the sample spectra to deal with emission lines and derive both the distribution of the luminosity fraction in different age and metallicity bins, respectively.
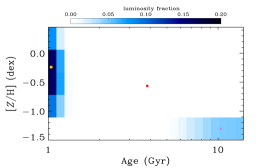
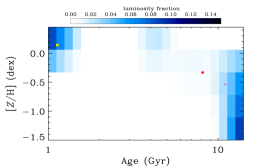
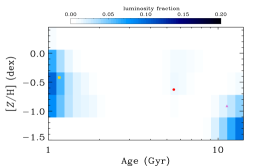
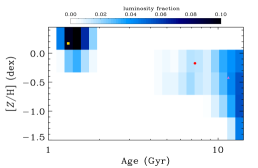
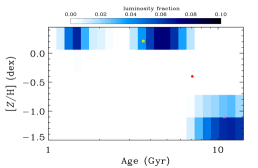
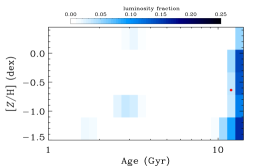
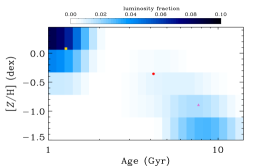
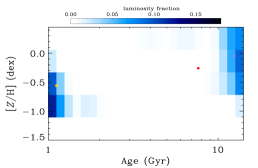
We adopted 115 synthetic population models with Salpeter initial mass function (Salpeter, 1955), age from 1 to 15 Gyr, and metallicity [] from to dex. They were built from the stellar spectra available in the Medium Resolution Isaac Netwon Telescope Library of Empirical Spectra (MILES, Sánchez-Blázquez et al., 2006) with a spectral resolution of Å (Beifiori et al., 2011). The spectral resolution of the galaxy spectra was degraded to match that of the synthetic population models. Then they were convolved with the line-of-sight velocity distribution (LOSVD) obtained from the available stellar kinematics and fitted to the galaxy spectrum using a minimisation in pixel space. We simultaneously fitted the galaxy spectra using emission lines in addition to the synthetic population models. Only emission lines detected with a were taken into account. To make the fit result more sensitive to the absorption lines of the galaxy spectrum than to its continuum shape, we adopted a low order multiplicative Legendre polynomial to account for both reddening and possible artifacts due to the flat fielding or or flux calibration. Finally, we derived the stellar light fraction within each bin of age and metallicity from the best-fitting synthetic population models.
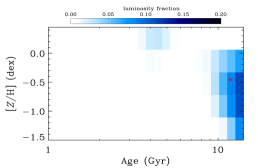
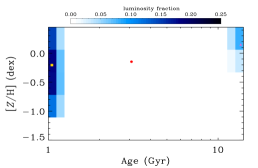
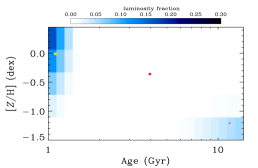
An example of the fitting procedure is shown in Fig. 1 for the spectrum at of ESO-LV 5480440. The age, metallicity, and light fraction of the stellar populations at and of all the sample galaxies are plotted in Fig. 2.
ESO-LV 1890070
ESO-LV 2060140
ESO-LV 4000370
ESO-LV 4500200
ESO-LV 5140100
ESO-LV 5480440
IC 1993
NGC 1366
NGC 7643
PGC 37759
3.1.2 Luminosity-weighted age and metallicity
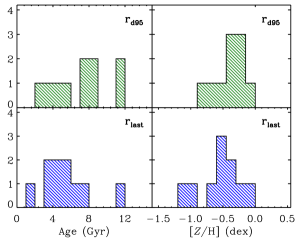
For all the sample galaxies we calculated the luminosity-weighted age and metallicity of the stellar population of their discs at and . The uncertainties for ages and metallicities were estimated by Monte Carlo simulations. For each galaxy, we built 100 simulated spectra by adding to the best-fitting synthetic population model a noise spectrum with the same standard deviation of the difference between the observed and model spectrum. The simulated spectra were measured as if they were real. The standard deviations of the distributions of the simulated ages and metallicities were adopted as errors on the measured age and metallicity, respectively. The values are listed in Table 2 and their number distributions are plotted in Fig. 3.
No significant difference was found between the distributions of the luminosity-weighted ages at and , both of them spanning a large range ( Gyr). On the contrary, the distribution of the luminosity-weighted metallicity at is characterised by lower values and it peaks at dex, while the luminosity-weighted metallicities at are slightly shifted to higher values with a peak at dex.
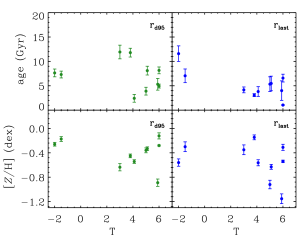
The bulge-to-disc ratio is one of the key ingredients for the morphological classification of galaxies. Our sample covers the Hubble sequence from S0s to Sc spirals, but there is no evidence for a clear cut correlation between the galaxy type and stellar population properties of the disc-dominated region (Fig. 4).
| Galaxy | |||||||||
| (arcsec) | (arcsec) | (Gyr) | (dex) | (Gyr) | (dex) | (Gyr) | (dex) | ||
| (1) | (2) | (3) | (4) | (5) | (6) | (7) | (8) | (9) | (10) |
| ESO-LV 1890070 | 1.52 | ||||||||
| ESO-LV 2060140 | 1.57 | ||||||||
| ESO-LV 4000370 | 0.80 | ||||||||
| ESO-LV 4500200 | 2.13 | ||||||||
| ESO-LV 5140100 | 1.91 | ||||||||
| ESO-LV 5480440 | 1.63 | ||||||||
| IC 1993 | 0.93 | ||||||||
| NGC 1366 | 1.06 | ||||||||
| NGC 7643 | 1.02 | ||||||||
| PGC 37759 | 1.34 | ||||||||
We calculated the gradients of the luminosity-weighted age and metallicity over the disc scalelength from the values measured at and . The gradients and corresponding errors are given in Table 2 and their number distributions are plotted in Fig. 5.
The age gradient is negligible within the errors in most of the discs. ESO-LV 1890070, IC 1993, and PGC 377759 display a negative gradient, whereas NGC 1366 has a remarkably strong positive gradient. The metallicity gradient of all the discs is negative or null, except ESO-LV 1890070 and IC 1993. This is expected if the disc components assembled through an inside-out or outside-in process (Brook et al., 2004; Muñoz-Mateos et al., 2007). The distribution of the age and metallicity gradients is consistent with that of the unbarred disc galaxies studied by Sánchez-Blázquez et al. (2014) once their gradients are rescaled to the disc scalelength.
We note that the age and metallicity gradients do not show any trend with the galaxy morphological type (Fig. 6) or central velocity dispersion (Fig. 7) supporting earlier findings of Sánchez-Blázquez et al. (2014). However, the wide range of masses of the sample galaxies could, in principle, blur the effect of the morphological type on the correlations with the stellar population properties. For this reason, these results need to be tested with a larger sample of galaxies where the effects of the morphology could be tested for galaxies in a similar mass range.


3.1.3 Young and old stellar populations
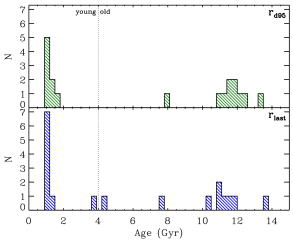
The age distribution obtained by fitting the observed spectra with synthetic population models is bimodal in most of the sample galaxies. Some galaxies are also characterised by a bimodal metallicity distribution (Fig. 2).
We interpreted such a bimodality being due to the presence of two stellar populations with a different age. In this paper we assumed the young stellar population having Gyr and the old one to have Gyr. We derived their luminosity-weighted age and metallicity at and . The errors on age and metallicity were obtained from photon statistics and CCD readout noise, and they were calibrated through a series of Monte Carlo simulations. The values are plotted in Fig. 2 and listed in Table 3.
The number distributions of the luminosity-weighted age and metallicity of the two stellar populations are shown in Fig. 8 and 9, respectively. The old component covers a large range of metallicities ( dex) at both and , whereas the metallicity range of the young stellar population is slightly smaller and shifted towards positive values ( dex).
| Galaxy | ||||||||||
|---|---|---|---|---|---|---|---|---|---|---|
| (Gyr) | (Gyr) | (dex) | (dex) | (Gyr) | (Gyr) | (dex) | (dex) | |||
| (1) | (2) | (3) | (4) | (5) | (6) | (7) | (8) | (9) | (10) | (11) |
| ESO-LV 1890070 | 1.00 | |||||||||
| ESO-LV 2060140 | 0.29 | |||||||||
| ESO-LV 4000370 | 0.38 | |||||||||
| ESO-LV 4500200 | 0.16 | |||||||||
| ESO-LV 5140100 | 0.70 | |||||||||
| ESO-LV 5480440 | 0.58 | |||||||||
| IC 1993 | 1.00 | |||||||||
| NGC 1366 | 0.56 | |||||||||
| NGC 7643 | 0.57 | |||||||||
| PGC 37759 | 0.34 | |||||||||
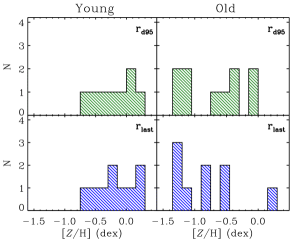
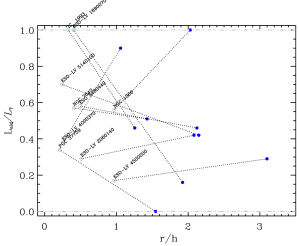
The fraction of total luminosity contributed by the old stellar population at and is given in Table 3 and plotted in Fig. 10. The galaxy luminosity in the disc-dominated region of about half of the sample galaxies is mostly contributed by the old stellar population. Its luminosity fraction is almost constant within the radial range between and in ESO-LV 2060140, ESO-LV 4500200, ESO-LV 5140100, ESO-LV 5480440, and NGC 7643, whereas it displays a significant change in the remaining galaxies. The fraction of old stars strongly decreases in the outer regions of the disc of ESO-LV 1890070, IC 1993, and PGC 37759 and sharply increases in ESO-LV 400037 and NGC 1366. Therefore no age gradient is observed in the discs of half of the sample galaxies.
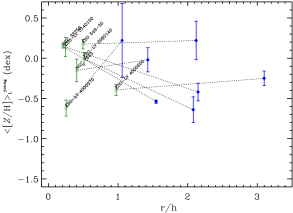
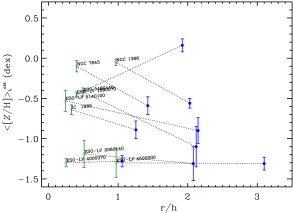
The luminosity-weighted metallicity measured at and for the young and old stellar populations are plotted in Fig. 11.
The metallicity gradients over the disc scalelength were derived separately for the young and old stellar populations. They are listed in Table 4 and their number distributions are shown in Fig. 12.
The distribution of the metallicity gradients of the old stellar population is similar to that of the mean stellar population with a prevalence towards negative gradients ( dex) indicating that the inner disc regions are more metal rich than the outer ones. For the young stellar population we found that about half of the galaxies have slightly positive gradients ( dex). These results are consistent with those found by Sánchez-Blázquez et al. (2014) for the old and young stellar components of the discs of their galaxies when rescaled to the disc effective radius.
| Galaxy | ||
|---|---|---|
| (dex) | (dex) | |
| (1) | (2) | (3) |
| ESO-LV 1890070 | ||
| ESO-LV 2060140 | ||
| ESO-LV 4000370 | ||
| ESO-LV 4500200 | ||
| ESO-LV 5140100 | ||
| ESO-LV 5480440 | ||
| IC 1993 | ||
| NGC 1366 | ||
| NGC 7643 | ||
| PGC 37759 |

3.2 Overabundance of -elements
The overabundance of the -elements over iron is important to understand the processes driving the formation and evolution of the galaxies. Indeed it is a proxy of the delay between the supernovae type II and type I and it gives indication of the timescale of the last major burst of star formation. We derived the [] enhancement by comparing the measurements of line-strength indices with the predictions of SSP models.
3.2.1 Measuring the line-strength indices
Pizzella et al. (2008) and Morelli et al. (2008); Morelli et al. (2012); Morelli et al. (2015) measured the radial profiles of the Lick , Mg, and Fe line-strength indices out to from the centre for all the sample galaxies. The values of the line-strength index were corrected for the possible contamination of the emission line due to the ionized-gas component (see Morelli et al., 2012, for details).
We derived the line-strength indices at and by linearly interpolating the measured line-strength indices along the radius. The resulting values and their corresponding errors are reported in Table LABEL:tab:indices.
| Galaxy | []′ | Mg 2 | Mg b | []′ | Mg 2 | Mg b | ||||
|---|---|---|---|---|---|---|---|---|---|---|
| (Å) | (Å) | (mag) | (Å) | (Å) | (Å) | (Å) | (mag) | (Å) | (Å) | |
| (1) | (2) | (3) | (4) | (5) | (6) | (7) | (8) | (9) | (10) | (11) |
| ESO-LV 1890070 | ||||||||||
| ESO-LV 2060140 | ||||||||||
| ESO-LV 4000370 | ||||||||||
| ESO-LV 4500200 | ||||||||||
| ESO-LV 5140100 | ||||||||||
| ESO-LV 5480440 | ||||||||||
| IC 1993 | ||||||||||
| NGC 1366 | ||||||||||
| NGC 7643 | ||||||||||
| PGC 37759 | ||||||||||
3.2.2 Total [Fe] enhancement
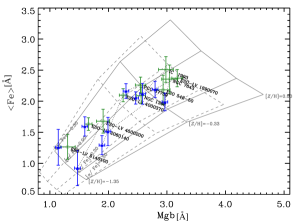
In Fig. 13 the values of Mg b and derived at and for each sample galaxy are compared with the model predictions by Thomas et al. (2003) for two stellar populations with an intermediate (2 Gyr) and old age (12 Gyr), respectively.
The total Fe enhancement of the disc stellar population at and was derived from the values of line-strength indices of Table LABEL:tab:indices, using a linear interpolation between the model points with the iterative procedure described in Morelli et al. (2008) and adopting the age given in Table 2. The uncertainties on the Fe enhancements were estimated by Monte Carlo simulations as done in Morelli et al. (2008); Morelli et al. (2015). We randomly generated 100 simulated sets of line-strength indices from the measured indices and their errors assuming Gaussian distributions. The standard deviations of the distributions of simulated Fe enhancements were adopted as the errors on their measured values, which are reported in Table 2. The histograms of the number distribution of the [] enhancement at and are plotted in Fig. 14. Most of the galaxies display a solar and super-solar [] enhancement in the inner and outer regions of the disc, respectively.
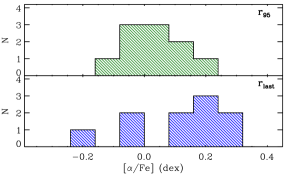
The difference in the distributions of total [] enhancement measured at and suggests the presence of a radial gradient in the stellar populations properties of some of the galaxies, as also shown by the trends of Fig. 13. The gradients of total [] enhancement over the disc scalelength were derived for all the sample galaxies from the values measured at and . The errors on the gradients were calculated through Monte Carlo simulations as done in Morelli et al. (2012). The gradients and corresponding errors are listed in Table 6 and their number distribution is shown in Fig. 15. Only the discs of ESO-LV 5140100 and IC 1993 are characterised by a shallow positive gradient of [] enhancement, whereas the discs of all the other galaxies show a [] gradient consistent with zero within the errors. It is worth noticing that all the [] gradients are systematically positive with a weighted mean value of dex.
| Galaxy | [] | [] | [] |
|---|---|---|---|
| (dex) | (dex) | (dex) | |
| (1) | (2) | (3) | (4) |
| ESO-LV 1890070 | |||
| ESO-LV 2060140 | |||
| ESO-LV 4000370 | |||
| ESO-LV 4500200 | |||
| ESO-LV 5140100 | |||
| ESO-LV 5480440 | |||
| IC 1993 | |||
| NGC 1366 | |||
| NGC 7643 | |||
| PGC 37759 |

4 Conclusions
We derived the stellar population properties in the discs of 10 spiral galaxies to investigate their assembly history by testing the predictions of theoretical models and numerical simulations. To this aim we analysed the galaxy spectra obtained in the radial range between and , which are the radii where the disc contributes more than of the galaxy surface brightness and the farthest measured radius, respectively. On average such a radial range extends out to times the disc scalelength and it is wide.
The luminosity-weighted age and luminosity-weighted metallicity of the stellar populations were measured at and by fitting the galaxy spectra with a linear combination of stellar population synthesis models.
The disc stellar population of the sample galaxies has a flat distribution of ranging from Gyr to Gyr at both and , however we note that at only one galaxy has an age greater than Gyr while at they are four. The luminosity-weighted metallicities span a wide range of values from solar to sub-solar ( dex) but the number distribution at is slightly shifted towards lower metallicities and the peak moves from dex at at about dex at . The disc stellar populations of the majority of the sample galaxies are characterised by a negligible gradient over the disc scalelength and negative gradient, giving observational support to the inside-out formation scenario (Matteucci & Francois, 1989; Roškar et al., 2008). No correlation was found between the galaxy morphological type and either or and between the morphological type and gradients of and . Even though the small number statistics does not allow us to trace a firm conclusion, this might suggest that the star formation in discs is not strongly connected with the galaxy type, as already pointed out for bulges. Indeed Thomas & Davies (2006) and Morelli et al. (2012) found that the evolution of bulges and discs do not have a strong interplay and they follow independent paths of star formation.
Most of the discs display a bimodal age distribution hosting a young ( Gyr) and an old ( Gyr) stellar population, for which we derived the value and gradient of both the luminosity-weighted age and metallicity. The old stellar component usually dominates the disc luminosity and it is slightly more metal poor than the young stellar component. The luminosity fraction of the old stellar component is almost constant within the observed radial range in half of the sample galaxies and therefore no age gradient is observed in their discs. The old and young stellar populations are characterised by negative ( dex) and slightly positive ( dex) gradients of metallicity, respectively. This is in agreement with the findings by Sánchez-Blázquez et al. (2014) when rescaled to the disc effective radius. These results suggest that the discs formed out with a shallow gradient of age and metallicity, and this is consistent with the predictions of the inside-out assembly scenario (Pilkington et al., 2012). The young stellar population could be the result of a second burst of star formation due to the acquisition of gas from the environment. This give rise to the homogeneously-mixed stellar population we observe all over the disc. On the other hand, it is hard to explain the metallicity gradients of the old stellar populations in the framework of radial migration, which is expected to erase the gradients of the stellar population properties by moving stars from the inner to the outer regions of the disc (Roškar et al., 2008). These results suggest a reduced impact of radial migration on the stellar populations properties.
The overabundance of the -elements over iron were derived at and by comparing the measurements of line-strength indices with the predictions of SSP models.
The gradients of total [] enhancement calculated over the disc scalelength are systematically positive ( dex). This is a hint that the star-formation timescale is shorter in the outer regions of discs. This result is promising but it should be tested against a larger sample of galaxy discs and when the new -enhanced synthetic population models (Vazdekis et al., 2015) will be released.
Acknowledgments
This investigation was based on observations made with ESO Telescopes at the La Silla Paranal Observatory under programmes 76.B-0375, and 80.B-00754. This work was supported by Padua University through grants 60A02-4807/12, 60A02-5857/13, 60A02-5833/14 and CPDA133894. LM acknowledges financial support from Padua University grant CPS0204. JMA acknowledges support from the European Research Council Starting Grant (SEDmorph, P.I. V. Wild)
References
- Annibali et al. (2007) Annibali F., Bressan A., Rampazzo R., Zeilinger W. W., Danese L., 2007, A&A, 463, 455
- Barden et al. (2005) Barden M., Rix H.-W., Somerville R. S., Bell E. F., Häußler B., Peng C. Y., Borch A., Beckwith S. V. W., Caldwell J. A. R., Heymans C., Jahnke K., Jogee S., McIntosh D. H., Meisenheimer K., Sánchez S. F., Wisotzki L., Wolf C., 2005, ApJ, 635, 959
- Beifiori et al. (2011) Beifiori A., Maraston C., Thomas D., Johansson J., 2011, A&A, 531, A109
- Boissier & Prantzos (1999) Boissier S., Prantzos N., 1999, MNRAS, 307, 857
- Brook et al. (2004) Brook C. B., Kawata D., Gibson B. K., Freeman K. C., 2004, ApJ, 612, 894
- Cappellari & Emsellem (2004) Cappellari M., Emsellem E., 2004, PASP, 116, 138
- Cioni (2009) Cioni M.-R. L., 2009, A&A, 506, 1137
- Davidge (2007) Davidge T. J., 2007, ApJ, 664, 820
- Davis et al. (2012) Davis, T. A., Krajnović, D., McDermid, R. M., et al. 2012, MNRAS, 426, 1574
- Driver et al. (2006) Driver, S. P., Allen, P. D., Graham, A. W., et al. 2006, MNRAS, 368, 414
- McDermid et al. (2015) McDermid, R. M., Alatalo, K., Blitz, L., et al. 2015, MNRAS, 448, 3484
- de Jong (1996) de Jong R. S., 1996, A&A, 313, 377
- Di Matteo et al. (2013) Di Matteo P., Haywood M., Combes F., Semelin B., Snaith O. N., 2013, A&A, 553, A102
- Faber et al. (1985) Faber S. M., Friel E. D., Burstein D., Gaskell C. M., 1985, ApJS, 57, 711
- Freeman & Bland-Hawthorn (2002) Freeman K., Bland-Hawthorn J., 2002, ARA&A, 40, 487
- Goetz & Koeppen (1992) Goetz M., Koeppen J., 1992, A&A, 262, 455
- Gogarten et al. (2010) Gogarten S. M., Dalcanton J. J., Williams B. F., Roškar R., Holtzman J., Seth A. C., Dolphin A., Weisz D., Cole A., Debattista V. P., Gilbert K. M., Olsen K., Skillman E., de Jong R. S., Karachentsev I. D., Quinn T. R., 2010, ApJ, 712, 858
- González Delgado et al. (2014) González Delgado R. M., Pérez E., Cid Fernandes R., et al ., 2014, A&A, 562, A47
- Jablonka et al. (2007) Jablonka, P., Gorgas, J., & Goudfrooij, P. 2007, A&A, 474, 763
- Jenkins & Binney (1990) Jenkins A., Binney J., 1990, MNRAS, 245, 305
- Johansson et al. (2010) Johansson J., Thomas D., Maraston C., 2010, MNRAS, 406, 165
- Kubryk et al. (2013) Kubryk M., Prantzos N., Athanassoula E., 2013, MNRAS, 436, 1479
- MacArthur et al. (2009) MacArthur L. A., González J. J., Courteau S., 2009, MNRAS, 395, 28
- Matteucci & Francois (1989) Matteucci F., Francois P., 1989, MNRAS, 239, 885
- Mehlert et al. (2003) Mehlert D., Thomas D., Saglia R. P., Bender R., Wegner G., 2003, A&A, 407, 423
- Méndez-Abreu et al. (2008) Méndez-Abreu J., Aguerri J. A. L., Corsini E. M., Simonneau E., 2008, A&A, 478, 353
- Méndez-Abreu et al. (2014) Méndez-Abreu, J., Debattista, V. P., Corsini, E. M., & Aguerri, J. A. L. 2014, A&A, 572, A25
- Minchev et al. (2014) Minchev I., Chiappini C., Martig M., 2014, A&A, 572, A92
- Moorthy & Holtzman (2006) Moorthy B. K., Holtzman J. A., 2006, MNRAS, 371, 583
- Morelli et al. (2013) Morelli L., Calvi V., Masetti N., Parisi P., Landi R., Maiorano E., Minniti D., Galaz G., 2013, A&A, 556, A135
- Morelli et al. (2012) Morelli L., Corsini E. M., Pizzella A., Dalla Bontà E., Coccato L., Méndez-Abreu J., Cesetti M., 2012, MNRAS, 423, 962
- Morelli et al. (2015) Morelli, L., Pizzella, A., Corsini, E. M., et al. 2015, Astronomische Nachrichten, 336, 208
- Morelli et al. (2008) Morelli L., Pompei E., Pizzella A., Méndez-Abreu J., Corsini E. M., Coccato L., Saglia R. P., Sarzi M., Bertola F., 2008, MNRAS, 389, 341
- Muñoz-Mateos et al. (2007) Muñoz-Mateos J. C., Gil de Paz A., Boissier S., Zamorano J., Jarrett T., Gallego J., Madore B. F., 2007, ApJ, 658, 1006
- Onodera et al. (2012) Onodera, M., Renzini, A., Carollo, M., et al. 2012, ApJ, 755, 26
- Pilkington et al. (2012) Pilkington, K., Few, C. G., Gibson, B. K., et al. 2012, A&A, 540, A56
- Pizzella et al. (2008) Pizzella A., Corsini E. M., Sarzi M., Magorrian J., Méndez-Abreu J., Coccato L., Morelli L., Bertola F., 2008, MNRAS, 387, 1099
- Press et al. (1992) Press, W. H., Teukolsky, S. A., Vetterling, W. T., & Flannery, B. P. 1992, Cambridge: University Press, —c1992, 2nd ed.,
- Prochaska Chamberlain et al. (2011) Prochaska Chamberlain L. C., Courteau S., McDonald M., Rose J. A., 2011, MNRAS, 412, 423
- Robertson et al. (2006) Robertson B., Bullock J. S., Cox T. J., Di Matteo T., Hernquist L., Springel V., Yoshida N., 2006, ApJ, 645, 986
- Roškar et al. (2008) Roškar R., Debattista V. P., Quinn T. R., Stinson G. S., Wadsley J., 2008, ApJL, 684, L79
- Salpeter (1955) Salpeter E. E., 1955, ApJ, 121, 161
- Sánchez-Blázquez et al. (2006) Sánchez-Blázquez P., Gorgas J., Cardiel N., González J. J., 2006, A&A, 457, 809
- Sánchez-Blázquez et al. (2011) Sánchez-Blázquez P., Ocvirk P., Gibson B. K., Pérez I., Peletier R. F., 2011, MNRAS, 415, 709
- Sánchez-Blázquez et al. (2006) Sánchez-Blázquez P., Peletier R. F., Jiménez-Vicente J., Cardiel N., Cenarro A. J., Falcón-Barroso J., Gorgas J., Selam S., Vazdekis A., 2006, MNRAS, 371, 703
- Sánchez-Blázquez et al. (2014) Sánchez-Blázquez P., Rosales-Ortega F. F., Méndez-Abreu J., Pérez I., Sánchez S. F., Zibetti S., Aguerri J. A. L., Bland-Hawthorn J., Catalán-Torrecilla C., Cid Fernandes R., 2014, A&A, 570, A6
- Sarzi et al. (2006) Sarzi M., Falcón-Barroso J., Davies R. L., Bacon R., Bureau M., Cappellari M., de Zeeuw P. T., Emsellem E., Fathi K., Krajnović D., Kuntschner H., McDermid R. M., Peletier R. F., 2006, MNRAS, 366, 1151
- Sellwood & Binney (2002) Sellwood J. A., Binney J. J., 2002, MNRAS, 336, 785
- Taylor et al. (2005) Taylor V. A., Jansen R. A., Windhorst R. A., Odewahn S. C., Hibbard J. E., 2005, ApJ, 630, 784
- Thomas et al. (2005) Thomas, D., Maraston, C., Bender, R., & Mendes de Oliveira, C. 2005, ApJ, 621, 673
- Thomas & Davies (2006) Thomas D., Davies R. L., 2006, MNRAS, 366, 510
- Thomas et al. (2003) Thomas D., Maraston C., Bender R., 2003, MNRAS, 339, 897
- Thomas et al. (2011) Thomas D., Maraston C., Johansson J., 2011, MNRAS, 412, 2183
- Trujillo & Pohlen (2005) Trujillo, I., & Pohlen, M. 2005, ApJL, 630, L17
- Seidel et al. (2015) Seidel, M. K., Cacho, R., Ruiz-Lara, T., et al. 2015, MNRAS, 446, 2837
- Vazdekis et al. (2010) Vazdekis A., Sánchez-Blázquez P., Falcón-Barroso J., Cenarro A. J., Beasley M. A., Cardiel N., Gorgas J., Peletier R. F., 2010, MNRAS, 404, 1639
- Worthey (1994) Worthey, G. 1994, ApJS, 95, 107
- Worthey et al. (2005) Worthey G., España A., MacArthur L. A., Courteau S., 2005, ApJ, 631, 820
- Yoachim & Dalcanton (2008) Yoachim P., Dalcanton J. J., 2008, ApJ, 683, 707
- Yong et al. (2006) Yong D., Carney B. W., Teixera de Almeida M. L., Pohl B. L., 2006, AJ, 131, 2256
- Vazdekis et al. (2015) Vazdekis, A., Coelho, P., Cassisi, S., et al. 2015, MNRAS, 449, 1177