Infrared Two-Color Diagrams for AGB stars, post-AGB stars, and Planetary Nebulae
Abstract
We present various infrared two-color diagrams (2CDs) for AGB stars, post-AGB stars, and Planetary Nebulae (PNe) and investigate possible evolutionary tracks. We use catalogs from the available literature for the sample of 4903 AGB stars (3373 O-rich; 1168 C-rich; 362 S-type), 660 post-AGB stars (326 post-AGB; 334 pre-PNe), and 1510 PNe in our Galaxy. For each object in the catalog, we cross-identify the , , , and 2MASS counterparts. The IR 2CDs can provide useful information about the structure and evolution of the dust envelopes as well as the central stars. To find possible evolutionary tracks from AGB stars to PNe on the 2CDs, we investigate spectral evolution of post-AGB stars by making simple but reasonable assumptions on the evolution of the central star and dust shell. We perform radiative transfer model calculations for the detached dust shells around evolving central stars in the post-AGB phase. We find that the theoretical dust shell model tracks using dust opacity functions of amorphous silicate and amorphous carbon roughly coincide with the densely populated observed points of AGB stars, post-AGB stars, and PNe on various IR 2CDs. Even though some discrepancies are inevitable, the end points of the theoretical post-AGB model tracks are generally converged to the region of the observed points of PNe on most 2CDs.
Subject headings:
stars: AGB and post-AGB - circumstellar matter - infrared: stars - dust, extinction - radiative transfer.1. Introduction
Asymptotic giant branch (AGB) stars are generally classified as O-rich (M-type) or C-rich (C-type) based on the chemistry of the photosphere and/or the outer envelope. When an AGB star of intermediate mass range goes through C dredge-up process and thus the C/O ratio is larger than 1, O-rich dust grain formation ceases and the star may become a carbon star (e.g., Iben 1981; Chan & Kwok 1990). S stars are generally regarded as intermediate between M-type and carbon stars in their properties (Lloyd Evans & Little-Marenin 1999). However, this M-S-C evolutionary sequence can be different depending on the mass and metallicity (e.g., Groenewegen et al. 1995; Suh 2014). Dust envelopes around AGB stars are believed to be a main source of interstellar dust. The outflowing envelopes around AGB stars are very suitable places for massive dust formation. Nearly all AGB stars can be identified as Long-Period Variables (LPVs). The AGB phase of the LPV is characterized by dusty stellar winds with high mass-loss rates (; e.g., Loup et al. 1993).
As the star leaves the AGB phase, its mass-loss rate decreases significantly and the star may become hot enough to ionize its circumstellar material. When mass-loss reduces the mass of the remaining H-rich envelope below (the exact value depends on the initial mass), the stellar envelope begins to shrink and the effective temperature starts to increase (e.g., Schönberner 1983) until the central star is hot enough ( 30000 K) to ionize the circumstellar nebula. If the temperature increases on a timescale shorter than the dispersion time of the matter previously ejected by the star, a planetary nebula (PN) will appear. Planetary nebulae (PNe) are believed to be a common end-point of stellar evolution for a large fraction of all stars between 1 and 10 .
The intermediate phase between the end of the AGB phase and the PN phase is called the post-AGB phase. During the the post-AGB phase, the dust shell formed in the AGB phase detaches from the central star and becomes optically thin after a few hundred years (e.g., Hrivnak et al. 1989). There could be some post-AGB objects that have left the AGB stage but will evolve to the white dwarf stage without ever becoming a PN (e.g., Zuckerman 1978; Szczerba et al. 2007). The evolutionary lifetime of a PN is critically dependent on the core-mass of its central star (e.g., Renzini 1981). A low-mass star evolves too slowly to become a PN and a high-mass star is luminous too briefly to be detected. Therefore, only stars with core-masses in a narrow mass range ( 0.6 ) would be seen as PNe (e.g., Kwok 2000).
The () Point Source Catalog (PSC) (version 2.1) provided useful photometric data in four bands (12, 25, 60, and 100 m). In characterizing the circumstellar environments of AGB and post-AGB stars, the two-color diagram (2CD) in the PSC has been useful (e.g., Suh & Kwon 2011). The Low Resolution Spectrograph (LRS; = 822 m) data are useful to identify important features of dust grains. Kwok et al. (1997) used LRS to identify the class E (the 10 m silicate feature in emission), class A (the 10 m silicate feature in absorption), class C (the 11 m SiC dust emission), and class P (the 11.3 m or 12.5 m emission features that are attributed to polycyclic aromatic hydrocarbon; PAH).
The Midcourse Space Experiment (; Egan et al. 2003) surveyed the Galactic plane in four bands (8.28, 12.13, 14.65, and 21.34 m). (Murakami et al. 2007) provided PSC data in two bands (9 and 18 m) from an all-sky survey. The PSC from the two micron all sky survey (2MASS; Cutri et al. 2003) contains accurate positions and fluxes in (1.25 m), (1.65 m), and (2.17 m) bands.
In this paper, we present various IR 2CDs for AGB stars, post-AGB stars, and PNe and investigate possible evolutionary tracks. We use catalogs from the available literature for the sample stars in our Galaxy. For each object in the catalog, we cross-identify the , , , and 2MASS counterparts. To investigate possible evolutionary tracks from AGB stars to PNe on the 2CDs, we make simple but reasonable theoretical models on the evolution of the central star and dust shell in the post-AGB phase. We perform radiative transfer model calculations for detached dust shells around evolving central stars in the post-AGB phase. We compare the theoretical model tracks with observations of AGB stars, post-AGB stars, and PNe and discuss possible evolutionary tracks on the IR 2CDs.
| Class | Reference | Number | PSC | PSC | PSC | 2MASS | A∗ | E∗ | C∗ | P∗ |
|---|---|---|---|---|---|---|---|---|---|---|
| O-AGB | Kwon & Suh (2012) | 3373 | 3373 | 2708 | 1753 | 2708 | 186 | 1125 | 0 | 44 |
| C-AGB | Suh & Kwon (2011) | 1168 | 1168 | 1012 | 687 | 1012 | 0 | 0 | 713 | 11 |
| S-AGB | Suh & Kwon (2011) | 362 | 362 | 336 | 128 | 336 | 0 | 29 | 1 | 0 |
| post-AGB | Szczerba et al. (2007) | 326 | 236 | 254 | 117 | 318 | 4 | 14 | 1 | 3 |
| Pre-PNe | Kohoutek (2001) | 334 | 326 | 253 | 177 | 253 | 15 | 24 | 6 | 4 |
| PNe | Kohoutek (2001) | 1510 | 927 | 808 | 414 | 808 | 1 | 15 | 0 | 13 |
∗: The LRS class.
2. Sample stars and IR Two-Color Diagrams
We use catalogs from the available literature for the sample of 4903 AGB stars (3373 O-AGB; 1168 C-AGB; 362 S-type), 660 post-AGB stars (326 post-AGB; 334 pre-PN), and 1510 PNe. For each object in the catalog, we cross-identify the PSC, PSC, PSC, and 2MASS counterparts as we will explain in subsections.
In Table 1, we list the reference, total number of objects, and numbers of the cross-identified PSC, PSC, PSC, and 2MASS counterparts. We also list the number of sources according to the LRS classification. Class E and A objects show O-rich dust features and class C and P objects show C-rich dust features (see section 1).
There are considerable differences in the angular resolutions of different data sets. The angular resolutions for the , , , and 2MASS are 0.754.5-4.6, 18.3, 9.4 (in 9 m band), and 2, respectively. The differing spatial resolutions may have impacts on the photometry used in the 2CDs. The 2MASS flux presumably includes only the central star, while the fluxes may include the extended outer envelope.
Because has very low angular resolution, the survey regions may suffer from confusion problems. So the 2MASS counterpart obtained from the PSC position can be a different object. The 2MASS counterpart obtained from the position data from which has a higher resolution would be much more reliable.
2.1. AGB stars
Suh & Kwon (2011) presented a catalog of AGB stars for 3003 O-rich, 1168 C-rich, and 362 S-type objects in our Galaxy. For the catalog, they compiled previous works with verifying processes from the sources listed in the PSC. Kwon & Suh (2012) presented a revised sample of 3373 O-rich AGB stars.
By using the position information in version 2.1 of the PSC, we cross-identify the and counterparts by finding the nearest source within 30 for each object. For 2MASS, we find the closest counterpart in the position within 30 using the position information of the cross-identified PSC source.
| O-AGB | C-AGB | post-AGB | Pre-PNe | |
|---|---|---|---|---|
| O-AGB | 3373 | 0 | 34 | 74 |
| C-AGB | 0 | 1168 | 12 | 23 |
| post-AGB | 34 | 12 | 326 | 100 |
| Pre-PNe | 74 | 24 | 100 | 334 |
2.2. Post-AGB stars
The intermediate phase between the end of the AGB phase and the PN phase is called the post-AGB phase (e.g., Szczerba et al. 2007). It was formerly also referred to as the proto-PN phase or the pre-PN phase (e.g., Zuckerman 1978; Parthasarathy & Pottasch 1986; Hrivnak et al. 1989; Kwok 2000; Kohoutek 2001).
For this paper, we use the list of 326 ‘very likely post-AGB objects’ from the catalog of post-AGB stars by Szczerba et al. (2007) and 334 pre-PNe from the catalogue of Galactic Planetary Nebulae (Updated Version 2000; Kohoutek 2001). We regard the 660 objects in both catalogs (post-AGB objects and pre-PNe) as post-AGB stars.
Because AGB stars and post-AGB stars share some similarities, they could have been duplicately classified. Table 2 lists them. For S type AGB stars, there are no duplicated objects.
For post-AGB stars, we use the PSC, , and 2MASS counterparts listed in Szczerba et al. (2007). We cross-identify the counterparts by finding the nearest source within 30 using the position information in Szczerba et al. (2007) for each object.
For pre-PNe, we use the PSC counterparts listed in Kohoutek (2001). We cross-identify the and counterparts by finding the nearest source within 30 using the position information in Kohoutek (2001). For the 2MASS counterpart, we find the closest source in the position within 30 using the position information of the cross-identified PSC source.
2.3. Planetary Nebulae
For this paper, we use the catalogue of Galactic Planetary Nebulae (Updated Version 2000; Kohoutek 2001). This catalogue contains 1510 objects classified as galactic PNe up to the end of 1999. Valuable information about the objects including their identification charts and the lists of references can be found in the Strasbourg-ESO Catalogue of Galactic Planetary Nebulae (Acker et al. 1992; SECGPN) and in its First Supplement (Acker et al. 1996). Kerber et al. (2003) presented more accurate position data for 1312 PNe.
There have been significant new discoveries of PNe after Kohoutek (2001). The most important contribution would be the Macquarie/AAO/Strasbourg H (MASH) catalogue (Parker et al. 2006) which represents the largest incremental increase in Galactic PN numbers to date. However, MASH PNe are typically more evolved, obscured, and of lower surface brightness than those found in most previous surveys. Therefore, we do not use the newly discovered PNe because they are not very useful for the purpose of this work.
For PNe, we use PSC counterpart listed in Kohoutek (2001). We cross-identify the and counterparts by finding the nearest source within 30 using the position information in Kohoutek (2001) and Kerber et al. (2003). For the 2MASS counterpart, we find the closest source in the position within 30 using the position information of the cross-identified PSC source.
2.4. IR Two-Color Diagrams
Infrared fluxes from the (PSC; 12, 25, 60, and 100 m), (PSC; 8.28, 12.13, 14.65, and 21.34 m), (PSC; 9 and 18 m) and 2MASS (1.25, 1.65, and 2.17 m) are available for the sample of AGB stars, post-AGB stars, and PNe as discussed in previous subsections. The large number of observations can be used to form various 2CDs that can be compared with theoretical model predictions.
The color index is defined by
| (1) |
where means the zero magnitude calibration at given wavelength () (see Suh & Kwon 2011 for details).
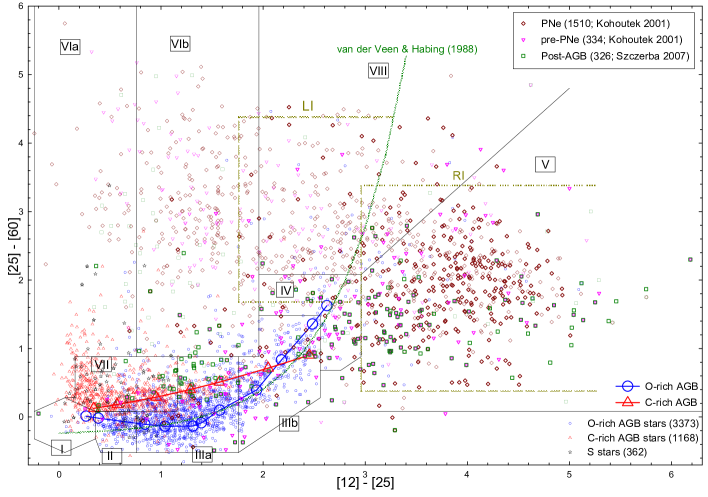
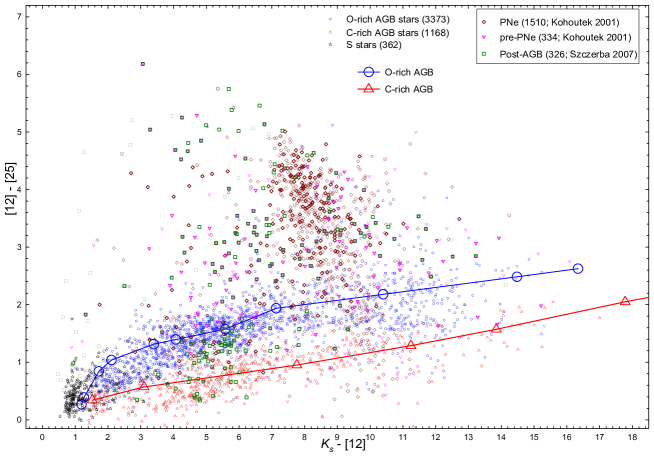
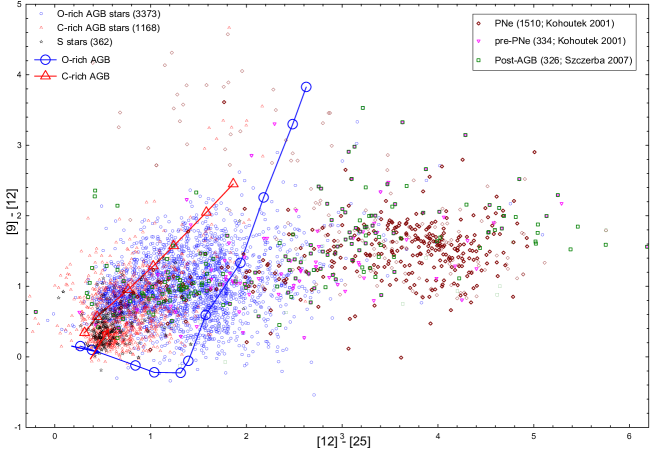
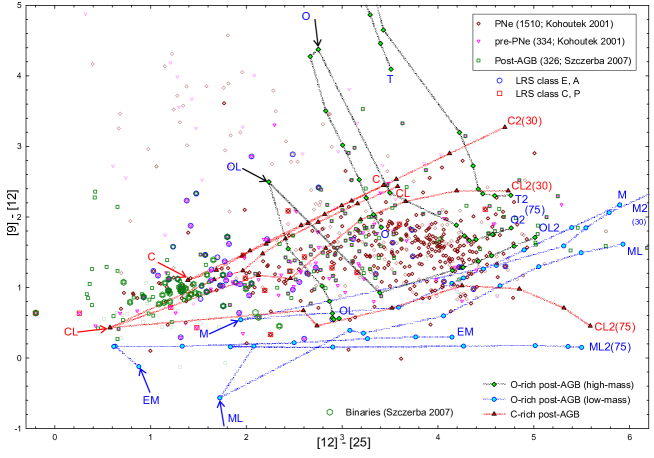
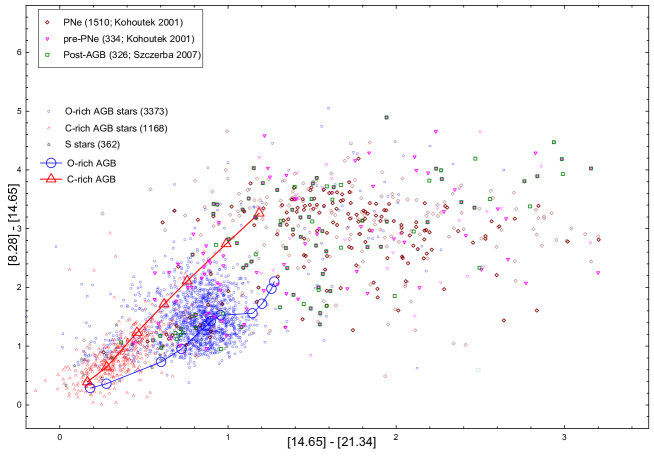
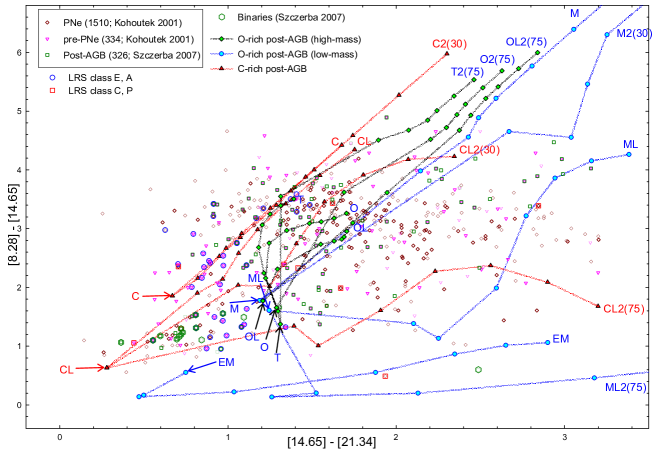
Figures 1, 2, 3, and 4 show , NIR, , and 2CDs for AGB stars, post-AGB stars, and PNe compared with theoretical models. The small symbols are observational data and the lines with symbols are theoretical model calculations. For each figure, the upper panel plots all observed objects and theoretical model tracks for AGB stars. The lower panel plots observed objects of post-AGB stars and PNe and theoretical model tracks for post AGB stars. We will discuss the theoretical models in sections 3 and 4. We will compare the theoretical models with the observations on the IR 2CDs in section 5.
For AGB stars, we plot only those objects with good quality (q = 3) at any wavelength on all 2CDs using the , , 2MASS, and data. On the other hand, we plot all objects for post-AGB stars and PNe. For the post-AGB stars and PNe with good quality (q = 3) data, we plot them by thicker symbols. For the post-AGB stars and PNe which have the LRS data, we indicate the LRS class by corresponding symbols. Class E and A objects show O-rich dust features and class C and P objects show C-rich dust features. The 42 post-AGB stars which are known to be binary systems (Szczerba et al. 2007) are marked by the green hexagonal symbol.
For AGB stars, the objects in the upper-right regions on any 2CDs have thicker dust shells with large optical depths. Generally, the [12][25], [14.65][21.34], and [25][60] colors for PNe are redder than those for AGB stars with thick dust shells. The [8.28][14.65] colors for PNe are comparable to those for AGB stars with thick dust shells. However, [12] and [9][12] colors for PNe are bluer than those for AGB stars with thick dust shells. These effects are clearly displayed in the 2CDs. The locations of PNe look to be converged toward upper-right regions on the two 2CDs using [25][60] versus [12][25] and [8.28][14.65] versus [14.65][21.34]. But for the 2CD using [12][25] versus [12], the convergence occurs toward the upper-middle region. For the 2CD using [9][12] versus [12][25], the convergence occurs toward the right region.
3. Theoretical dust shell models
To investigate the spectral evolution of AGB and post-AGB stars on the IR 2CDs, we use radiative transfer models for spherically symmetric dust shells. We assume that the central star emits blackbody radiation (see section 6.1 for a discussion on the assumptions).
3.1. Radiative transfer model calculations
In this work, we use the radiative transfer code RADMC-3D (http://www.ita.uni-heidelberg.de/dullemond/software/radmc-3d/) to calculate the model SEDs for dust shells around AGB stars and pos-AGB stars. RADMC-3D is based on the Monte Carlo simulation method of Bjorkman & Wood (2001) for investigating dust continuum radiative transfer processes. For a spherically symmetric dust shell, we have compared the model results obtained by the RADMC-3D code with those obtained by the radiative transfer codes CSDUST3 (Egan et al. 1988) and DUSTY (Ivezić & Elitzur (1997). All of these three codes produced essentially identical results for the same model parameters.
We assume a spherically symmetric dust shell around a single star. We use similar schemes for dust density distribution as those used by Suh & Kwon (2013). We assume that the dust density distribution is continuous from the inner radius () to the outer radius () for a spherically symmetric dust shell. For the dust density distribution, we use the simple power law equation
| (2) |
where is the dust density at of the dust shell. The mass-loss rate is given by
| (3) |
where is the material density at which is given by
| (4) |
where is the dust-to-gas ratio which is assumed to be 0.01 (e.g., Suh 2014). The mass-loss rate () and dust shell expansion velocity () remain constant.
The inner shell dust temperature () is the dust temperature at . The model SEDs are sensitively dependent on (or ). For all AGB and post-AGB stars, we assume that the dust formation (or condensation) temperature () is 1000 K (e.g., Suh 1999, 2004).
If dust formation ceases when the post-AGB phase starts, the dust shell begins to detach (i.e., increases for colder ). For all of the models, we use the outer radius () of the dust shell so that the dust temperature at is lower than 30 K which is comparable to the temperature of interstellar medium.
We assume that all dust grains are spherical with a uniform radius of 0.1 m and the scattering is assumed to be isotropic. We choose 10 m as the fiducial wavelength that sets the scale of the dust optical depth ().
For the central star, we assume that it emits blackbody radiation for a given temperature and luminosity.
3.2. AGB stars
For AGB stars, we use similar assumptions for the dust shell models as those used for Suh & Kwon (2011). For O-rich stars, we use the optical constants of warm and cold silicate grains derived by Suh (1999). We compute models for eleven dust optical depths ( 0.005, 0.01, 0.05, 0.1, 0.5, 1, 3, 7, 15, 30, and 40). We use the warm silicate dust grains for low mass-loss rate O-rich AGB stars (7 models with ) and the cold silicate grains for high mass-loss rate O-rich AGB stars (4 models with ). For the central star, we assume that the luminosity is and the stellar blackbody temperature is 2500 K for and 2000 K for .
For C-rich stars, we use the optical constants of amorphous carbon (AMC) grains derived by Suh (2000). We perform the model calculations for seven dust optical depths ( 0.01, 0.1, 1, 2, 3, 5, and 7). For the central star, we assume that the luminosity is and the stellar blackbody temperature is 2300 K for and 2000 K for .
In Figures 1 - 4, the theoretical model tracks for AGB stars are plotted on IR 2CDs. Suh & Kwon (2011) presented more various model tracks for AGB stars using more dust species.
4. Spectral evolution of Post-AGB stars
To understand possible evolutionary tracks from AGB stars to PNe on 2CDs, we investigate the spectral evolution of post-AGB stars using the radiative transfer model as described in section 3.1. We make simple but reasonable assumptions on the evolution of properties of the dust shell and the central star to find theoretical evolutionary tracks of post-AGB stars on 2CDs.
The SEDs of typical post-AGB stars show two distinct components: the cooler component corresponds to the remnant of the AGB dust shell, and the warmer component corresponds to the photosphere of the central star (e.g., Volk & Kwok 1989). The clear separation of the two flux components would be due to the detached dust shell because the AGB mass-loss terminated some time ago. The dynamical time scale (after the cessation of AGB mass-loss) can be estimated by radiative transfer models. The typical time scales of the post-AGB phase range from several hundred to a thousand years (e.g., Hrivnak et al. 1989).
4.1. The central star
For the central star, we assume a fixed stellar luminosity and changing stellar blackbody temperatures during the post-AGB phase. We use relevant model parameters from the theoretical models of post-AGB stars presented by van Hoof et al. (1997). Their models are based on the works by Wood (1990), Vassiliadis & Wood (1993, 1994), Blöcker & Schönberner (1991), and Blöcker (1995a,b). Many assumptions have to be made about the mass-loss rate, the exact time of the end of the AGB phase, and the outflow velocity. The duration of the post-AGB phase may be as long as 104-105 years for the less massive objects, but more massive objects may last only a few decades or centuries in the post-AGB phase (Blöcker 1995b).
In this work, we assume that the AGB-type mass-loss stops (i.e., the AGB phase ends) when the central star has reached an inferred pulsation period of = 100 days (Blöcker 1995b). When the star has subsequently reached an inferred pulsation period of = 50 days the post-AGB phase (mass-loss) starts. The mass-loss rate changes smoothly between the AGB and post-AGB phases.
For = 100 days and = 50 days, the calculated evolutionary time scales of the post-AGB phase show wide variations (about 38 - 8700 years; see van Hoof et al. 1997) depending on the core-mass () and post-AGB mass-loss rates. If we assume earlier ends of the AGB phase (a larger value of ), the time scale can be significantly increased. Comparison of the preliminary dust shell model (see section 4.2) results with the observations on the IR 2CDs indicated that the theoretical post-AGB phase needs to be rather short (within a thousand years) to match the observations.
We restrict ourselves to two different core-mass models for this paper. For low-mass O-rich stars and C-rich stars, we use = 0.605 and = 6310 with the post-AGB mass-loss rate at 5 times the standard value. For high-mass O-rich stars, we use = 0.696 and = 11610 with the post-AGB mass-loss rate at the standard value. The corresponding model parameters are adopted from Table 1 in van Hoof et al. (1997) for the evolution of the central star in the post-AGB phase. The time scales of the post-AGB phase are 832 and 174 years for the low core-mass and high core-mass models, respectively.
For the low core-mass model, Table 3 presents five base models for the dust shell. For the high core-mass model, Table 4 presents three base models for the dust shell. We will discuss the dust shell models in section 4.2. For each dust shell model, the time evolution of the surface temperature () of the central star at eight points in the post-AGB phase as well as the fixed stellar luminosity () are presented.
| = 0.605 , = 6310 , Dust: Silicate, =(EM:; ML:; M:) | |||||||
| Base Model | (K) | (years) | (AU) | (g/cm3) | (K) | Derived Model(s) | |
| EM | 6042 | 0 | 1.70E+01 | 1.93E-21 | 1.00E-03 | 1000 | EM2(75): =75 |
| =15 | 6500 | 113 | 3.75E+02 | 3.98E-24 | 4.59E-05 | 205 | EM2(150): =150 |
| =0.001 | 7000 | 178 | 5.80E+02 | 1.66E-24 | 2.96E-05 | 174 | =0.001 |
| 10000 | 241 | 7.80E+02 | 9.18E-25 | 2.20E-05 | 168 | ||
| 15000 | 325 | 1.05E+03 | 5.10E-25 | 1.64E-05 | 164 | ||
| 20000 | 452 | 1.45E+03 | 2.66E-25 | 1.18E-05 | 152 | ||
| 25000 | 625 | 1.99E+03 | 1.40E-25 | 8.53E-06 | 138 | ||
| 30000 | 832 | 2.65E+03 | 7.95E-26 | 6.44E-06 | 126 | ||
| ML | 6042 | 0 | 1.90E+01 | 5.00E-20 | 2.90E-02 | 1000 | ML2(75): =75 |
| =15 | 6500 | 113 | 3.77E+02 | 1.27E-22 | 1.47E-03 | 205 | ML2(150): =150 |
| =0.029 | 7000 | 178 | 5.82E+02 | 5.32E-23 | 9.51E-04 | 174 | ML2(300): =300 |
| 10000 | 241 | 7.82E+02 | 2.95E-23 | 7.09E-04 | 168 | =0.029 | |
| 15000 | 325 | 1.05E+03 | 1.65E-23 | 5.32E-04 | 164 | ||
| 20000 | 452 | 1.45E+03 | 8.59E-24 | 3.82E-04 | 152 | ||
| 25000 | 625 | 2.00E+03 | 4.53E-24 | 2.78E-04 | 138 | ||
| 30000 | 832 | 2.65E+03 | 2.57E-24 | 2.08E-04 | 126 | ||
| M | 6042 | 0 | 2.47E+01 | 3.10E-18 | 2.35E+00 | 1000 | M2(30): =30 |
| =15 | 6500 | 113 | 3.82E+02 | 1.29E-20 | 1.51E-01 | 241 | =2.35 |
| =2.35 | 7000 | 178 | 5.89E+02 | 5.46E-21 | 9.88E-02 | 198 | |
| 10000 | 241 | 7.88E+02 | 3.04E-21 | 7.36E-02 | 190 | ||
| 15000 | 325 | 1.05E+03 | 1.70E-21 | 5.48E-02 | 180 | ||
| 20000 | 452 | 1.46E+03 | 8.91E-22 | 3.99E-02 | 162 | ||
| 25000 | 625 | 2.00E+03 | 4.70E-22 | 2.88E-02 | 144 | ||
| 30000 | 832 | 2.66E+03 | 2.67E-22 | 2.17E-02 | 130 | ||
| = 0.605 , = 6310 , Dust: Amorphous Carbon, =(CL:; C:) | |||||||
| Base Model | (K) | (years) | (AU) | (g/cm3) | (K) | Derived Model(s) | |
| CL | 6042 | 0 | 1.78E+01 | 3.70E-20 | 1.00E-02 | 1000 | CL2(30): =30 |
| =15 | 6500 | 113 | 3.75E+02 | 8.32E-23 | 4.77E-04 | 298 | CL2(150): =150 |
| =0.01 | 7000 | 178 | 5.81E+02 | 3.47E-23 | 3.08E-04 | 255 | CL2(300): =300 |
| 10000 | 241 | 7.80E+02 | 1.93E-23 | 2.30E-04 | 241 | =0.01 | |
| 15000 | 325 | 1.05E+03 | 1.07E-23 | 1.72E-04 | 222 | ||
| 20000 | 452 | 1.45E+03 | 5.59E-24 | 1.24E-04 | 197 | ||
| 25000 | 625 | 2.00E+03 | 2.94E-24 | 8.99E-05 | 175 | ||
| 30000 | 832 | 2.65E+03 | 1.67E-24 | 6.77E-05 | 156 | ||
| C | 6042 | 0 | 1.83E+01 | 7.50E-18 | 2.11E+00 | 1000 | C2(30): =30 |
| =15 | 6500 | 113 | 3.76E+02 | 1.78E-20 | 1.03E-01 | 311 | =2.11 |
| =2.11 | 7000 | 178 | 5.82E+02 | 7.43E-21 | 6.67E-02 | 266 | |
| 10000 | 241 | 7.81E+02 | 4.12E-21 | 4.96E-02 | 251 | ||
| 15000 | 325 | 1.05E+03 | 2.29E-21 | 3.71E-02 | 232 | ||
| 20000 | 452 | 1.45E+03 | 1.20E-21 | 2.68E-02 | 207 | ||
| 25000 | 625 | 2.00E+03 | 6.31E-22 | 1.94E-02 | 182 | ||
| 30000 | 832 | 2.65E+03 | 3.57E-22 | 1.45E-02 | 162 | ||
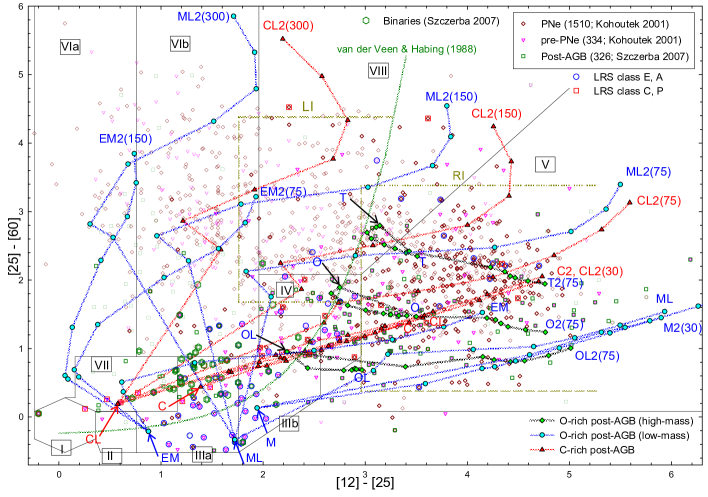
Dust shell parameters are presented for base models (see section 4.2). The unit for is km/sec. Note that the model tracks for EM2(75), EM2(150), ML2(150),ML2(150), ML2(300), and CL2(300) are plotted only on the 2CD (Figure 1).
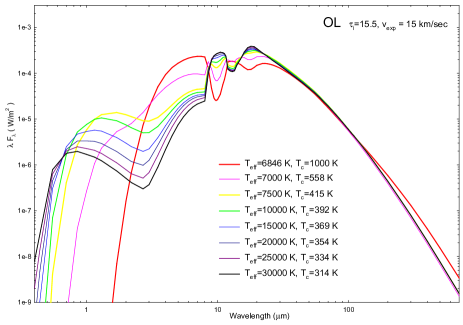
| = 0.696 , = 11610 , Dust: Silicate, =(OL:; O:; T:) | |||||||
| Base Model | (K) | (years) | (AU) | (g/cm3) | (K) | Derived Model | |
| OL | 6846 | 0 | 2.54E+01 | 2.00E-17 | 1.55E+01 | 1000 | OL2(75): =75 |
| =15 | 7000 | 29 | 1.17E+02 | 9.40E-19 | 3.38E+00 | 558 | =15.5 |
| =15.5 | 7500 | 62 | 2.22E+02 | 2.63E-19 | 1.79E+00 | 415 | |
| 10000 | 84 | 2.91E+02 | 1.52E-19 | 1.36E+00 | 392 | ||
| 15000 | 111 | 3.77E+02 | 9.10E-20 | 1.05E+00 | 369 | ||
| 20000 | 129 | 4.34E+02 | 6.86E-20 | 9.13E-01 | 354 | ||
| 25000 | 151 | 5.03E+02 | 5.10E-20 | 7.86E-01 | 334 | ||
| 30000 | 174 | 5.76E+02 | 3.89E-20 | 6.86E-01 | 314 | ||
| O | 6846 | 0 | 3.00E+01 | 5.65E-17 | 5.20E+01 | 1000 | O2(75): =75 |
| =15 | 7000 | 29 | 1.22E+02 | 3.43E-18 | 1.21E+01 | 501 | =52 |
| =52 | 7500 | 62 | 2.26E+02 | 9.94E-19 | 6.48E+00 | 373 | |
| 10000 | 84 | 2.96E+02 | 5.81E-19 | 4.96E+00 | 343 | ||
| 15000 | 111 | 3.81E+02 | 3.50E-19 | 3.84E+00 | 321 | ||
| 20000 | 129 | 4.38E+02 | 2.65E-19 | 3.34E+00 | 310 | ||
| 25000 | 151 | 5.08E+02 | 1.97E-19 | 2.89E+00 | 296 | ||
| 30000 | 174 | 5.81E+02 | 1.51E-19 | 2.53E+00 | 283 | ||
| T | 6846 | 0 | 3.75E+01 | 8.90E-17 | 1.02E+02 | 1000 | T2(75): =75 |
| =15 | 7000 | 29 | 1.29E+02 | 7.49E-18 | 2.97E+01 | 485 | =102 |
| =102 | 7500 | 62 | 2.34E+02 | 2.29E-18 | 1.65E+01 | 360 | |
| 10000 | 84 | 3.03E+02 | 1.36E-18 | 1.26E+01 | 320 | ||
| 15000 | 111 | 3.89E+02 | 8.28E-19 | 9.87E+00 | 290 | ||
| 20000 | 129 | 4.46E+02 | 6.30E-19 | 8.60E+00 | 276 | ||
| 25000 | 151 | 5.15E+02 | 4.71E-19 | 7.42E+00 | 263 | ||
| 30000 | 174 | 5.88E+02 | 3.62E-19 | 6.50E+00 | 252 | ||
Dust shell parameters are presented for base models (see section 4.2). The unit for is km/sec.
4.2. The dust shell
For the dust shell, we use dust radiative transfer model described in section 3.1. We use the same dust opacity functions as those used for AGB stars. we use the optical constants of cold silicate dust grains derived by Suh (1999) for O-rich post-AGB stars. For C-rich post-AGB stars, we use the optical constants of amorphous carbon (AMC) dust grains derived by Suh (2000).
For C-rich post-AGB stars, we use AMC rather than graphite which is widely used for interstellar dust or young stellar objects. It is believed that AMC is the main dust component for C-rich post-AGB stars (e.g., Hony et al. 2003; Cerrigone et al. 2009) as well as for C-rich AGB stars. Unlike AGB stars, C-rich post-AGB stars show dust features from hydrogenated amorphous carbon and PAH as well as SiC and MgS (e.g., Justtanont et al. 1996a).
The typical dust shell expansion velocity () is about 15 km/sec for AGB stars (e.g., Loup et al. 1993; Suh 2014). Even though it is not clear whether can be increased during the AGB phase or post-AGB phase, could be higher in the post-AGB phase. Slijkhuis et al. (1991) measured the outflow velocities up to = 400 km/sec for a post-AGB star ( 08005-2356). We use various possible values of (15, 30, 75, 150, and 300 km/sec) for post-AGB stars.
Uncertainty on the mass-loss rate remains. A thermal pulse in the AGB phase can change the mass-loss rate abruptly (e.g., Renzini 1981; Wood 1990; Vassiliadis & Wood 1993, 1994) from the continuous analytical laws which were used for the central star (see section 4.1). The effect of the thermal pulse on would be minor, but the effect on could be significant. However, a change in does not affect the shape of the output spectra (or color), it only affects the overall energy output. Therefore, we may ignore the effect of the thermal pulse on the mean properties (, ) of the central stars for a large sample of evolving stars.
However, a change in the mass-loss rate of the dust shell due to the thermal pulse affects the observed SED significantly. The various effects of the thermal pulse on a dust shell (a superwind and/or chemical transition from O to C) in the AGB phase are well investigated (e.g., Groenewegen et al. 1995; Justtanont et al. 1996b; Suh & Jones 1997). Considering the effects of the thermal pulses, we use various mass-loss rates of the dust shell (rather than a fixed one) at the end of the AGB phase.
To make a simplified dust shell model as described in section 3.1, we assume that the mass-loss rate and of the dust shell at the end of the AGB phase remain constant during the period between the end of AGB phase and the start of the post-AGB phase. And we assume that AGB dust formation (at = 1000 K) continues during the period between the end of AGB phase and the start of the post-AGB phase because dust formation properties during the period can not be easily clarified.
We assume that the AGB dust formation (at = 1000 K) ceases with the start of the post-AGB phase. is defined as the time scale since the start of the post-AGB phase. With the start of post-AGB phase, the inner radius () of the dust shell increases with time ():
| (5) |
where is at =0. As the post-AGB star evolves, gets colder as the dust shell detaches. For the dust shell, we assume various initial dust optical depths at the start of the post-AGB phase so that the corresponding mass-loss rates (Equation 3) are reasonably in the range of observed values of AGB stars.
We make various dust shell models with different mass-loss rates () for each core-mass model of the central star. For the low core-mass model, we present three base models (EM, ML, M) for low-mass O-rich post-AGB stars and two base models (CL and C) for C-rich post-AGB stars in Table 3. For the high core-mass model, we present three base models (OL, O, and T) for high-mass O-rich post-AGB stars in Table 4. For all dust shell models, the expansion velocity () and mass-loss rate () of the dust shell remain constant during the whole post-AGB phase (see section 3.1).
In Tables 3 and 4, the mass-loss rates are presented for base models. We assume that = 15 km/sec for all base models. For each base model, dust shell parameters (, , , and ) at eight points of time evolution in the post-AGB phase are listed. is defined as the initial dust optical depth () at the start of the post-AGB phase. As the post-AGB phase evolves, and the output parameter (the inner shell dust temperature) decrease while increases with time ().
For each base model, we make model calculations for various derived models with faster dust shell expansion velocities ( = 30, 75, 150, and 300 km/sec). From the base model EM, we have two derived models EM2(75) and EM2(150) using = 75 and 150 km/sec, respectively. The derived model uses the same model parameters (e.g., and ) and produces the same model SED as the base model at =0. At later post-AGB phases, the derived model uses the same stellar parameters as the base model but different dust shell parameters (, , and ) because of higher (see Equation 5). Note that for the derived model () is given by
| (6) |
where is for the base model (see Equation 3).
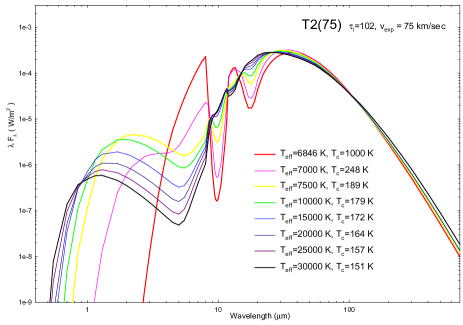
4.3. Model SEDs
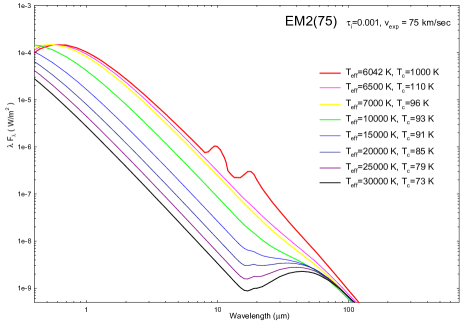
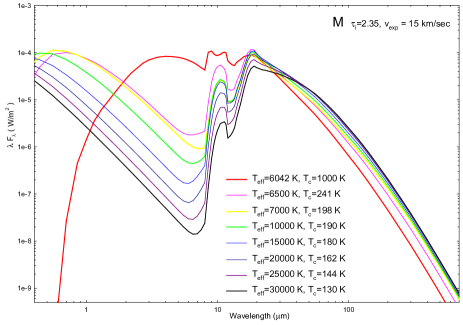
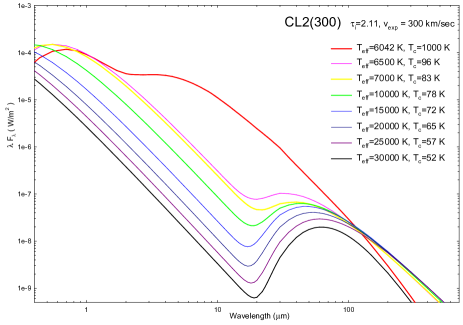
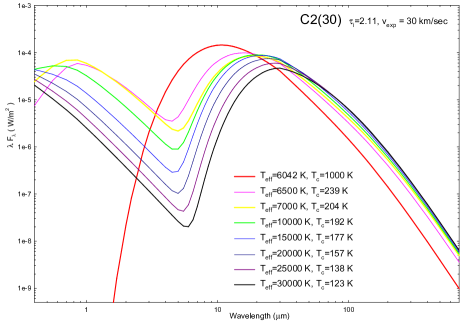
Figure 5 shows the model SEDs for post-AGB stars for six different models. At the beginning of the post-AGB phase, the SEDs look like those of AGB stars. As the star evolves to a later stage, the SED shows more distinct double components, which are typical for post-AGB stars.
Observed SEDs of many post-AGB stars show prominent silicate features (e.g., Hrivnak et al. 1989; Cerrigone et al. 2009) as well as the model SEDs for O-rich stars. The silicate features become very weak at the end of the post-AGB phase especially for the models with high . We will compare the theoretical model tracks with observations on IR 2CDs in section 5.
5. Comparison on IR 2CDs
Figures 1 - 4 show , NIR, , and 2CDs for AGB stars, post-AGB stars, and PNe compared with theoretical models. The small symbols are the observational data (see section 2.4) and the lines with large symbols are theoretical model tracks for AGB stars (section 3.1). The lines with filled symbols are theoretical model tracks for post-AGB stars (section 4).
For AGB stars, theoretical models for a range in dust shell optical depth is presented (see section 3.1). The objects in the upper-right regions on any 2CDs have thick dust shells with large optical depths for AGB stars. The locations of S stars are restricted to the regions of thin dust shells (lower-left regions) on any IR 2CDs. For AGB stars, see Suh & Kwon (2011) for a detailed discussion on the comparison of the theoretical models with the observations on various IR 2CDs.
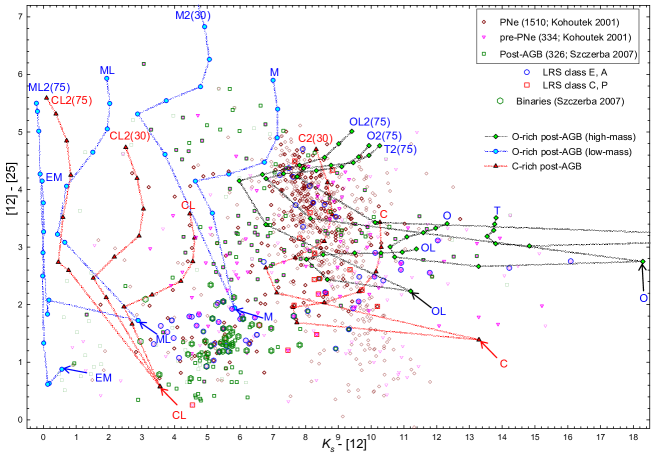
To find possible evolutionary tracks from AGB stars to PNe on 2CDs, we present the theoretical model tracks for the evolving post-AGB phase (see Tables 3 and 4 for detailed model parameters). For each post-AGB model track, the point at the start of the post-AGB phase is indicated by the tip of an arrow and the base model name. The base or derived model name is labeled at the end point of the model track.
We find that the theoretical dust shell model tracks for post-AGB stars roughly coincide with the densely populated observed points of post-AGB stars and PNe on various IR 2CDs. Even though some discrepancies are inevitable, the end points of the post-AGB model tracks are generally converged to the region of the observed points of PNe on most 2CDs.
If our assumptions on other parameters are right, the time scale of the post-AGB phase (832 years) for low core-mass models (EM, ML, M, CL, and C) looks reasonable. The models for high core-mass stars (models OL, O, and T), for which the time scale is even shorter (174 years), match the observations on IR 2CDs fairly well with various expansion velocities.
Unlike AGB stars, C-rich post-AGB stars or PNe typically show PAH dust emission features at 3.3, 6.2, 7.7, 8.6, 11.3, and 12.5 m (e.g., Justtanont et al. 1996a; Cerrigone et al. 2009). This could be due to UV radiation from the hot central stars that have evolved past the AGB. The observed colors [8.28][14.65] and [12][25] could be bluer than the theoretical model colors which do not consider PAH dust.
The effects of very thin dust shell models (EM, ML, and CL) or very thick models (T) can be more clearly presented on the 2CD than any other 2CDs considered in this work. This is because the [25][60] color, which uses longer wavelengths, can represent the evolving SED better than any other colors (see Figure 5). Other model colors can be more easily saturated to certain values because they can be more severely affected by the boundary between two components (the central star and the dust shell) and/or silicate dust features. Because [12], [9][12], and [8.28][14.65] model colors are rapidly converged to certain values for very small dust optical depths, the IR 2CDs in Figures 2-4 are not useful to investigate the thin dust shell models compared with the 2CD (Figure 1). Therefore, the model tracks for EM2(75), M2(150), ML2(150), ML2(150), ML2(300), and CL2(300) are plotted only on the 2CD (Figure 1; see Table 3).
5.1. The 2CD
Figure 1 shows the 2CDs using [25][60] versus [12][25] for AGB stars and post-AGB stars compared with theoretical models. The eight regions and the curved green line which is the evolutionary track for late-type stars were defined by van der Veen & Habing (1988). The theoretical model tracks for AGB stars and the start points of the post-AGB model tracks roughly coincide with the evolutionary track for late-type stars which were defined by van der Veen & Habing (1988).
Brown dashed regions on the 2CD indicate the two groups of post-AGB stars, which are designated as LI (Left of , blue group) and RI (Right of , red group) (Sevenster 2002). Most post-AGB objects are distinguished by very red MIR colors (RI region), but there is also a group of very blue sources with a strong 60 m excess (LI region). A large number of post-AGB and PNe samples are mainly distributed in the RI region compared with limited samples of the LI region (e.g., Yoon et al. 2014). Sevenster (2002) indicated that LI objects are more massive and have higher outflow velocities than RI objects. LI objects may go through an irregular mass-loss phase, preceding the bipolar PN stage. On the other hand, RI objects are the traditional post-AGB sources (van der Veen & Habing 1988), turned right from the evolutionary sequence into region V and beyond.
The RI objects can be explained by a normal evolutionary sequence for which stars undergo dust shell detachments at the normal AGB termination. For all of the post-AGB model tracks with moderate (15 - 75 km/sec), the end points are located in this RI region. This is in accord with the fact that most of the observed PNe are converged to the RI region (see Figure 1). This trend is more noticeable when we consider only the good quality observational data of PNe which are plotted by thicker symbols on the 2CD.
The LI objects could be explained by with extremely thin dust shells (models EM2, ML2, and CL2 with faster ; see Figure 1). However, the theoretical model used for this work may not be applicable because most of the LI objects are believed to be non-spherical systems (precursors of high-mass, bipolar objects or binary systems).
If we assume that related stars are single and nearly spherical objects, the LI objects as well as the objects in upper-left region (VI) are likely to be hot objects with very thin dust shells. We find that the thin dust shell models (EM(2), ML(2), and CL(2)) with various at the beginning of the post-AGB phase can explain the post-AGB stars in the lower-left region (I, II, III, and VII) on the 2CD. For the post-AGB stars and PNe in the upper-left region (VI and LI), the model requires a very thin dust shell (models EM2, ML2, and CL2) with higher (75-300 Km/sec) and a hotter central star which is more evolved in the post-AGB phase. This requirement of a thin dust shell model may look to be in contradiction to the idea that a star at the end of the AGB phase would have a very thick dust shell. This contradiction could be explained by the effect of the chemical transition from O to C in the AGB phase (see section 6.3).
5.2. NIR, , and 2CDs
Figure 2 shows -2MASS 2CDs using [12][25] versus [12]. Compared with the 2CD, the boundaries that separate O-rich, C-rich and S stars are clearer for AGB stars. The locations of observed PNe are converged toward upper-middle region. Unlike other 2CDs, the locations of the end points for the post-AGB model tracks look to show systematic deviation from the densely populated region of the observed PNe. [12] model colors are generally redder than the observed colors of PNe.
Post-AGB stars and PNe typically show H2 line emission in the band (e.g., Davis et al. 2003; Froebrich et al. 2011). The 2MASS data in the band (2.17 m) may show this effect. If the effect of H2 emission on the band is stronger than the one from the PAH emission on the [12] band, the observed [12] colors could be bluer compared with the theoretical model colors which do not consider the H2 line emission. Another possible reason for the difference could be that the 2MASS flux may include only the central star while the fluxes may include the extended post-AGB dust envelope (see section 2).
Figure 3 shows - 2CDs using [9][12] versus [12][25]. Generally, the end points of the O-rich and C-rich post-AGB model tracks are converged to the region of observed PNe. Compared with other 2CDs, it is difficult find any boundaries that separate O-rich AGB stars and C-rich AGB stars. But the boundary that separates AGB stars and PNe is clear with the aid of the distinguishing [12][25] color. The model [9][12] colors can be affected by some dust species (alumina, SiC, and PAH) which are not considered in this work.
Figure 4 plots 2CDs using [8.28][14.65] versus [14.65][21.34]. Unlike other 2CDs, the base models (OL, O, and T) for high core-mass stars can match the observations better than the models with faster . Generally, this 2CD looks to require a faster evolution of the post-AGB phase than other 2CDs. The [14.65][21.34] color is useful to distinguish different classes of objects on the 2CD. For the [8.28][14.65] color, the PAH emission feature at 8.6 m from post-AGB stars and PNe could make the observed colors bluer (downward on the 2CD) compared with the theoretical models.
6. Discussion
6.1. Uncertainties and alternative models
To investigate spectral evolution from AGB stars to PNe, we have performed radiative transfer model calculations for the evolving dust shells and central stars in the post-AGB phase. We have assumed that the central star emits blackbody radiation. Uncertainties remain in a number of aspects.
The spherically symmetric dust shell models used for this work could be too simple for post-AGB stars because their shapes are often believed to be non-spherical (e.g., bipolar or disk-like objects). However, the theoretical models for non-spherical dust envelopes (disks or toruses) which are applicable to the highly non-spherical objects should have a much larger number of assumed model parameters which can be difficult to be compared with a large sample of observed objects.
Our assumption of the blackbody radiation for the central star inside a dust shell could be too simple especially for post-AGB stars for which gas-phase radiation from the outer shell can be important. For the evolution of a post-AGB star with an expanding gas shell, Volk (1992) used the output of the photoionization code CLOUDY (Ferland 1993) as input for a dust shell model (CSDUST3). But this could have a problem of inconsistent treatment of dust temperatures. van Hoof et al. (1997) used the CLOUDY code considering dust emission more consistently for an optically thin dust shell. However, most dust shell models at the beginning of the post-AGB phase require large dust optical depths.
For dust opacity, we have not considered some dust species: alumina, SiC, and PAH. Suh & Kwon (2011) used a mixture of alumina and silicate for O-rich AGB stars and a mixture of SiC and AMC in modelling C-rich AGB stars for various model tracks. We also used the same mixtures for testing post-AGB models, which produced different model tracks but the overall match to the observations looked similar. Unlike AGB stars, C-rich post-AGB stars or PNe typically show PAH dust features. We have discussed possible effects of PAH on IR 2CDs in section 5.
6.2. Comparison with other works on post-AGB stars
Even though both our dust shell model and van Hoof et al. (1997)’s work assume a spherically symmetric continuous dust shell, van Hoof et al. (1997) used significantly different schemes in their radiative transfer code (CLOUDY) from those used for this work (RADMC-3D). The strong point is that their model can consider some gas-phase radiation (bound-free emission for hot models). As commented in the paper, the weak point is that the CLOUDY model for a thick dust shell could be unreliable. van Hoof et al. (1997) provided many meaningful results, but some of their results need to be considered more carefully because dust optical depths at the beginning of the post-AGB phase are generally large.
On the 2CD, van Hoof et al. (1997) presented the red loop model track which causes the [12]-[25] color to loop back toward the blue, before the star resumes its normal evolution to the red. Some of our models (O and T) also show similar tracks, but they do not cover deep into the LI region. Sevenster (2002) tried to explain the LI objects on the 2CD (see section 5.1) using the leftward model track in the early phases of the red loop track. However, their dust shell model (CLOUDY) could be unreliable because the corresponding dust optical depths (for the leftward model track) are very large. Volk (1992) and Ortiz et al. (2005), who used the output of the photoionization code (CLOUDY) as input for a dust shell model (CSDUST3), also did not find the red loop model track.
If our assumptions are right, the LI region of the 2CD can be covered by the model tracks with thin dust shells at the starts of their post-AGB phases and larger detachments which can be achieved by higher expansion velocities (e.g., models EM2, ML2, and CL2 in this work). These models make upward model tracks rather than leftward (see Figure 1). Of course, any spherically symmetric dust shell models would be inappropriate for highly non-spherical objects in the LI region.
For the low core-mass model, we also used the model for = 0.605 with the post-AGB mass loss rate at the standard value (see section 4.1). The corresponding dynamical time scale of the post-AGB phase is 2093 years. This model produced the model results which are too far off from the observed points of post-AGB stars and PNe on all 2CDs. Volk (1992) and Ortiz et al. (2005) investigated spectral evolution of post-AGB stars using the similar scheme for the evolution of the central star. They also showed that a fast evolution (the time scale of less than about two thousand years) was required to match the observations on 2CDs. Because they assumed an earlier start of the post-AGB phase, the dynamical time scales from Ortiz et al. (2005) are generally larger than those used for this work.
6.3. The chemical transition in the AGB phase
As stars evolve into the thermal pulsing AGB phase, the abundances of some elements in the stellar atmosphere may change by the episodic third dredge-up process after each thermal pulse. When AGB stars of intermediate mass range go through carbon ’dredge-up’ processes, and thus the abundance of carbon is larger than that of oxygen, O-rich dust grain formation ceases and the stars become visual carbon stars. After that phase, carbon-rich dust grains start forming and the stars evolve into infrared carbon stars with thick C-rich dust envelopes and very high mass-loss rates (e.g., Iben 1981; Chan & Kwok 1990; Suh 2000).
S stars are generally regarded as intermediate between M-type and carbon stars in their properties. However, this M-S-C evolutionary sequence can be different depending on the mass and metallicity; some stars may remain in S-type until a next thermal pulse but some stars may skip the S-type star phase (e.g., Groenewegen et al. 1995). SC or CS stars are likely to be in a transitional phase from an S star to a carbon star. Generally, dust formation in envelopes of S stars is less efficient because of the lack of free O or C to form dust. Most S stars show very weak dust (silicate or carbon) emission features and low mass-loss rates (e.g., Hony et al. 2009; Smolders et al. 2012) and their locations are restricted to the regions of thin dust shells (lower-left regions) on any IR 2CDs (see Figures 1 - 4).
To reproduce the post-AGB stars in lower-left and upper-left regions on the 2CD, we need to use very thin dust shell models with higher at the beginning of the post-AGB phase (see section 5.1). S stars or visual carbon stars which have very thin dust shells are believed to be products of the chemical transition from O to C in the AGB phase. The objects which become S stars or visual carbon stars nearly at the end of the AGB phase are likely to have very thin dust (silicate or AMC) shells at the beginning of the post-AGB phase. These objects with with higher could be the post-AGB stars or PNe in the upper-left region (VI and LI) on the IRAS 2CD.
7. Summary
We have presented various IR 2CDs for AGB stars, post-AGB stars, and PNe using catalogs from the available literature for the sample of 4903 AGB stars (3373 O-AGB; 1168 C-AGB; 362 S-type), 660 post-AGB stars (326 post-AGB; 334 pre-PNe), and 1510 PNe in our Galaxy. For each object in the catalog, we cross-identify the , , , and 2MASS counterparts. For the large sample of stars, we have presented various IR 2CDs using the PSC, PSC, PSC, and NIR (2MASS data at band) data.
To find possible evolutionary tracks from AGB stars to PNe on the 2CDs, we have made simple but reasonable assumptions on the evolution of the dust shell and the central star in the post-AGB phase. We assume that AGB dust formation (at = 1000 K) ceases when the post-AGB phase starts. The dust shell detaches with the start of post-AGB phase because there is no more dust formation. We have performed radiative transfer model calculation for detached dust shells around evolving central stars in the post-AGB phase.
We have found that the theoretical dust shell model tracks using dust opacity functions of amorphous silicate and amorphous carbon roughly coincide with the densely populated observed points of AGB stars, post-AGB stars, and PNe on various IR 2CDs. Even though some discrepancies are inevitable, we have found that the end points of the theoretical post-AGB model tracks are generally converged to the region of observed points of PNe on most 2CDs. The discrepancies could be due to the limitation of the theoretical model used for this work. The dust shell model did not consider some dust species (e.g., PAH) and gas-phase radiation processes. The spherically symmetric model would not be applicable to a major portion of the observed objects which are highly non-spherical.
In this work, comparison of the model results with the observations on the IR 2CDs have indicated that the duration of the theoretical post-AGB phase needs to be rather short (within a thousand years) to match the observations. This could be because relatively small mass stars are not observed as post-AGB stars or PNe. The duration of the post-AGB phase for very low-mass stars can be as long as 104-105 years (see section 4.1). A major portion of these very low-mass stars may evolve to the white dwarf stage without ever becoming a PN.
We have discussed two sequences of the post-AGB evolution on the 2CD, which are designated as LI (blue group) and RI (red group). The red objects are likely to undergo dust shell detachments at the normal AGB termination. Most of the observed PNe are converged to the RI region as well as the results of all theoretical dust shell models with moderate . On the other hand, most of the blue objects in the LI region are likely to be non-spherical systems (precursors of bipolar PNe or binary systems) to which the theoretical dust shell models may not be applicable. However, we have demonstrated that it is also possible that the blue post-AGB stars in the LI region as well as in the upper-left region of the 2CD have very thin dust shells with higher because they had thin dust shells at the starts of their post-AGB phases. We have argued that an objects in its early post-AGB phase may have a very thin dust shells if the chemical transition from O to C due to a thermal pulse occurred in its late AGB phase.
Acknowledgments
This research was supported by Basic Science Research Program through the National Research Foundation of Korea (NRF) funded by the Ministry of Science, ICT & Future Planning (NRF-2013R1A1A2057841). This research has made use of the SIMBAD database, operated at CDS, Strasbourg, France. This research is based on observations with , a JAXA project with the participation of ESA.
References
- (1) Acker, A., Ochsenbein, F., Stenholm, B., et al. 1992, Strasbourg-ESO Catalogue of Galactic Planetary Nebulae, European Southern Observatory (SECGPN)
- (2) Acker, A., Marcout, J., & Ochsenbein, F. 1996, First Supplement to the SECPGN. Observatoire de Strasbourg
- (3) Bjorkman, J. E., & Wood, K. 2001, ApJ, 554, 615
- (4) Blöcker, T. 1995a, A&A 297, 727
- (5) Blöcker, T. 1995b, A&A 299, 755
- (6) Blöcker, T., & Schönberner D., 1991, A&A, 244, L43
- (7) Cerrigone, L., Hora, J. L., Umana, G., & Trigilio, C. 2009, ApJ, 703, 585
- (8) Chan, S. J., & Kwok S. 1990, A&A, 237, 354
- (9) Cutri, R. M., Skrutskie, M. F., van Dyk, S., et al. 2003, 2MASS All Sky Catalog of point sources, NASA/IPAC Infrared Science Archive
- (10) Davis, C. J., Smith, M. D., Stern, L., Kerr, T. H., & Chiar, J. E. 2003, MNRAS, 344, 262
- (11) Egan, M. P., Leung, C. M., & Spagna, G. F. Jr. 1988, Comput. Phys. Commun., 48, 271
- (12) Egan, M. P., Price, S. D., Kraemer, K. E., et al. 2003, Air Force Research Laboratory Technical Report AFRL-VS-TR-2003-1589
- (13) Ferland, G. J. 1993, University of Kentucky Physics Department Internal Report
- (14) Froebrich, D., Davis, C. J., Ioannidis, G., et al. 2011, MNRAS, 413, 480
- (15) Groenewegen, M. A. T., van den Hoek, L. B., & de Jong, T. 1995, A&A, 293, 381
- (16) Hony, S., Tielens, A. G. G. M., Waters, L. B. F. M., & de Koter, A. 2003, A&A, 402, 211
- (17) Hony, S., Heras, A. M., Molster, F. J., & Smolders, K. 2009, A&A, 501, 609
- (18) Hrivnak, B. J., Kwok, S., & Volk, K. M. 1989, ApJ, 346, 265
- (19) Iben, I. Jr. 1981, ApJ, 246, 278
- (20) Ivezić, A., & Elitzur, M. 1997, MNRAS, 287, 799
- (21) Justtanont, K., Barlow, M. J., Skinner, C. J., et al. 1996a, A&A, 309, 612
- (22) Justtanont, K., Skinner, C. J., Tielens, A. G. G. M., Meixner, M., & Baas, F. 1996b, ApJ, 456, 337
- (23) Kerber, F., Mignani, R., Guglielmetti, F., & Wicenec, A. 2003, A&A, 408, 1029
- (24) Kohoutek, L. 2001, Catalogue of Galactic Planetary Nebulae (Updated Version 2000). Abhandlungen Hamburger Sternwarte, XII C
- (25) Kwok, S. 2000, The Origin and Evolution of Planetary Nebulae (Cambridge: Cambridge University Press)
- (26) Kwok, S., Volk, K., & Bidelman, W. P. 1997, ApJS, 112, 557
- (27) Kwon, Y.-J., & Suh, K.-W. 2012, Journal of the Korean Astronomical Society, 45, 139
- (28) Loup, C., Forveille, T., Omont, A., & Paul, J. F. 1993, A&AS, 99, 291
- (29) Lloyd Evans, T., & Little-Marenin, I. R. 1999, MNRAS, 304, 421
- (30) Murakami, H., Baba, H., Barthel, P., et al. 2007, PASJ, 59, S369
- (31) Ortiz, R., Lorenz-Martins, S., Maciel, W. J., & Rangel, E. M. 2005, A&A, 431, 565
- (32) Parker, Q. A., Acker, A., Frew, D. J., et al. 2006, MNRAS, 373, 79
- (33) Parthasarathy, M., & Pottasch, S. R. 1986, A&A, 154, L16
- (34) Renzini, A. 1981, in Physical Processes in Red Giants, ed. I. Iben & A. Renzini (Dordrecht: Reidel), 431
- (35) Schönberner, D. 1983, ApJ, 272, 708
- (36) Sevenster, M. N. 2002, AJ, 123, 2788
- (37) Slijkhuis, S., de Jong, T., & Hu, J. Y. 1991, A&A, 248, 547
- (38) Smolders, K., Neyskens, P., Blommaert, J. A. D. L., et al. 2012, A&A, 540, A72
- (39) Suh, K.-W., & Jones, T. J. 1997, ApJ, 479, 918
- (40) Suh, K.-W. 1999, MNRAS, 304, 389
- (41) Suh, K.-W. 2000, MNRAS, 315, 740
- (42) Suh, K.-W. 2004, ApJ, 615, 485
- (43) Suh, K.-W., & Kwon, Y.-J. 2011, MNRAS, 417, 3047
- (44) Suh, K.-W., & Kwon, Y.-J. 2013, ApJ, 762, 113
- (45) Suh, K.-W. 2014, Journal of the Korean Astronomical Society, 47, 219
- (46) Szczerba, R., Siódmiak, N., Stasińska, G., & Borkowski, J. 2007, A&A, 469, 799
- (47) van der Veen, W. E. C. J., & Habing, H. J. 1988, A&A, 194, 125
- (48) van Hoof, P. A. M., Oudmaijer, R. D., & Waters, L. B. F. M. 1997, MNRAS, 289, 371
- (49) Vassiliadis, E., & Wood, P. R. 1993, ApJ, 413, 641
- (50) Vassiliadis, E., & Wood, P. R. 1994, ApJS, 92, 125
- (51) Volk, K. M., & Kwok, S. 1989, ApJ, 342, 345
- (52) Volk, K. M. 1992, ApJS, 80, 347
- (53) Wood, P. R. 1990, in From Miras to Planetary Nebulae: Which Path Evolution, ed. M. O. Minnessier & A. Omont (Gif sur Yvette: Editions Frontiéres), 67
- (54) Yoon, D.-H., Cho, S.-H., Kim, J., Yun, Y., & Park, Y.-S. 2014, ApJS, 211, 15
- (55) Zuckerman, B. 1978, in Proceedings of the Symposium, Planetary Nebulae (Dordrecht: D. Reidel Publishing Co.), 305