Systematic trends in beta-delayed particle emitting nuclei: The case of p emission from 21Mg
Abstract
We have observed -delayed and p emission from the proton-rich nucleus 21Mg produced at the ISOLDE facility at CERN. The assignments were cross-checked with a time distribution analysis. This is the third identified case of p emission. We discuss the systematic of beta-delayed particle emission decays, show that our observed decays fit naturally into the existing pattern, and argue that the patterns are to a large extent caused by odd-even effects.
keywords:
Beta decay , multi-particle emission , 21Mg1 Introduction
Beta-delayed particle emission is an important decay mode for exotic nuclei and allows many aspects of nuclear structure to be probed, see the two recent reviews [1, 2] for a comprehensive overview. We report here the first observation of emission as well as the rare p emission from the nucleus 21Mg. Based on these observations we have identified systematic patterns in the occurence of beta-delayed particle decays in proton-rich nuclei. We shall present and discuss these as well.
A detailed description of beta-delayed particle emission must include consideration of local nuclear structure effects, but its occurence is in general dominated by the available energy, i.e. the difference between the -value and the particle separation energy. As is well known, for an isobaric chain with mass number the values will increase and the proton and neutron separation energies decrease as one moves from the beta stability line towards the driplines (modulated for even by the pairing term). The particle separation energy tends for light nuclei to be minimal for nuclei, but the minimum moves towards more proton rich nuclei and reaches the proton dripline at . This causes a clear pattern for beta-delayed multi-particle emission, with 2p and 3p taking place close to the proton dripline, 2n, 3n etc starting from about halfway to the neutron dripline, while 2 is seen from nuclei close to stability. (To the extent that these decays are sequential one can of course regard them as decays to the unstable nuclei.) Similar patterns appear in beta-delayed single-particle emission although exceptions occur for the very light nuclei such as the large values for nuclei and the emission from neutron-rich N-isotopes.
We focus first on the multi-particle p decay and return in the discussion to the general patterns of beta-delayed particle emission.
2 Experimental results
The 21Mg activity was produced at the ISOLDE facility at CERN by a 1.4 GeV proton beam impinging upon a SiC target. The produced atoms were extracted, laser ionized, accelerated to 60 keV, led through a mass separator into the experimental set-up, and implanted in the window of a gas-Si telescope opposed by a Si(DSSSD)-Si telescope. A full account of the experimental procedure is given in [3]. The collected source also contained a substantial amount of 21Na.
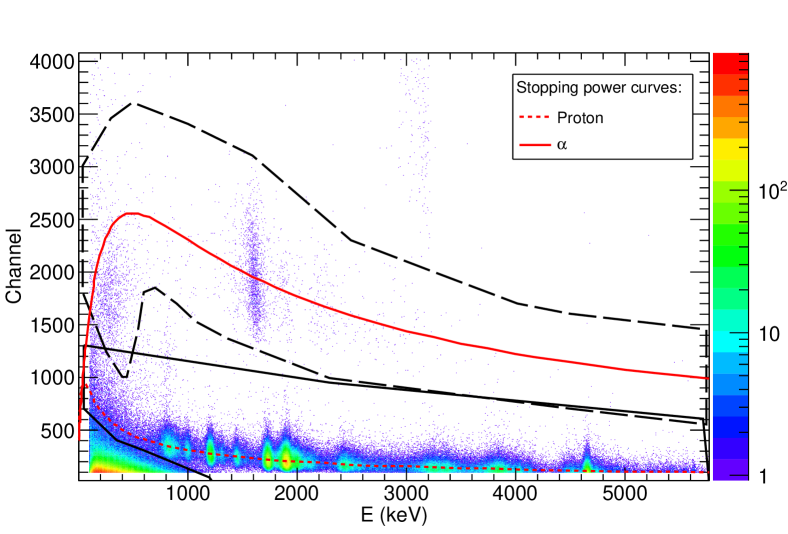
The data from the Gas-Si charged particle telescope are presented as a - spectrum in Fig. 1. Rescaled stopping powers [4] for particles and protons (evaluated for silicon, but representing the total energy loss in the collection foil, the gas detector and the Si dead layer) are drawn in the figure and match the data well, indicating the presence of decays on top of the previously established [5, 6] . The -particle component in the lower left corner of Fig. 1 overlaps with protons below 1150 keV and -particles below 700 keV making particle identification difficult at low energy. The -particles are stopped in the DSSSD and cannot be separated there from the more intense proton branches.
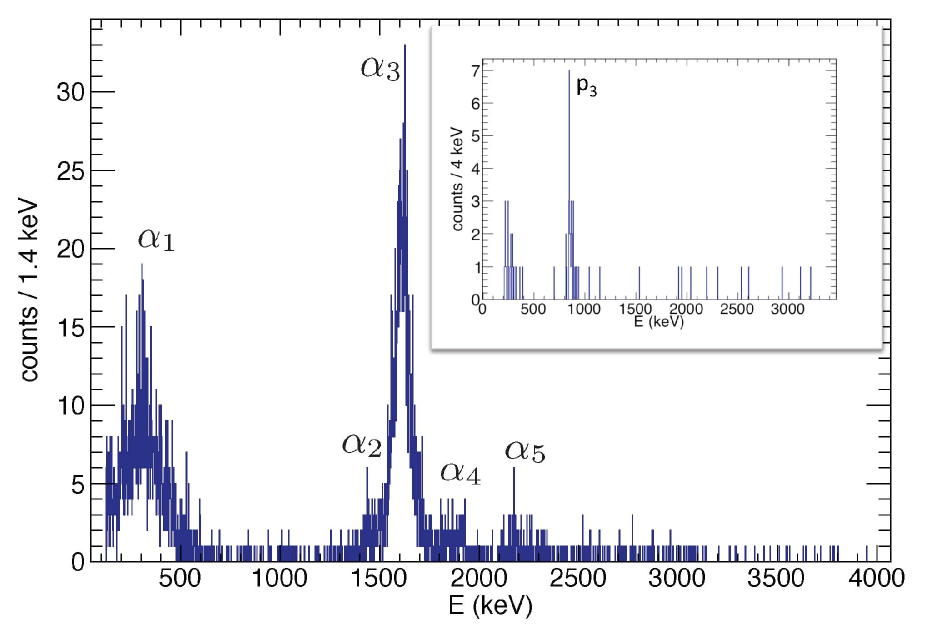
The -particle spectrum extracted from the gas-telescope by applying the gate drawn as a dashed black closed line in Fig. 1 is shown in Fig. 2. Apart from a remaining background component at low energy five branches can be identified in the spectrum. The , , and lines naturally fit into the 21Mg scheme put forward in [3] as -delayed single branches (see [3] for the full decay scheme). The line, with measured laboratory energy 714(12) keV, does not fit with a transition between known levels in 21Na and 17F. However, it does agree with a known -particle transition from 20Ne to 16O observed in the decay of 20Na [7] with a laboratory energy of 714(4) keV.
A conclusive particle identification for was not possible from the - plot, but strong support for the above assignment comes from the observation of a coincident line in the DSSSD detector, assigned to be the preceding proton. This proton branch p3 (the numbering is chosen to be consistent with the full data set discussed in [3]) is displayed as the inset in Fig. 2. From the measured energy we deduce (p3) = 919(18) keV which leads to the interpretation of and p3 as being due to p decay of 21Mg through the isobaric analogue state (IAS) at 8.975 MeV in 21Na via proton emission to the 5.621 MeV level in 20Ne and finally emission to the ground state of 16O. The total branching ratio of this decay branch is found to be . This proton branch from the IAS has not been observed earlier and -emission from excited states of 21Na have only been reported in one earlier experiment [8].
2.1 Time distribution analysis
As mentioned above our data are contaminated by 21Na, other small contaminants could in principle also be present. The observed and p branches are quite weak, so a cross-check of the assignment is valuable. This is done by considering the time distribution of the events.
Several factors influence the time distribution of the recorded 21Mg events, see [3] for an exhaustive discussion. We shall use as reference the experimental time distribution recorded for events within the proton gate in Figure 1 and with energy above 1150 keV. The energy gate ensures that the reference distribution only contains protons from the decay of 21Mg. The halflives of 21Mg and 21Na, 122(2) ms and 22.49(4) s [9], differ greatly as do the corresponding time distributions. Other contaminants are also expected to differ from 21Mg.
Some of the branches have quite low statistics and we therefore compare their time distribution directly to the reference distribution. This can be done very efficiently with the empirical distribution function (EDF) statistics [10] that give powerful goodness-of-fit tests. The basic principle is to compare the shape of the data sample to the reference shape by measuring the distance between the two cumulated distributions. For experimental and reference distributions with values and in bin , the three most frequently used EDF statistics are [11] Kolmogorov-Smirnov
Cramer-Von Mises
and Anderson-Darling
where is the total number of counts and is the probability to be in bin in the reference distribution. The second column of Table 1 gives the 95% confidence levels for the three EDF statistics obtained through Monte Carlo simulation, values below these levels indicate the time distribution for the different lines are consistent with the one of 21Mg. More details on the confidence levels are given in [3].
| 95% c.l. | p3 | |||||
|---|---|---|---|---|---|---|
| D | 1.31 | 1.22 | 1.64 | 0.64 | 1.08 | 0.81 |
| W2 | 0.46 | 0.33 | 0.41 | 0.05 | 0.33 | 0.12 |
| A2 | 2.49 | 1.46 | 3.61 | 0.64 | 1.73 | 0.80 |
The EDF test results in Table 1 show that all lines, except for , agree with the reference distribution. The agreement is particularly good for the strongest line, . As mentioned above there is a contamination of -particles in that come from both 21Na and 21Mg. We would therefore expect the time distribution for to be mainly that of 21Mg with a small component of 21Na. The EDF tests are sufficiently sensitive to see the effect of the small 21Na contribution. We expect, and do observe, that the upper part of the distribution has smaller contamination level. The fact that the coincident p3 distribution is consistent with being from 21Mg implies that we can safely assign the p transition, as well as all transitions, to the decay of 21Mg.
3 Discussion
3.1 Other p cases
The p decay mode is very rare as described in [1] with only two previously established cases: 9C and 17Ne. For two further candidates, 13O and 23Si, the decay mode has not been seen so far. Most searches have concentrated on seeing particle emission from the IAS in the beta-daughter due to the large beta-strength to this state.
The case of 9C is special in that all states populated in the beta-daughter 9B break-up into two -particles and a proton, see [12] and references therein. This could be presented as a 100% branching ratio for p or p decay to 4He, but the decays of the nuclei are special in several aspects [1, 2] and are not typical for this decay mode.
Although p has not been observed so far for 13O it must occur since -decays to the IAS in 13N have been observed [13] and close to half of the IAS decays are known from reaction experiments [14] to go via proton-emission to unbound states in 12C or -emission to proton unbound states in 9B. Actually, the final state in both cases will be a proton and three -particles which makes the decay more challenging to observe. The total branching ratio for the decay mode can be estimated to be .
For 17Ne both decay orderings, p and p, have been observed [15] with a total branching ratio for the decay mode of . All observed decays proceed through the IAS in 17F and go to the final nucleus 12C.
Adding now our observation of 21Mg(p)16O it is striking that all cases go through an -conjugate nucleus, namely 8Be, 12C, 16O and 20Ne respectively. Before drawing any firm structure conclusions we shall consider the broader systematics of beta-delayed particle emission in nuclei.
3.2 Systematics of beta-delayed decays
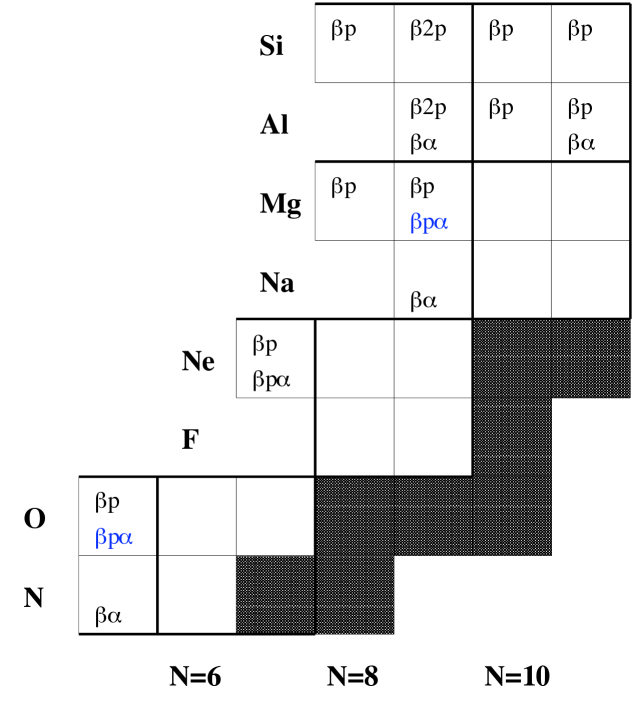
Similar patterns also appear in other beta-delayed particle decays (see [1, 9] for more data and for references to the original work). One closely related example is decays that occur for all bound , nuclei up to : 8B, 12N, 20Na, 24Al, 28P, 32Cl, 36K and 40Sc. The p decays are well established [1] to occur strongly in , nuclei. The 2p decays of 22Al and 26P and the 3p decay of 31Ar [16] also all end up in an -conjugate nucleus. The decays observed for the elements N to Si are shown in figure 3. Note that the and p modes are not marked explicitly when the p or 2p modes also occur.
In the following we shall argue that the observed patterns are likely (except for the very lightest nuclei) to be related to odd-even effects rather than -cluster structure. We start by considering the systematics of -values for nuclei with as illustrated in figure 4. Even though many effects contribute to the masses in this region, a liquid drop estimate reproduces the trend of for the odd-A nuclei with (dashed line) where only the Coulomb term enters, as well as for (dotted line) where the asymmetry term also contributes. Note that in the latter case varies little for between 25 and 50.
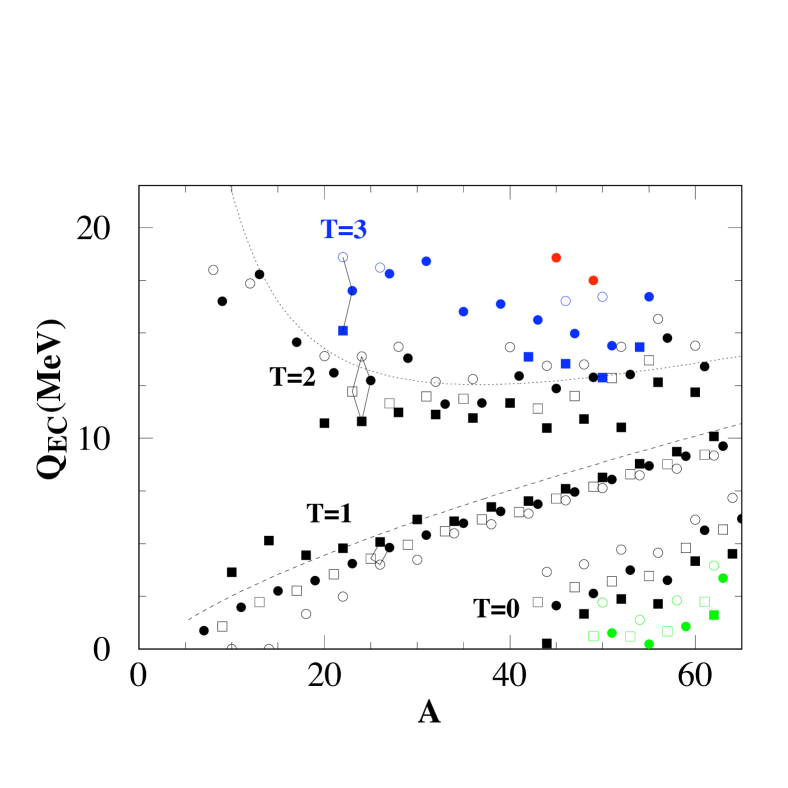
The experimental data show that the -values are roughly the same for each “quartet” of four nuclei that, as illustrated in the left panel of figure 5, have proton and neutron numbers (Z,N), (Z,N+1), (Z-1,N), (Z-1,N+1) where both Z and N are even. This is pronounced for quartets where the even-even nucleus has , and holds to a lesser degree also for for mass numbers up to 40. The reason for this is that the two odd-A nuclei are at the same distance from the beta-stability line and therefore have about the same -value, as also shown by the liquid drop estimate. Without a pairing term in the liquid drop formula the -value for the even-even nucleus would be larger and the odd-odd smaller, but the odd-even effects counteracts this and as can be seen from figure 4 the magnitudes are even reversed for most nuclei. For the quartet with (and ) the odd-odd nucleus has and is therefore extra bound, this happens to result in -values that are almost the same for all four nuclei. The quartets are indicated in figure 3 by thicker lines.

The observed decay patterns now follow from the energetics and are illustrated in the right panel of figure 5. The decays should occur in odd-odd nuclei, since they have slightly higher -values and the daughter alpha particle separation energies tend to be smallest here. The p decays need low proton separation energies in the daughter nucleus and therefore are more prominent for even Z, starting (as one goes from stability towards the proton dripline) in an even-odd nucleus. The p decay should be favoured in even-odd nuclei, and 2p and 3p decays should occur in odd-odd and even-odd nuclei, respectively, by extending these arguments.
Experimentally, the , p and p decays appear first in the quartets where the even-even nucleus has and the odd-odd nucleus , but p occurs also in 59Zn, 65Ge and heavier nuclei. The beta-delayed multi-proton decays appear in more exotic nuclei, but it is noteworthy that in these nuclei only has been observed in the odd-odd 22Al.
Similar patterns can be expected for -delayed particle decays, although the grouping of -values is less pronounced here. The and n decay modes will in general occur further away from the beta-stability line.
4 Conclusion
Our study of the decay of 21Mg has given the first evidence for the occurence of the and p decay modes in this nucleus. The assignment of these decay modes to 21Mg has been verified through statistical tests of the time distribution of the events. The occurence of these decay modes in the decay of 21Mg fits naturally into the systematics of previously observed -delayed decays. We presented a brief overview of this systematics and argued that it can be explained by the variation in decay energy due to odd-even effects and that there is no need to invoke specific structure effects such as alpha-clustering in spite of -conjugate nuclei occuring often as final state nuclei.
This interpretation can be tested when new instances of these exotic decays are discovered. The p decay mode may not occur in heavier nuclei than 21Mg (the -value becomes more than 10 MeV in 61Ge, but the Coulomb barrier for -particle emission is substantial then), but may be found also in the nuclei 23Si, 27S, 31Ar etc. If found in 20Mg it may help to quantify the 15O(,)19Ne reaction rate [17]. A general overview of which energetically allowed decays have not yet been observed was given in [1].
Acknowledgements
We acknowledge support from the European Union Seventh Framework through ENSAR (contract no. 262010) and by the Spanish research agency under number FPA2012-32443. We thank Oliver Kirsebom for discussions.
References
References
- [1] B. Blank and M. J. G. Borge, Prog. Part. Nucl. Phys. 60 (2008) 403.
- [2] M. Pfützner, L.V. Grigorenko, M. Karny, and K. Riisager, Rev. Mod. Phys. 84 (2012) 567.
- [3] M.V. Lund, M.J.G. Borge, J.A. Briz, J. Cederkäll, H.O.U. Fynbo, J.H. Jensen, B. Jonson, K. L. Laursen, T. Nilsson, A. Perea, V. Pesudo, K. Riisager and O. Tengblad, to be submitted.
- [4] J.F. Ziegler, SRIM, http://srim.org/
- [5] R.G. Sextro, R. A. Gough and J. Cerny, Phys. Rev. C 8 (1973) 258.
- [6] J.-C. Thomas PhD thesis, University of Bordeaux, 2003.
- [7] K.L. Laursen, O.S. Kirsebom, H.O.U. Fynbo, A. Jokinen, M. Madurga, K. Riisager, A. Saastamoinen, O. Tengblad and J. Äystö, Eur. Phys. J. A (2013) 49: 79.
- [8] W. Gruhle and B. Kober, Nucl. Phys. A 286 (1977) 523
- [9] G. Audi, F.G. Kondev, M. Wang, B. Pfeiffer, X. Sun, J. Blachot and M. MacCormick, Chin. Phys. C 36 (2012) 1157.
- [10] M.A. Stephens, p. 97 in Goodness-of-fit techniques, eds R.B. D’Agostino and M.A. Stephens (Marcel Dekker, New York, 1986).
- [11] V. Choulakian, R.A. Lockhart and M.A. Stephens, Canad. J. Statist. 22 (1994) 125.
- [12] E. Gete, L. Buchmann, R. E. Azuma, D. Anthony, N. Bateman, J. C. Chow, J. M. D’Auria, M. Dombsky, U. Giesen, C. Iliadis, K. P. Jackson, J. D. King, D. F. Measday, and A. C. Morton, Physical Review C 61 (2000) 064310.
- [13] H. H. Knudsen, H. O. U. Fynbo, M. J. G. Borge, R. Boutami, P. Dendooven, C. Aa. Diget, T. Eronen, S. Fox, L. M. Fraile, B. Fulton, J. Huikary, H. B. Jeppesen, A. S. Jokinen, B. Jonson, A. Kankainen, I. Moore, A. Nieminen, G. Nyman, H. Penttilä, K. Riisager, S. Rinta-Antila, O. Tengblad, Y. Wang, K. Wilhelmsen, and J. Äystö, Physical Review C 72 (2005) 044312.
- [14] F. Ajzenberg-Selove, Nuclear Physics A 523 (1991) 1.
- [15] J. C. Chow, J. D. King, N. P. T. Bateman, R. N. Boyd, L. Buchmann, J. M. D’Auria, T. Davinson, M. Dombsky, E. Gete, U. Giesen, C. Iliadis, K. P. Jackson, A. C. Morton, J. Powell, and A. Shotter, Physical Review C 66 (2002) 064316.
- [16] G.T. Koldste, B. Blank, M.J.G. Borge, J.A. Briz, M. Carmona-Gallardo, L.M. Fraile, H.O.U. Fynbo, J. Giovinazzo, J.G. Johansen, A. Jokinen, B. Jonson, T. Kurturkian-Nieto, T. Nilsson, A. Perea, V. Pesudo, E. Picado, K. Riisager, A. Saastamoinen, O. Tengblad, J.-C. Thomas, and J. Van de Walle, Physics Letters B 737 (2014) 383.
- [17] C. Wrede, PoS (NIC XIII) 039, Proceedings of XIII Nuclei in the Cosmos