A High Resolution Wide-Field Radio Survey of M51
Abstract
We present the highest resolution, wide-field radio survey of a nearby face-on star-forming galaxy to date. The multi-phase centre technique is used to survey the entire disk of M51 (77 square arc minutes) at a maximum resolution of 5 milli-arcseconds on a single 8 hr pointing with the European VLBI Network at 18 cm. In total, 7 billion pixels were imaged using 192 phase centres that resulted in the detection of six sources: the Seyfert nucleus, the supernova SN 2011dh, and four background AGNs. Using the wealth of archival data available in the radio (MERLIN and the VLA), optical (Hubble Space Telescope) and X-rays (Chandra) the properties of the individual sources were investigated in detail. The combined multi-wavelength observations reveal a very complex and puzzling core region that includes a low-luminosity parsec scale core-jet structure typical of AGNs, with evidence for a lateral shift corresponding to 0.27c. Furthermore, there is evidence for a fossil radio hotspot located 1.44 kpc from the Seyfert nucleus that may have resulted from a previous ejection cycle. Our study provides measures of the supernova and star-formation rates that are comparable to independent studies at other wavelengths, and places further limits on the radio and X-ray luminosity evolution of the supernovae SN 1994I, SN 2005cs and SN 2011dh. The radio images of background AGN reveal complex morphologies that are indicative of powerful radio galaxies, and confirmed via the X-ray and optical properties.
keywords:
galaxies: Seyfert - galaxies: individual (M51) - techniques: radio astronomy - interferometric1 Introduction
The formation of stars is a fundamental astrophysical process that takes place in almost all galaxies along the Hubble sequence and as such plays a major role in galaxy evolution. Star formation can occur in isolated areas or over the entire galaxy, resulting in 6-7 orders of magnitude variation in galaxy star formation rates (Kennicutt, 1998). Galaxies that are continuously forming stars over an entire galaxy (hereafter star-forming galaxies) typically host rich populations of young stars and star clusters, HII regions, giant molecular clouds, and supernova remnants (SNRs). Furthermore, it is not uncommon for star-forming galaxies to host low luminosity Seyfert AGN at their cores (e.g. Ford et al. 1985; Pellegrini et al. 2000; Lenc & Tingay 2009; Perez-Torres et al. 2010; Rampadarath et al. 2010; Paggi et al. 2013; Panessa & Giroletti 2013), suggesting possible connections between star formation and low luminosity AGN activity in these galaxies (e.g. Netzer 2009).
Nearby star-forming galaxies are ideal laboratories for understanding the nature of supernovae (SNe), SNRs, and the nuclear environment on parsec and sub-parsec scales through the use of wide-field, high resolution radio observations. With multi-epoch radio monitoring, it is possible to construct the star formation and SNe history of these galaxies. This was attempted for the starburst galaxy NGC 253 by Rampadarath et al. (2014), using data spanning 21 years. Similar studies have been conducted of nearby edge-on, star-forming galaxies: M82 (Pedlar et al., 1999; McDonald et al., 2002; Beswick et al., 2006; Fenech et al., 2010); Arp 220 (Rovilos et al., 2005; Lonsdale et al., 2006; Parra et al., 2007; Batejat et al., 2012); Arp 299 (Ulvestad, 2009; Romero-Cañizales et al., 2011; Bondi et al., 2012); NGC 4945 (Lenc & Tingay, 2009); NGC 253 (Ulvestad & Antonucci, 1997; Tingay, 2004; Lenc & Tingay, 2006); and M31 (Morgan et al., 2013), and nearby face-on, spiral galaxies: M83 (Turner & Ho, 1994; Cowan et al., 1994; Maddox et al., 2006; Long et al., 2014); M51 (Crane & van der Hulst, 1992; Turner & Ho, 1994; Maddox et al., 2007); NGC 300 (Pannuti et al., 2000); NGC 7793 (Pannuti et al., 2002); and NGC 6946 (Lacey et al., 1997). Furthermore, there have been numerous surveys of face-on, spiral galaxies with VLBI, focussing on the nuclear regions (e.g. Bietenholz et al. 2004; Giroletti & Panessa 2009; Bontempi et al. 2012; Panessa & Giroletti 2013; Doi et al. 2013).
Here, the results of the highest resolution, wide-field radio survey of a nearby, grand design spiral galaxy are presented. The target for this survey is the Whirlpool galaxy, (aka M51a, NGC 5194), that is currently undergoing an interaction with a smaller companion, M51b (aka NGC 5195). At a distance of 8.4 0.7 Mpc (Vinkó et al., 2012) and with a nearly face-on orientation, M51 is ideal for population and morphology studies at all wavelengths. Like most spiral galaxies M51a is actively forming stars predominantly (but not exclusively) within its spiral arms (Calzetti et al., 2005; Kaleida & Scowen, 2010), with a slightly enhanced formation of young, massive star clusters towards M51b (Kaleida & Scowen, 2010). Furthermore, in the last 70 years M51a and M51b have hosted four optically observed SNe: the Type Ia SN 1945A (Kowal & Sargent, 1971); the Type Ib/c SN 1994I (Puckett et al., 1994); the Type Ib/c SN 2005cs (Muendlein et al., 2005); and the Type IIb SN 2011dh (Griga et al., 2011). In addition, high resolution radio observations of the nuclear region with the VLA reveals the presence of a bidirectional jet, which is associated with a low-luminosity Seyfert 2 AGN, located within the nucleus of M51a, that interacts with the surrounding interstellar medium (Crane & van der Hulst, 1992; Bradley et al., 2004; Maddox et al., 2007).
The first high-resolution radio survey of M51a was performed by Maddox et al. (2007) at 20 and 6 cm, with the VLA. With a resolution of 1.5 1.2at both wavelengths, Maddox et al. (2007) detected 107 compact radio sources, distributed throughout the disk of M51a but predominantly concentrated within the inner 2 kpc nuclear region. Maddox et al. (2007) compared the results of the radio observations with multi-wavelength observations and found of the 107 radio sources: 44 radio sources with large HII counterparts; 24 with stellar cluster counterparts; 13 with X-ray counterparts, most probably X-ray binaries or micro-blazars; and six radio sources associated with H emission, possibly young SNRs with resolved shells and the remaining as either background AGNs or unknown. Maddox et al. (2007) estimated the age for the SNRs to be 2000-3300 yr.
Through application of the technique of wide-field VLBI, with the European VLBI Network (EVN), we surveyed the full disk of M51 () for faint, compact radio sources at 18 cm. Section 2 describes the observations, wide-field correlation, calibration and data reduction methods that were employed within this study. In Section 3, the wide-field VLBI imaging, source detection methods, and primary beam correction are discussed. Radio images of the sources detected are also presented. The multi-wavelength and multi-resolution ancillary data (radio, x-rays and optical) used in this study are presented, including data reduction steps, in Section 4. Discussion of the sources detected are given in Section 5, including comparisons with the ancillary data and previous results obtained from the literature. Finally, the study is concluded in Section 6. For power law spectra we adopt the convention that .
2 Observations, Correlation and Data Reduction
2.1 Observations
M51 was observed on 2011-11-7 for 8 hrs (UTC: 01:30 - 09:30) at a wavelength of 18 cm with a single target pointing of the EVN. The experiment was performed using the Effelsberg (Ef), Jodrell Bank 76 m Lovell dish (Jb1), a single Westerbork dish (Wb), Medicina (Mc), Onsala 25 m (On), Svetloe (Sv), Zelenchukskaya (Zc), Badary (Bd), Urumqi (Ur), and Shanghai (Sh) antennas. During the observation, 5 minute scans of M51 (centred on: RA = 13h29m 52.698s; Dec = +47∘11′ 42′′.930 [J2000.0]) were scheduled, alternating with 1 minute scans of a phase reference calibration source, J1332+4722 (RA = 13h 32m 45.246424s; Dec = +47∘ 22′ 22′′.667700 [J2000.0]) located 31′ from M51.
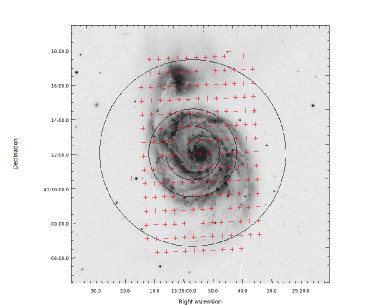
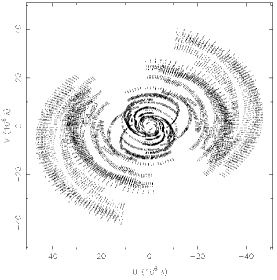
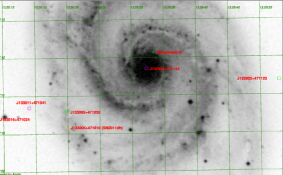
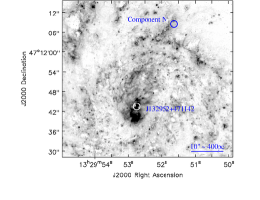
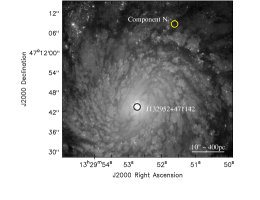
The VLBI data were recorded in 816 MHz sub-bands, dual polarisation with 2-bit data sampling at the Nyquist rate, resulting in a total data rate of 1024 Mbps, producing a 1 sensitivity (at the pointing centre) of 6Jy. Figure 1 shows an optical image of M51 overlaid with the sensitivity contours of the EVN observation, taking into account the different primary beam of each antenna. The angular size of M51 () allows most of the galaxy to lie within the primary beam of the 100 m Effelsberg antenna (). Figure 2 shows the coverage of the EVN observation. The maximum projected baseline is approximately 45 M (Jb1-Sh), while the shortest projected baseline (Ef-Wb) is 1.5 M, hence structures with an angular size larger than 150 mas (5.7 pc at the distance of M51) are resolved-out (i.e. structures with intensity variations on larger angular scales are not detected).
2.2 Correlation
To survey the entire disk of M51 for radio sources with the full capabilities at VLBI resolution requires application of the technique of multi-phase centre correlation (Deller et al., 2011; Morgan et al., 2011). This was achieved through the use of the DiFX software correlator (Deller et al., 2007, 2011), at the Max-Planck Institue for Radio Astronomy, Bonn, Germany, as at the time of this experiment the JIVE software correlator (SFXC) was not offering multi-phase centre correlation111The SFXC is currently capable of correlating multiple phase centres and this is offered as a standard EVN mode.. Prior to correlation, the data were shipped via courier from each station to Bonn, where the correlation was performed with a high performance computer cluster comprising 60 computer nodes (8 cores each).
The correlation was initially performed with sufficient frequency and time resolution (488 Hz and 1 ms) to restrict amplitude losses below at a radius of 6on the longest baseline due to bandwidth and time smearing222http://www.atnf.csiro.au/people/Emil.Lenc/Calculators/wfcalc.php. Then using the simultaneous multi-phase correlation method, the field was separated into 192 individual phase centres, allowing the area around each phase center to be imaged separately. The locations of the phase centres are shown in Figure 1.
To minimise cumulative amplitude errors to less than 5 due to non-coplanar baselines, bandwidth, and time-average smearing on the longest baseline per phase centre, each sub-band (of 16 MHz bandwidth) was averaged to 128 channels ( = 125 kHz) and time resolution of 1 second, resulting in a data size of 41 GB per phase centre. The correlated data were transferred to the iVEC Petabyte Data Store333http://www.ivec.org/ located at Curtin University, Perth, Western Australia, using the network data transfer protocol gridFTP444http://www.globus.org/toolkit/docs/latest-stable/gridftp/.
2.3 Data Reduction
2.3.1 Data Preparation
During correlation, the clock at the Badary antenna experienced a glitch that caused it to skip ahead by 1s. This resulted in a separation of the final correlated data per phase centre, at the time of the clock skip, into two individual FITS files. Concatenation of the two correlated files per phase centre to form the individual visibility FITS via the aips task fitld takes 2 hours on a standard iCore 7 desktop computer. Extending this process to 192 phase centres would require more than 300 hrs of computing time, which is almost tripled when considering read and write time of the FITS data to disk.
In order to concatenate, calibrate and image the 192 phase centres in a time that is suitable for this project, the Curtin ATNF VLBI Experiment (cave), which is a high performance computing cluster located at the Australia Telescope Compact Array (ATCA), Narrabri, NSW was used. cave comprises 14 computer nodes, where the nodes are quad-core 2.7 GHz AMD Sunfire x86 machines, with 16 GB memory and 400 GB disk capacity each. The main disk space (8 TB 3) is located on a single centralised node (hereafter, cave-store). The cluster is owned by Curtin University and operated by the Australia Telescope National Facility (ATNF). To use the multiple nodes of cave effectively for the concatenation, we made use of the ParselTongue scripting language (Kettenis et al., 2006). ParselTongue allows the execution of multiple aips tasks simultaneously on a number of remote computers via the paralleltask module.
The correlated datasets were copied from the iVEC Petabyte Data Store to the 8 TB data storage on cave-store. Before starting the concatenation process, the ParselTongue server is started on the individual nodes555See the ParselTongue online documentation http://www.jive.nl/jivewiki/doku.php. Executing the ParselTongue script on cave-store begins by copying the datasets to the individual nodes, such that the datasets for the Nth phase centre is sent to the Nth node. After the data are copied, fitld loads and concatenates both datasets to aips and the result written to disk (via fittp), copied to cave-store and eventually is copied to iVEC. Note, the data processing on the individual nodes is executed in parallel.
Due to the limited storage space and network connection between iVEC and cave-store, the datasets were separated into 1 TB groups ( 25-30 phase centres) for processing. The time taken to process 1 TB of data on two nodes on cave was 14 hrs666The processing time per 1 TB group can be speeded up by using multiple nodes for the data processing i.e. three nodes would reduce the time to 9 hrs, four nodes to 7 hrs etc. However, cave, is a shared cluster and only two nodes were fully available for this project at any time., resulting in a total time of 87 hrs to concatenate the 192 phase centres.
2.3.2 Calibration
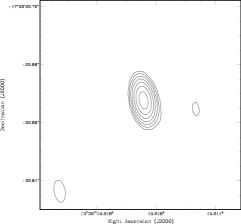
The data reduction and calibration were performed using the data reduction package aips. Prior to calibration, flagging of data during times at which each of the antennas were known to be slewing and time ranges that contained known bad data was carried out via application of flag files and information provided in the observing logs. Corrections to the amplitudes in cross-correlation spectra from the auto-correlations were obtained via accor. The amplitude calibration was obtained through application of antenna system temperatures (in Kelvin) measured during the observations, along with the gain (in Janskys per Kelvin) for each antenna. Following the amplitude calibration, a single value of the delay (i.e. phase against frequency) was determined for each antenna, polarization, and 16 MHz sub-band using two minutes of data on the bright radio source 3C 345 (aips task fring). Global fringe-fitting solutions were determined for J1332+4722 (aips task fring) with a one minute solution interval, finding independent solutions for each of the 16 MHz sub-bands. The delay and phase solutions were examined and, following editing of bad solutions, applied to J1332+4722. The J1332+4722 data were then exported to difmap (Shepherd, 1997), where the data were vector-averaged over 30 s, flagged of bad data, and imaged using standard imaging techniques (deconvolution and self-calibration of both phase and amplitude). The resulting image of J1332+4722 is shown in Figure 3. The image shows no evidence for extended structure on these baselines at this frequency to a dynamic range of 2500, for regions in the image away from the inner side-lobes around the source. The final calibration solutions (phase and amplitude) from J1332+4722 were exported via the difmap extension, cordump777http://www.atnf.csiro.au/people/Emil.Lenc/tools/Tools/Cordump.html (Lenc & Tingay, 2009) to an aips-compatible solution table. The solution table was then transferred to aips and applied to all sources in the dataset. The final calibrated J1332+4722 data were also used to derive a bandpass calibration via the aips task bpass. The edge channels of each band were flagged (5 channels from both the lower and upper edge of each 128 channel band). The final calibration solutions were then applied for a first imaging pass for each phase centre.
3 Imaging, Source Detection and Results
3.1 Wide-field VLBI Imaging
Prior to imaging, data affected by RFI were manually flagged via the aips tasks spflg and editr. Data received by the Mc antenna were found to be corrupted by RFI. Initial attempts at selective RFI removal were found to be excessively time consuming and the entire antenna was flagged, improving the final sensitivity by . Furthermore, data with coordinate k which are susceptible to RFI due to the low fringe rate were also flagged. The flag tables along with the final calibration and bandpass tables were copied and applied to all phase centres via split.

Initial imaging was restricted to the four European antennas (Ef, Jb1, Wb and On) resulting in a maximum baseline of 7.5 M (resolution of 27.6 mas). This allowed a reduction in the number of channels to 32 per sub-band and increased time averaging to 5 seconds, while keeping the total amplitude loss due to time and bandwidth smearing . Moreover, the decreased resolution lowered the number of pixels required to image a radius of 21per phase centre and, therefore, the data size per phase centre, thus reducing the computation required to image the phase centres. Dirty maps of all phase centres were produced via the aips task imagr, using parameters: cellsize = 2.7 mas; image size = 16384 16384 pixels; and natural weighting. Finally, 512 pixels were removed from the image edges, to reduce aliasing effects. This resulted in image sizes covering 41 per phase centre. The aips task imean was then used to obtain the RMS noise levels across the entire image, allowing comparisons with the peak pixel brightness.
The distribution of the peak S/N for the 192 phase centres is displayed in Figure 4. Six phase centres were found to have a peak S/N , with the remaining phase centres distributed between 5 and 6.15. While the six peak S/N are indeed real detections (and are discussed in Section 5), it is possible that there are real detections with S/N .
3.2 Source Identification
3.2.1 Defining the detection threshold
Morgan et al. (2013) addressed the problem of determining the likelihood that a bright pixel in a large VLBI image is a source (rather than a Gaussian noise spike). Consider a VLBI image of pixel size . Assuming that the noise in the image is Gaussian distributed and is free from RFI or emission from real sources, the probability that a pixel exists with S/N greater than some threshold, , can be shown to be
| (1) |
where erf(x) is the error function associated with the Gaussian distribution. Equation 1 is the probability that an image pixel of S/N is above a given threshold, assuming the noise is Gaussian distributed. Thus, pixels found above this threshold can be considered as being from real sources. The reciprocal of Equation 1 is therefore the equivalent frequency of occurrence, , which is a measure of the total number of image pixels such that a single pixel will have S/N equivalent to .
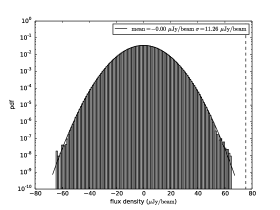
Figure 5 plots the pixel distribution of a single 15360 pixels 15360 pixels wide-field VLBI image, representing a blank region of the sky, 5 arcminutes from the pointing centre. The field covered by this image was found to be devoid of radio sources in the FIRST (Becker et al., 1995) and Maddox et al. (2007) radio catalogues888See Section 5.1 for a description of these radio source catalogues, and lacked pixels with a flux density above the Gaussian noise threshold. The distribution follows a Gaussian distribution (the solid line), suggesting that the pixels of the wide-field VLBI images are Gaussian distributed999Note that this is only valid if the data are free from real sources and RFI (achievable through careful flagging). This is shown empirically in Morgan et al. (2013) and Figure 5.
Since multiple phase centres provide a method to image a large field through smaller fields, the total number of pixels is . By assuming the pixel brightness distribution in the wide-field images is Gaussian distributed, from Equation 1, one 5.8 pixel would be expected on average in every 15360 pixel 15360 pixel image and one 6.7 pixel in 192 images, assuming no astronomical sources. This is in agreement with Figure 5, which clearly shows there are no pixels on either ends of the distribution beyond 6.7. Thus, any peak flux density with S/N is more likely to be a source than a noise spike (assuming real sources are the only thing that could make the distribution non-Gaussian).
3.2.2 Using Prior Catalogues to Search for Faint Sources
The detection threshold calculated in Sect. 3.2.1, assumes that the image pixels are independent. This is not the case, as pixels within an area defined by the synthesised beam may be correlated. With a cellsize of 2.7 mas and resolution of 27.6 mas, gives 100 pixels per synthesized beam, reducing the threshold to 5.1 in a single 15360 pixel 15360 pixel image and one 6.0 pixel in 192 images.
However, there is a possibility that real sources exist in the wide-field images below this limit and are treated as a noise-spike. To determine this probability the likelihood ratio (LR) method described by Morgan et al. (2013) is applied. This method calculates the likelihood that each pixel in a VLBI image is associated with a catalogued source of known position, size and flux density (the alternative hypothesis, ), or simply a noise spike (the null hypothesis, ). This calculation is made assuming the noise in each image is Gaussian distributed and the RMS of the noise does not vary across an individual image. This method generates LR images corresponding to the input VLBI images, where the pixel values correspond to the likelihood that the pixel is related to a catalogued source (see Section 2.5 of Morgan et al. 2013 for a detailed description of this method).
We use this method to search for VLBI counterparts of sources detected in M51 by the VLA FIRST survey (Becker et al., 1995) and Maddox et al. (2007) using the VLA in A configuration. In their analysis, Morgan et al. (2013) found that the results of the LR test did not give a significant advantage over simply detecting bright pixels due to the poor constraints on the position given by the lower resolution catalogues they used. Given the better positional accuracy provided by the VLA FIRST (Becker et al., 1995) and the Maddox et al. (2007) surveys, it was deemed worthwhile to attempt to use this method.
However, similar to Morgan et al. (2013) we found that the LR of a bright pixel was more dependent on the VLBI pixel S/N (i.e. p()), than the positional constraints given by the lower resolution catalogues (see Appendix A for further details on this method and the results). As such no significant advantage is given by the LR method over simply detecting the brightest pixels. Thus, it is difficult to determine whether pixels with S/N are indeed real detections, and are henceforth considered as resulting from noise.
3.3 Primary Beam Correction
Primary beam corrections in VLBI observations are uncommon and to-date have been attempted for a subset of EVN antennas (Morgan et al., 2011) and the VLBA (Middelberg et al., 2011; Morgan et al., 2013; Middelberg et al., 2013). Unlike interferometers such as the JVLA where the primary beam correction is performed in the image plane, the approach taken by Middelberg et al. (2011) determines the primary beam attenuation through calculating the visibility gains. This requires the assumption that the correction is constant across the entire image.
Primary beam corrections were applied to the phase centres containing pixels above 6.7, following the method of Middelberg et al. (2011) and Morgan et al. (2013). Very limited information is available on the primary beams of EVN dishes and so our primary beam model is necessarily simplistic, assuming a rotationally symmetric Bessel function with a FWHM calculated from the published diameter of the dish101010see http://www.evlbi.org/user_guide/EVNstatus.txt for both polarisations. For Effelsberg only, we used the FWHM quoted in 111111https://eff100mwiki.mpifr-bonn.mpg.de/doku.php?id=information_for_astronomers:rx:p200mm scaled relative to the reference frequency quoted therein. For all dishes the primary beam was calculated using the central frequency of each subband, for the duration of the observation, using the measured system temperatures for each antenna and then applied to the visibilities.
It should be noted that the primary beam correction did not improve the S/N of the detected sources. This is evidence of fairly significant errors in the model, since a correct model would result in optimal weighting of each baseline. For the EVN, unlike the VLBA array, the difference in antenna sizes (from 100 m to 25 m) results in very different primary beam responses. Moreover, during the course of the observations the different physical characteristics of the individual elements produce varied effects on the overall primary beam response of the array121212Note:- this is also true for the VLBA. Furthermore, the exact characteristics of each antenna in the EVN (except for Ef to a certain degree) are unknown131313There are current efforts being made to measure the primary beams of the EVN and MERLIN antennas, (R. Beswick, private communication) and a number of assumptions were required (e.g uniform illumination, symmetric primary beam, and a perfect parabola defined by a Bessel function), which would no doubt affect the final correction. While there are errors in the final primary beam-corrected flux values, they are considerably less than not applying the primary beam correction. Thus, there is no prospect of discovering new sources by re-imaging with a primary beam correction applied to the visibilities. Nonetheless, in estimating the flux of the sources, the overall primary beam correction is taken into account and the source fluxes are adjusted accordingly.
For radio sources within the primary beam of the Ef antenna (radius = 3.8) we estimate the residual amplitude error due to the primary beam is on the order of 10. While for sources beyond the HPBW of the Ef primary beam, an error of 20 is estimated. This term is added in quadrature with the other sources of error which is listed in Table 1.
3.4 Flux Density and Morphology
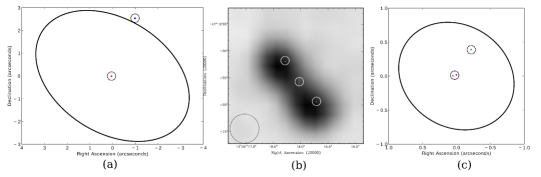
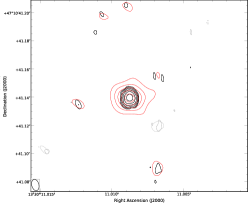
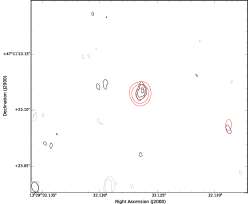
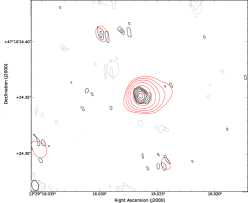
In total six sources were found using the blobcat source extractor (Hales et al., 2012) with flux densities above 6.7, which are listed in Table 1, contour maps and locations of the sources in the field are displayed in Figures 6 and 7, respectively. Following the correction for the amplitude response of the primary beam, the positions of the six sources were shifted to the image centre via uvfix, averaged in frequency, and reimaged.
cleaned images were obtained using data from the full array via the aips task imagr. The images were made with cellsize = 0.5 mas, imsize = 4096 pixels 4096 pixels, and 100 clean iterations. Briggs robust parameter 4 was used to weight the images as it was found to produce an acceptable compromise between sensitivity and resolution. The final images are displayed in Figure 6.
Measurements of flux density and morphology were obtained by fitting a single 2D Gaussian component via imfit, with independent measures of flux density from blobcat and source sizes from fitting a circular Gaussian to the visibilities via modelfit in difmap (Shepherd, 1997). The measurements are listed in Table 1, with any cross identification with the FIRST (Becker et al., 1995) and Maddox et al. (2007) surveys. The different measurements of flux density and source size were found to be consistent, so only the imfit values of flux density and source size are included in Table 1.
Furthermore, to search for possible emission associated with extended structures, lower resolution maps with the full array were made with a range taper of 10 M for all sources and are included in Figure 6 (the red contours). Each source will be discussed in detail in Section 5.5.
| Position (J2000.0) | IMFIT Size | ||||||||
| RA | Dec | FIMFIT | Major | Minor | Identification | ||||
| Source | 13h | 47 | () | S/N | (Jy) | (mas) | (mas) | Maddox | FIRST |
| (1) | (2) | (3) | (4) | (5) | (6) | (7) | (8) | (9) | (10) |
| J132952+471142⋄ | 29m52.7102(3)s | 1142.7465(5) | 0 | 9.7 | 140.116.0 | 8.81.1 | 1.9 0.9 | 53 | Y |
| J133005+471035 | 30m5.1381(1)s | 1035.7896(1) | 2.39 | 43 | 2041.4204 | 12.81.9 | 9.31.9 | 104 | Y |
| J133005+471010‡ | 30m5.1057(1)s | 1010.924(1) | 2.60 | 269 | 4306.7431 | 60.1 | - | - | N |
| J133011+471041 | 30m11.0087(1)s | 1041.1393(2) | 3.27 | 32.7 | 559.763.9 | 6.13.0 | - | 107 | N |
| J132932+471123 | 29m32.1262(4)s | 1123.1175(7) | 3.52 | 7.1 | 188.151.5 | 8.42.2 | 3.11.5 | - | N |
| J133016+471024 | 30m16.0265(1)s | 1024.3525(2) | 4.17 | 20.8 | 455.264.5 | 5.10.6 | - | - | Y |
| ⋄at M51a Centre; ‡SN 2011dh | |||||||||
4 Multi-wavelength Ancillary Data
To fully understand the nature of the compact sources detected in the wide-field VLBI images, multi-wavelength data were obtained. Here, the data from different facilities that were used to complement the VLBI results are described, including any data processing and analysis that was required.
4.1 Radio Continuum
Archival radio data from the VLA and the Multi-Element Radio Linked Interferometer Network (MERLIN) were obtained for this study. M51 was observed by MERLIN on the 02 July 2005 at 18 cm. The data were calibrated following the MERLIN user guide141414http://www.merlin.ac.uk/user_guide/OnlineMUG-ajh/. The entire M51 system () was imaged in aips using imagr, with Briggs robust parameter 4. Initial imaging of the full MERLIN array revealed a bright 5 Jy beam-1 radio source coincident with the VLBI source J133005+471035 and a weak detection above 300 Jy beam-1 (i.e. 5) at the centre of M51. By discarding the longest baselines () and continuum subtracting J133005+471035, deeper images were made revealing a number of radio sources, including diffuse, extended emission around the core, previously detected only with the VLA. MERLIN sources coincident with the VLBI detected sources (Table 1) were found via blobcat, using background RMS maps obtained from the source finding algorithm aegean (Hancock et al., 2012), which were confirmed via visual inspection. The final image gave an rms of 50 Jy beam-1and a beam size of 0.34 0.17, PA=-6.8.
Archive VLA-B observations of M51 at 5 GHz (Observation date of 11 December 2003) and VLA-A 1.4 GHz (Observation date of 10 October 2004) were obtained and calibrated as described by Dumas et al. (2011). Both datasets were imaged using the Common Astronomy Software Applications (CASA) package (McMullin et al., 2007), with Briggs robust parameter 2, cell size of 0.3and image size of 4096 4096 pixels. The imaging procedure also took into consideration w-projection and finally corrected for the primary beam. The final image gave an rms of 12 Jy beam-1and a beam size of 1.08 1.02, PA=-87.2for the 1.4 GHz observation and rms of 12 Jy beam-1and a beam size of 1.72 1.28, PA=-79.6for the 5 GHz observation. These results will be discussed in the individual source discussions in Section 5.
4.2 Optical
Optical images of the M51 system were acquired from the Hubble Space Telescope (HST) online archive. A six-pointing mosaic of the galaxy pair was obtained with the Advanced Camera for Surveys (ACS), Wide Field Channel (WFC) on board the HST in four filters151515HST observing program 10452, P.I. Steven V. W. Beckwith: B (F435W), V (F555W), I (F814W), and H + R (F658N) (Ubeda, 2014). The ACS pipeline-reduced images (with bias subtraction, flat-fielding and drizzling applied) were downloaded from the MAST archive. The final surface brightness of the images are given in units of electrons per second, es-1, which can be converted to flux density by the expression
| (2) |
where, is the flux density (in Jansky) at the effective optical wavelength, is the zeropoint and defines the absolute physical flux density for a point source of 1 es-1 for a particular ACS-WFC filter (Sirianni et al., 2005), and is the Galactic foreground colour magnitude extinction towards M51. The values of and for the different HST filters are listed in Table 2. The parameter is the net count rate for an infinite aperture. We used standard Heasoft tasks to carry out aperture photometry on the optical sources with an aperture corrective given by Sirianni et al. (2005). Finally, using the relations given by Sirianni et al. (2005) we converted between ACS-WFC and the Johnson-Cousins UBVRI photometric systems.
| Filter | Colour | ( Å) | (mag) | (mag) |
| F435W | B | 4450 | 25.67 | 0.125 |
| F555W | V | 5510 | 25.72 | 0.091 |
| F814W | I | 8060 | 25.94 | 0.053 |
| F658N | H | 6563 | 22.77 | 0.08 |
| ∗Sirianni et al. 2005; † Obtained from the | ||||
| NASA/IPAC Extragalactic Database | ||||
4.3 X-rays
M51 has been observed by Chandra/ACIS-S 12 times (considering only observations longer than 2ks) between 2000 and 2012 (Table 3). Aim points and roll orientations differed between observations, but the nucleus of M51a was always located in the field of the back-illuminated S3 chip. We downloaded the data from the public Chandra archive. We reprocessed each observation using tools available in CIAO Version 4.5 (Fruscione et al., 2006), and CalDB version 4.5.3, to obtain new level-2 event files. We then reprojected the event files to a common tangent point using the CIAO script reprojectall. The total exposure time in the merged file is 855 ks for most of the D25 region of M51a. We used the merged event file for imaging and source detection purposes. For spectral analysis of the brightest sources, we generated separate PHA, RMF, and ARF files for each observation with the CIAO task specextract, and created combined spectra by averaging and merging the spectra from the individual observations. We then fitted the spectra with standard models in XSPEC Version 12.6 (Arnaud, 1996). For sources with sufficiently high S/N, we binned the spectra to counts per channel and used statistics. For sources with counts, we used Cash statistics (Cash, 1979).
Table 4 lists the X-ray detections for the sources in Table 1 and other sources discussed in this paper: SN 1945A; SN 1994I; SN 2005cs; and Component N.
| ObsID | Obs. Date | Exp. Time |
|---|---|---|
| (dd/mm/yy) | (ks) | |
| (1) | (2) | (3) |
| 354 | 20/06/00 | 14.86 |
| 1622 | 23/06/01 | 26.81 |
| 3932 | 07/08/03 | 47.97 |
| 12562 | 12/06/11 | 9.63 |
| 12668 | 03/07/11 | 9.99 |
| 13812 | 09/09/12 | 179.2 |
| 13813 | 12/09/12 | 157.46 |
| 15496 | 19/09/12 | 40.97 |
| 13814 | 20/09/12 | 189.85 |
| 13815 | 23/09/12 | 67.18 |
| 13816 | 26/09/12 | 73.1 |
| 15553 | 10/10/12 | 37.57 |
| Position (J2000.0) | |||
| RA | Dec | ||
| VLBI Sources | 13h | 47 | X-rays? |
| J132952+471142⋄ | 29m52s.7102 | 1142.7465 | YES |
| J133005+471035 | 30m05s.1381 | 1035.7896 | YES⋆ |
| J133005+471010‡ | 30m05s.1057 | 1010.924 | YES |
| J133011+471041 | 30m11s.0087 | 1041.1393 | YES |
| J132932+471123 | 29m32s.1262 | 1123.1175 | YES⋆ |
| J133016+471024 | 30m16s.0265 | 1024.3525 | YES |
| Other Sources | RA | Dec | X-rays? |
| SN 1945A | 29m 58s.95 | 1553.8 | NO |
| SN 1994I | 29m 54s.072 | 1130.5 | YES |
| SN 2005cs | 29m 52s.850 | 1036.3 | unclear |
| Component N | 29m 51s.59 | 1207.7 | YES⋆ |
| ⋄Nuclear source; ‡SN 2011dh; ⋆ very faint | |||
5 Discussion
5.1 Fraction of Radio Sources Detected
Of the 107 radio sources detected in M51 by the Maddox et al. (2007) VLA survey (beam size: 1.501.21, 21 cm; 1.471.13, 6 cm. Sensitivity: 22.5Jy beam-1, 21 cm; 11.7Jy beam-1, 6 cm), we report three confirmed detections. Similarly, of the 15 sources in the same region detected by the VLA FIRST survey (Becker et al., 1995), three were detected161616Two sources were detected by both surveys - the core of M51 and source J133005+471035. For a more realistic estimate of the proportion of detected sources we restrict ourselves to the catalogued sources that are bright enough to be detected above the 6.7 threshold of the EVN observation. The catalogued flux densities were adjusted to 18 cm by using the spectral indices provided by the catalogues, and the sensitivity of the EVN phase centres were corrected for primary beam effects. This leaves 70 sources from the Maddox et al. (2007) VLA survey and 15 from the FIRST survey. Assuming no catalogued sources are resolved, the fraction of VLBI sources detected compared to the Maddox et al. (2007) and VLA FIRST surveys are 3/70 () and 3/15 () 171717Population uncertainties were derived using the Bayesian beta distribution quantile technique (Cameron, 2011)., respectively.
Considering sources from the Maddox et al. (2007) survey not associated with HII regions, the detection rate is 3/32 (), while the VLBI detection rate for sources with peak flux density 1 mJy in the Maddox et al. (2007) survey is 2/5 (). The fraction of sources detected from the FIRST survey (3/15) and Maddox et al. (2007) sources with flux density 1 mJy (2/5), closely agrees with the detection rates of previous wide-field VLBI surveys (e.g. Middelberg et al. 2011; Morgan et al. 2013; Middelberg et al. 2013). However, the fraction of Maddox et al. (2007) sources not associated with HII regions detected with VLBI (3/32) is significantly lower than the previous wide-field VLBI studies.
At 1.6 GHz, our observations would be less affected by free-free absorption compared to Maddox et al. (2007) 1.4 GHz observations (e.g Tingay 2004). It is likely that the majority of the radio sources in M51 detected by Maddox et al. (2007) are fully resolved at our VLBI resolution, suggesting perhaps either lack of compact radio emission from sources associated with stellar clusters or the expansion of supernova remnants (SNRs) beyond the maximum size detectable with our observations.
Maddox et al. (2007) estimated that the typical sizes for SNRs in M51 range between 0.3′′ and 0.5′′, (i.e. 12.2 - 20.4 pc). Considering the maximum source size resolvable with our observations is 0.14′′ (6 pc; see Section 2.1), the non-detections are not surprising. Assuming an expansion velocity of 21,000 km s-1 for core-collapse supernovae in M51 (Weiler et al., 2011; Bietenholz et al., 2012) gives an age of 570 - 950 yr for the largest and 280 years for the smallest shell sources.
5.2 The M51a Nuclear Region
5.2.1 A Faint Seyfert Radio Nucleus
The VLBI observation resolves the radio source at the nucleus of M51a into multiple components (source J132952+471142 in Figure 6a). The main feature is a compact source (labelled C1) marginally resolved in the high resolution images (black contours), and unresolved in the 10 M image. Located to the north of C1 are two weaker sources (labelled C2a and C2b), which are blended into a single, unresolved elongated structure that appears to be connected to C1 in the 10 M image. Components C2a and C2b are unresolved sources with total flux densities of 51.5 9.1 Jy and 54.6 10.2 Jy, respectively. The separation of C2a and C2b from C1 are 41.5 mas ( 1.69 pc) and 49.4 mas ( 2.01 pc), respectively.
VLBI observations of a distance-limited sample (22 Mpc) of Seyfert galaxies, at 18 and 6 cm, have revealed similar structures to M51a within their nuclei (Giroletti & Panessa, 2009; Bontempi et al., 2012; Panessa & Giroletti, 2013). Here, the detected VLBI flux density is dominated by a high brightness temperature (log10T) parsec-scale source with a flat/intermediate spectrum (), accompanied by fainter, steep spectrum extended components. The flat/intermediate spectrum, high TB sources are taken as evidence for non-thermal processes driven by jet-producing central engines typical of radio-quiet and radio loud quasars and AGNs (Blundell & Beasley, 1998; Doi et al., 2013).
Using the brightness temperature relation, TB =, where: is the flux density at frequency ; - the Boltzmann constant; are the major and minor deconvolved sizes in radians; and c is the speed of light, a value of log10T is obtained for C1. Both TB and luminosity (1018 W Hz-1) of C1 are within the typical range of values for low luminosity AGNs within Seyfert galaxies (Panessa & Giroletti, 2013). Therefore, components C2a and C2b are, most probably, hotspots associated with a jet or thermal outflow.
5.2.2 Previous VLBI observations
Bontempi et al. (2012) observed M51a with the EVN at both 18 and 6 cm and were unable to detect any emission above 3 (75 and 160 Jy beam-1 at 18 and 6 cm, respectively). However, they searched within a 1radius centred on the VLA FIRST position RA = 13, Dec = +471140.065, which would mean that the VLBI position in Table 1 was beyond their search field. The uncalibrated datasets for both observations (Experiment ID: EG037D and EG037C. PI: Giroletti) were obtained from the EVN data archive. Using the calibration tables generated by the EVN pipeline, both datasets were imaged as described in Section 5.3.1.
The core-jet structure was detected only in the 18 cm data at the expected position with a similar size, flux density and morphology as seen in the wide-field observation presented in Section 3.4. The non-detection at 5 GHz is attributed to the poor sensitivity of the observation (=50 Jy beam-1), caused by the loss of Ef for 90 of the time due to high winds. Assuming a flat to intermediate spectrum (), the expected flux density of J132952+471142 at 6 cm would be less than 150 Jy beam-1.
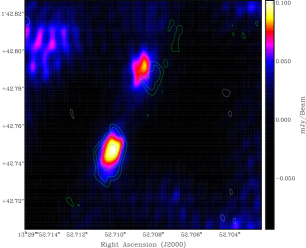
The images from both epochs (2008 and 2011) at 18 cm are compared in Figure 8, where the contours of the 2011 epoch are overlayed on the 2008 epoch (colour image). A restoring beam of size 18.5 mas 11.0 mas with a P.A. = -3.71was used for the 2011 epoch so as to match the 2008 epoch. While the compact radio core is found at the same position in both epochs, the lower brightness compact source associated with a jet/thermal outflow shows an apparent lateral shift in position of 7.53 mas between epochs. The positional measurementsfor both epochs were obtained using the same phase reference source, with the same referenced position.
With a time difference of 3.7 years, and assuming that the difference in position is genuine, a velocity of 0.27c is implied. Furthermore, the peak brightness of the jet/hotspot has decreased between epochs (80.2 Jy beam-1, 2008; 44.2 Jy beam-1, 2011), which may be associated with the apparent motion. Molecular aperture synthesis HCN observations of M51a by Kohno et al. (1996) revealed a twisted velocity field resulting from the existence of a dense rotating molecular disk that is aligned to the nuclear jet of M51a, and the circular rotation of the galactic disk plane. However, the maximum velocity of this field (450-500 km s-1) is too low to result in the apparent motion of the pc-scale jet. Furthermore, the direction of the apparent motion suggests that the jet may be precessing. While jet precession is not uncommon in radio bright AGNs (e.g Conway & Murphy 1993; Appl et al. 1996; Lu & Zhou 2005), it is yet to be observed for low luminosity Seyfert galaxies. In addition, outward proper motions have been observed (at the 3 level) in the jets of the Seyfert galaxy NGC 5506 on pc scales (Middelberg et al., 2004). The apparent motion could be the result of a combined effects of forward bulk motions of the jet interacting with the rotation observed by Kohno et al. (1996).
It is, however, possible that the position shift can be the result of systematic factors (e.g. poor calibration), since the hotspots displaying the apparent motions are 4 detections. This is unlikely since the positions of the phase calibrator and C1 between both epochs were found to agree to within less than 1 mas. Whether this apparent motion is indeed intrinsic to M51a is difficult to ascertain with only two epochs. Therefore, a request has been made to observe the nuclear region of M51a with a third higher sensitivity observation with the EVN at 18 cm to determine whether this is indeed intrinsic to the parsec-scale jet of M51a, the results of which will be discussed in a later paper.
5.2.3 A Multi-wavelength Perspective
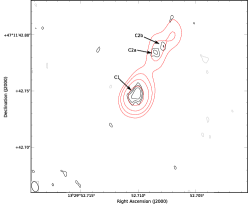
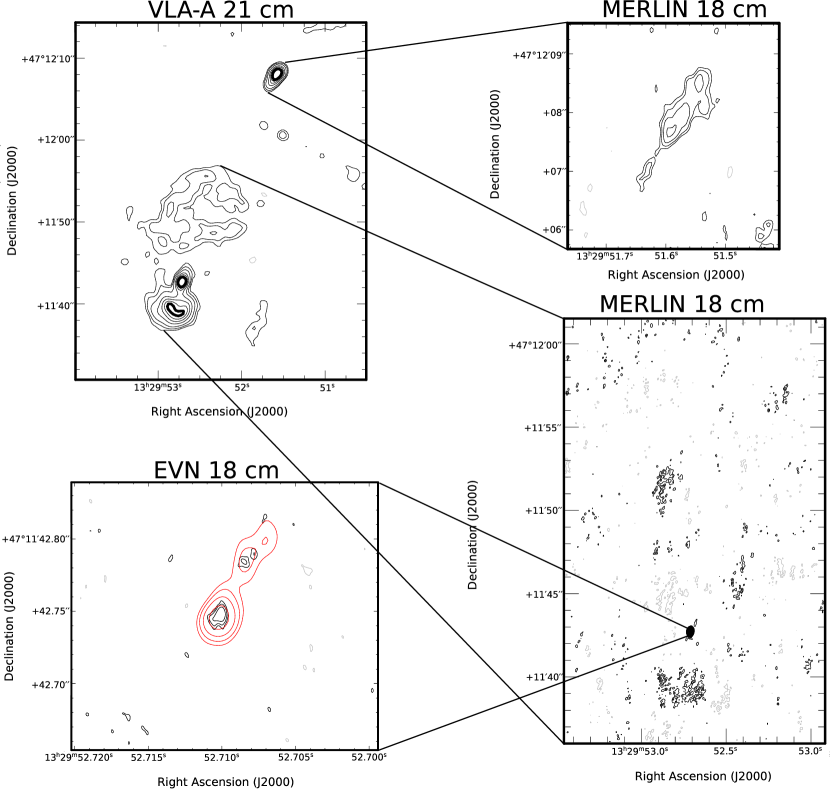
Figure 9 shows the complex nuclear region of M51a with increasing resolution. The VLA-A image at 20 cm (resolution 1.08) and the higher resolution MERLIN 18 cm images (resolution 0.34) reveal an area of ring-like emission to the north of the core (hereafter, the northern bubble) and a dense area of emission to the south, referred to as an extranuclear cloud (XNC), that may have resulted from interactions of a nuclear jet with the surrounding ISM (Crane & van der Hulst, 1992; Terashima & Wilson, 2001; Maddox et al., 2007). Maddox et al. (2007) measured peak flux densities for the nucleus at both 20 cm (2.08 Jy beam-1) and 6 cm (1.14 Jy beam-1), giving a moderately flat spectrum ( = 0.49). The MERLIN image shows the more compact regions where the ejecta are strongly interacting with the surrounding medium. Also shown in the image is a slightly extended source located 30(1.22 kpc) from the nuclear radio source, which is discussed later in Section 5.2.4.
As noted by previous studies (Terashima & Wilson, 2001; Maddox et al., 2007), the radio continuum emission of the nuclear region, including the XNC and the northern bubble is very similar to the Chandra X-ray morphology. Terashima & Wilson (2001) found that the X-ray spectrum mainly consist of a hard component that dominates the 3-8 keV band corresponding to an obscuration of the nuclear source by a column density in excess of cm-2. With our deeper combined spectrum (855 ks), we confirm that the emission consists of a soft thermal-plasma component plus a hard component probably due to reflection or scattering, with a strong Fe line. The average observed flux in the 0.3–10 keV band is erg cm-2 s-1, of which erg cm-2 s-1 is in the thermal-plasma component, which may come from a compact nuclear starburst or from gas shock-ionized by nuclear outflows. The unabsorbed luminosity of the thermal-plasma emission is erg s-1. For the hard component, nominally we obtain erg s-1; however, this is only a minimal fraction of the true X-ray luminosity of the nuclear black hole, whose direct emission is completely obscured in the Chandra energy band. Using BeppoSAX, Fukazawa et al. (2001) detected the direct hard X-ray emission at energies keV, and estimated a column density cm-2 and an intrinsic nuclear luminosity erg s-1. More detailed analysis of the nuclear X-ray spectrum is beyond the scope of this work.
The X-ray emission of both the XNC and the northern bubble is dominated by optically-thin thermal plasma at a characteristic temperature keV, typical of collisionally-ionized gas (Terashima & Wilson, 2001). High-resolution 6 cm (Crane & van der Hulst, 1992) and 3 cm (Bradley et al., 2004) VLA observations of the nucleus reveals a narrow jet-like feature emanating from the nucleus and terminating in the XNC. [O iii] line measurements of narrow line regions within the nuclear region, and along the direction of the narrow jet-like feature, find evidence for shock heating of the gas (Bradley et al., 2004) at the location of the XNC, indicating continuous fuelling of the XNC by the radio jet. However, no evidence has been found for shock ionisation in narrow line regions within the direction of the northern bubble (Bradley et al., 2004), suggesting the northern bubble may therefore be from a previous ejection cycle of the Seyfert nucleus of M51a (Crane & van der Hulst, 1992; Maddox et al., 2007). Interestingly, jet hotspots were detected with VLBI only in the direction of the northern bubble (components C2a and C2b). However, the AGN core appears slightly elongated in the VLBI image, in the direction of the southern jet, and may be the launching point for the jet.
5.2.4 Component N: a possible fossil radio hotspot
The VLA and MERLIN images reveal a bright object (222921 Jy beam-1, VLA 20 cm; 94611 Jy beam-1, VLA 6 cm; 448.354 Jy beam-1, MERLIN 18 cm;) located to the north of the core of M51a that was not detected in the EVN observations. The MERLIN position (RA = 13h 29m 51.593s, Dec = 471207.66) places Component N 25.85from the nearest phase centre. The unaveraged visibilities for the phase centre closest, was shifted to the position of Component N. The dataset was then averaged in time and frequency, such that the combined smearing at a radius of 2from the MERLIN position was limited to 5. The resulting dataset was imaged also with uv-tapering of 10 M, with natural weighting, which resulted in no detection above 5. Given that the primary beam sensitivity at component N is is 5-10 the peak sensitivity, we estimate an upper limit of the EVN peak flux density of 82.5 Jy beam-1.
The object, hereafter component N, has a steep spectrum ( = -0.7), dominated by synchrotron radio emission, thus suggesting it is possibly a jet hotspot associated with the Seyfert nucleus of M51a, a SNR or a background AGN. The MERLIN 18 cm image in Figure 9 reveals a complicated structure, elongated in the direction of M51a nucleus, atypical of SNRs. Moreover, the lack of detection of high brightness temperature emission with the EVN suggests it may be a background AGN whose core has either been scatter broadened or a background galaxy without a compact radio core.
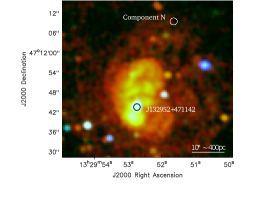
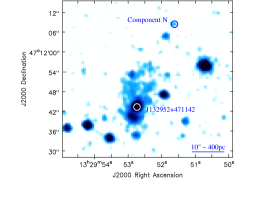
There is a faint, point-like X-ray source (Figure 10, top right panel) at the position of Component N in the Chandra data. The source is significantly detected in the hard band (2–7 keV). The detection is only at the 3 level; however, the exact positional coincidence with the radio source gives us confidence that it is a real X-ray source. At softer energies, such a faint source is swamped by the diffuse thermal-plasma emission in that region (Figure 10, top left panel); but we cannot rule out the possibility that the point-like X-ray source is heavily absorbed below 2 keV, perhaps by one of the numerous dust lanes in that region. HST continuum images do in fact suggest the presence of a dust feature at the location of Component N (Figure 10, bottom right panel). Based on the Chandra/ACIS 2–7 keV count rate of ct s-1, and assuming a power-law photon index and line-of-sight absorption, we estimate an observed 0.3–10 keV flux erg cm-2 s-1 and an emitted luminosity erg s-1 if located in M 51.
We inspected the HST/ACS-WFC images but did not find any obvious counterpart of Component N in the continuum (Figure 10, bottom right panel); a few nearby point-like sources are consistent with small, unresolved (FWHM 01 pc) groups of young massive stars, abundantly scattered in the inner disk of M51a. An elongated stream of H emission near Component N is oriented towards the nucleus (Figure 10, bottom left panel), roughly in the same direction as the putative jet, but we cannot determine at this stage if there is a physical relationship. Further analysis of the circumnuclear H and continuum emission is beyond the scope of this paper.
Possible interpretations for the Component N radio and X-ray sources are synchrotron emission from a hot spot energized by a nuclear jet, or a background radio galaxy seen through the disk of M51a. If it is a background AGN, it is a remarkable coincidence that its radio structure is elongated towards the core of M51a, but that is not a priori impossible (a similar situation is well known in the spiral galaxy M 83, with a bright background FRII radio galaxy projected near the nucleus, which might at first sight be interpreted as a jet feature from M 83 itself (Maddox et al., 2006; Long et al., 2014).
To determine the probability of a chance alignment of a background AGN with the M51a nucleus we used the method of estimating quasar alignment by Edmunds & George (1985). In this method, Edmunds & George (1985) investigated the expected number of random alignments, , in a field of area , with a surface density of sources, for random clustered and unclustered fields and found it to be approximately,
| (3) |
where is the distance between the two furthest sources, is the distance between the outer two sources, such that the product forms a rectangle enclosing all points of interest. The number density of quasars from the FIRST survey is 90 quasars per square degree (White et al., 1997) and the total area surveyed in this study is 11.26.9. Thus, using Equation 3, for the inner region of M51a i.e. = 30and = 6. There is, therefore, a very low probability of a chance alignment within the central region of M51a, suggesting that component N and the nucleus of M51a are most probably physically related. Thus, component N is most likely a jet hotspot associated with the Seyfert nucleus of M51a.
However, with no evidence of a continuous jet in the northern region of M51a, and the lack of a high brightness temperature component, Component N may be a fossil radio lobe/hotspot associated with past AGN activity from the core of M51a. Fossil radio lobes have been detected in a few radio galaxies such as 3C 388 (Jones & Preston, 2001; Gentile et al., 2007) and IC 2476 (Cordey, 1987), with a few “dying galaxies" with evidence for fossil radio lobes (e.g. Parma et al. 2007; Murgia et al. 2012). Radio lobes or hotspots are powered by energy from an AGN via jets of plasma. When the AGN undergoes a fading or dying stage, the jets and eventually the hotspots will expand adiabatically into the surrounding medium, and disappear due to the loss of the continuous production of plasma (Murgia et al., 2012). It is possible that this eventually leads to the loss of the high brightness temperature component, leaving behind a diffuse shell.
If this is the case then the remaining synchrotron radiation in component N would be from electrons older than those within the core (e.g. Carilli et al. 1991). Synchrotron ageing in radio galaxies is generally associated with a spectral “break" that shifts to lower frequencies with older plasma (Carilli et al., 1991). To investigate this possibility, the inner region on M51a (including Component N) will be observed with the Low Frequency Array (LOFAR) including all the international stations in VLBI mode at 110 and 170 MHz.
5.3 Supernovae
At the time of our observations, M51a and M51b hosted four optically observed supernovae (SNe): the Type Ia SN 1945A (Kowal & Sargent, 1971); the Type Ib/c SN 1994I (Puckett et al., 1994); the Type Ib/c SN 2005cs (Muendlein et al., 2005); and the Type IIb SN 2011dh (Griga et al., 2011). Of the four SNe, radio emission and X-rays have been detected in SN 1994I (Weiler et al., 2011, Radio), (Immler et al., 2002, 1998, X-Rays) and SN 2011dh (Krauss et al., 2012; Bietenholz et al., 2012; Horesh et al., 2013, Radio), (Soderberg et al., 2012; Campana & Immler, 2012; Maeda et al., 2014, X-Rays).
SN 2005cs is located within a region with a number of faint sources near the detection limit. There is however, soft X-ray emission inside a 1error circle, from at least two sources with 20–30 counts, but it is unclear whether either of them is the true X-ray counterpart of SN 2005cs. In any case, we can say that the X-ray luminosity erg s-1, which is two orders of magnitude lower than the upper limits on the X-ray luminosity estimated by Brown et al. (2007). We will now discuss the radio and x-ray properties of, SN 1994I and SN 2011dh.
5.3.1 SN 1994I
Radio Almost a decade after the explosion, Maddox et al. (2007) detected radio emission from SN 1994I. However, no radio emission above the detection threshold of 50.0 Jy beam-1 was found in the VLBI images at the position of SN 1994I. Given that our observation was almost a decade from the Maddox et al. (2007) observation, it is possible that SN 1994I has faded below our sensitivity and/or expanded beyond the EVN’s maximum resolvable size. Adjusting the 1.4 GHz flux density from Maddox et al. (2007) with a spectral index of -1.04 (Maddox et al., 2007), the flux density of SN 1994I at 1.65 GHz at the time of the Maddox et al. (2007) observation would have been 134.9Jy beam-1. The supernova light curve model of Weiler et al. (2002) indicates that the flux density, decreases with time following a power-law, , where is supernova age and =-1.42 for SN 1994I (Weiler et al., 2011). At the time of our observation (age of 6428 days) a 1.65 GHz peak flux density of 59.5 Jy beam-1 is estimated, which is just above our detection threshold. Furthermore, the expansion of SN 1994I has been well studied and follows the form 1.29(/1 day) as (Weiler et al., 2011), which estimates a size of 8.3 mas at the time of our observation. The estimates of size and flux density are just within the limits of our EVN observation; as these estimates are model dependent, it is possible that SN 1994I was just below the detection threshold. It is also possible that the power-law decrease of the flux density steepens at later times, reducing the flux density below our detection threshold. This has been observed for SN1957D, albeit more than 40 years after its explosion (Long et al., 2012).
X-Rays. SN 1994I was detected in the first three Chandra observations (Table 3) with declining flux: erg s-1 cm-2 on 2000 June 20 ( d after the explosion), erg s-1 cm-2 on 2001 June 23 ( d), and erg s-1 cm-2 on 2003 August 7 ( d). The spectrum is soft (), and well fitted with optically-thin thermal plasma emission at keV. The corresponding unabsorbed luminosity on 2000 June 20 was erg s-1. Subsequent observations were either too short for reliable measurements (ObsIDs 12562 and 12568), or the source had become too faint to be significantly detected in individual observations. However, after stacking the seven Chandra observations from 2012 September–October ( d), we detected it at an average observed flux erg s-1 cm-2, corresponding to an emitted luminosity erg s-1.
The X-ray luminosity evolution at late times is a function of the progenitor wind properties as well as the SN shell expansion velocity (Fransson et al., 1996; Immler et al., 2002):
| (4) |
where is the mean mass per particle ( g for a H+He plasma), is the cooling function ( erg cm3 s-1 at 1 keV), is the mass loss rate in the stellar wind in the last few years before the explosion, is the stellar wind speed ( km s-1), is the shell expansion speed (for SN 1994I, km s-1: Filippenko et al. 1995), and the time after the explosion. In the simplest scenario, for constant , and , the X-ray luminosity evolves as . Using three ROSAT observations, and the first two Chandra observations, (Immler et al., 2002, Fig. 2) found an X-ray flux decline with , suggesting a mass-loss rate . We can now better constrain the late-time decline rate, by adding the flux datapoints from the later Chandra observations. We find that , which is similar to the power-law decrease of the radio flux density.
5.3.2 SN 2011dh
Radio. Our VLBI observations were conducted 159 days after the explosion date (2011 May 31, hereafter ) of SN 2011dh. The observations detect a compact unresolved source with a flux density of 4.306 0.024 mJy at the position of SN 2011dh (source J133005+471010).
The position of our peak flux density is offset from the VLBI positions reported by Martí-Vidal et al. (2011) at 22 GHz 14 days after and Bietenholz et al. (2012) at 8.4 GHz 179 days after , by 1.9 mas and 2.3 mas, respectively. The positional measurements were obtained using the same phase reference source, with the same referenced position. The offset in position with the higher frequency VLBI is less than half the synthesised beam of our 18 cm EVN observation.
With EVN observations at 8.4 GHz 179 days after , Bietenholz et al. (2012) estimated the radius of the shock front of SN 2011dh to be 0.250.08 mas. The radius of the shock front was also estimated up to 92 days after via the radio spectral energy distribution, fitted to a synchrotron self-absorption (SSA) model (Krauss et al., 2012; Bietenholz et al., 2012). Combining the results of both observations, the radius of SN 2011dh, , is found to follow a power-law, given by cm. At = 159 days, = 2.71 cm 0.11 mas, which is of the synthesised beam of our EVN observation.
SN 2011dh has been observed intensively with the JVLA across several frequency bands between 1.4 to 43 GHz (Krauss et al., 2012; Horesh et al., 2013) between to days after . With a detection of SN 2011dh at 159 days after , it may be possible to provide constraints to the light curve model of Horesh et al. (2013). Figure 11 includes the 4.9/5 GHz data from Krauss et al. (2012) and Horesh et al. (2013), with the 1.65 GHz flux density values determined via the spectral index between the 1.4 and 1.8 GHz flux densities at each epoch from Krauss et al. (2012). The lines are model fits to the light curves, which are described below.
The radio emission from a supernova (SN) arises through the interaction of the SN ejecta with the circumstellar medium (CSM) (Weiler et al., 1986, 2002). The resulting radio light curve is then a result of the competing effects from the declining non-thermal radio emission and the more rapid declining thermal (free-free) and non-thermal synchrotron self-absorption (SSA) as the ejecta propagates through the CSM. This relationship is generalised in a parametric model by Weiler et al. (2002), which allows for power-law variations in key quantities and can be written in the simplified form,
| (5) |
where describes the frequency dependency (or spectral index), is a scaling factor and is related to the flux density at 5 GHz 1 day after the explosion, and describes the power-law dependency of the flux density with the SN age, (Weiler et al., 2002). The absorption term, , describes an internal absorption by material mixed with the emitting component, which assumes a planar geometry (Weiler et al., 2002; Horesh et al., 2013). Both the early light curve ( days) and the radio spectra ( days) were found to be consistent with absorption due to SSA (Krauss et al., 2012; Horesh et al., 2013). The absorption mechanism in Equation 5 is therefore taken to be of the non-thermal SSA form and is defined by the optical depth, , given as,
| (6) |
where is the optical depth 1 day after the explosion and describes the power-law dependency of with the SN age, (Weiler et al., 2002).
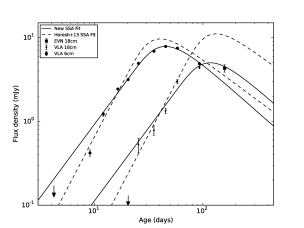
The dashed lines in Fig 11 are the fit to Equation 5 derived by Horesh et al. (2013), using 22.5 GHz JVLA data for days. While the model from Horesh et al. (2013) provides a better fit to the observed data for the early rise of the light cure, it clearly over-estimates the flux density for the later times. Using the 4.9/5 GHz data, a new SSA model fit to the light curve was obtained for Equation 5, which provides a better overall fit to the data at 1.65 GHz, including the turnover observed with the EVN. The final fit parameters are = -1.30, = -1.14, =-2.88, = 928.5 mJy, and = 5.5 and are displayed in Figure 11 (the solid lines).
The difference between the model fits can be explained through the estimates of , which are displayed in Figure 12. At the early stages of the SN expansion, the CSM is optically thick () and gradually becomes optically thin () as the SN expands into the surrounding ISM (Weiler et al., 2002), coinciding with the emission of the peak radio brightness. Furthermore, the time at which the medium becomes optically thin is dependent on the frequency of emission. Thus, in deriving the model fit using the 22.5 GHz data, Horesh et al. (2013) underestimated the optical depth (Figure 12, blue dashed lines) and, therefore, the attenuation of the flux density at the lower frequencies.

X-Rays. SN 2011dh was clearly detected for all observations following the explosion date. Similar to SN 1994I, the flux of SN 2011dh was found to be decreasing with time. The Chandra data listed in Table 3 were used extensively by Maeda et al. (2014) to investigate the long-lasting X-ray emission from SN 2011dh and the mass loss history of the yellow supergiant progenitor. We find that our flux measurements are consistent with their reported values.
5.4 Background Radio Sources
5.4.1 J133011+471041
The radio source J133011+471041 was detected with the VLA at both 20 cm (50022 Jy beam-1) and 6 cm (48250 Jy beam-1) by Maddox et al. (2007), giving a flat radio spectrum ( = -0.03). Comparing the radio position with archived Chandra X-ray data, they found a 1037 ergs s-1 counterpart, making it the brightest X-ray/radio overlap in their survey. However, no H emission was found at the source position from the HST ACS archive, leading Maddox et al. (2007) to suggest that J133011+471041 may be a microquasar in a radio-loud state during the time of the VLA observations. If indeed this source is a microquasar, its luminosity at 5 GHz would be a factor of two more luminous than the most luminous discovered to date (GRO J1655-40: Hjellming & Rupen 1995, Tingay et al. 1995).
The VLBI image (Figure 6d) reveals a compact, relatively unresolved source with a total EVN flux density (see Table 1) matching the VLA flux density within measurement errors. Since there is little or no extended emission resolved by our VLBI observations, the radio emission seen with the VLA and EVN is emanating from the same compact region, a few mas in size. Re-imaging the VLBI data with a higher resolution by setting the Briggs robust parameter to 0 and adopting a cellsize of 0.1 mas, reveals a double morphology, resembling a core-jet structure typically seen in radio galaxies or AGNs. The resulting image is shown in Figure 13, with the peak surface brightness of the components of 270 Jy beam-1 and 233 Jy beam-1, separated by 4.3 mas. To the east of the double, at a distance of 38.6 mas from the brightest component of 3011+1041, is a weak unresolved source with peak surface brightness of 123 Jy beam-1 that may be a jet hotspot related to J133011+471041.
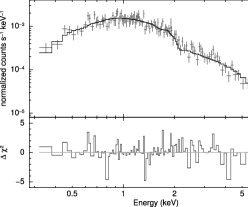
X-ray Spectrum. The stacked Chandra spectrum (855 ks) is well fitted with a simple power-law (Figure 14) with photon index181818 is related to the spectral index commonly used in radio astronomy by , where . , and line-of-sight Galactic absorption cm-2. Thermal models such as disk black-body or thermal plasma are ruled out; adding a soft thermal component to the power-law model does not improve the fit. The observed flux of the stacked spectrum is erg s-1 cm-2, from which we infer an emitted luminosity erg s-1 if the source belongs to M51a. In fact, we suggest that this source is more likely to be a background AGN.
We can estimate the likelihood that J133011+471041 is a background source using the fundamental-plane relation (Merloni et al., 2003; Plotkin et al., 2012). If it were in M51a, and . Using the best-fitting coefficients from Plotkin et al. (2012), the resulting black hole mass would be , inconsistent with an X-ray binary or even an intermediate-mass black hole in M51a. The only possibility for J133011+471041 to be located in M51a is if its radio flux is strongly Doppler boosted, which we cannot yet rule out.
Optical/X-Ray. The ratio between X-ray and optical luminosity is considered to be a reliable indicator of X-ray source classification (Comastri, 2004). The relationship is defined as (see Maccacaro et al. 1988; Barger et al. 2002; McHardy et al. 2003):
| (7) |
where is the optical flux (in cgs) and is the Johnson-Cousins R-band flux density. The distribution of for spectroscopically identified X-ray AGN from ROSAT (Hasinger et al., 1998), ASCA (Akiyama et al., 2003), Chandra (Giacconi et al., 2001), and XMM-Newton (Mainieri et al., 2002; Fiore et al., 2003) surveys fall within -1, while for stellar mass sources, such as x-ray-binaries and microquasars, .
Since the galaxy was not observed in the R-band with the HST/ACS, to estimate the of J133011+471041, the fluxes of the HST B, V and I bands were first estimated as described in Section 4. The R-band flux (10.26 Jy) was then estimated via a non-linear least squares fit to the flux densities of the B, V and I bands, from which a value of 21.1 for Rmag was determined. Substituting the values into Equation 7 results in = -0.03, indicating that 3011+1041 is likely a background AGN and is consistent with what was found using the fundamental-plane argument and the X-ray spectrum.
Radio Loudness and AGN Classification. Since we have concluded that J133011471041 is a background source, based upon its optical/radio/X-ray flux ratios, we can now classify its AGN type from its radio loudness parameter , defined as (Terashima & Wilson, 2003; Ho, 2008):
| (8) |
Substituting = 482 Jy and erg s-1 cm-2 gives . Therefore, J133011+471041 falls within the parameter space of radio-loud low-luminosity AGNs (see Figure 4 of Terashima & Wilson 2003 and Figure 10 of Ho 2008).
5.4.2 J133005+471035
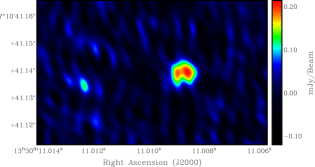
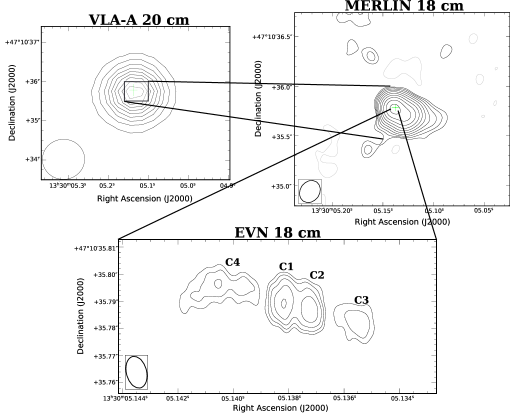
The radio source J133005+471035 is resolved into four components with the EVN at 18 cm (Figure 6b), where the components are labelled C1 to C4 in order of decreasing peak surface brightness.
| Position of FP | |||||||
| VLBI | RA | Dec | Bmaj | log10 TB | |||
| Source | (13h30m) | (4710) | (mas) | (Jy beam-1) | (Jy) | (mas) | (K) |
| (1) | (2) | (3) | (4) | (5) | (6) | (7) | (8) |
| C1 | 5.1381(2) | 35.7896(4) | 0 | 211.725.6 | 457.265.2 | 12.8 | 6.26 |
| C2 | 5.1373(3) | 35.787308 | 9.72 | 199.824.6 | 414.059.1 | 10.98 | 6.34 |
| C3 | 5.1355557 | 35.782491 | 27.5 | 99.117.3 | 313.065.3 | 14.65 | 5.98 |
| C4 | 5.1404641 | 35.794635 | 24.2 | 91.816.6 | 650.2128.6 | 32.03 | 5.61 |
Table 5 lists the different properties of the four components, including the position of the peak surface brightness, peak and total flux densities, size of the component’s major axis and brightness temperature. The VLBI morphology of J133005+471035 shows evidence for a two-sided jet emanating from an active nucleus. However, without higher frequency VLBI observations it is difficult to determine which is the core that hosts the active nucleus. The similarity of both C1 and C2, in terms of size, flux density and brightness temperature suggests that they are, most probably, radio lobes/hotspots resulting from jets emanating from an unresolved, fainter active nucleus.
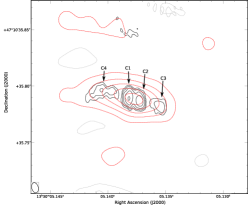
In lower resolution radio maps of M51a with the VLA and MERLIN, J133005+471035 is the brightest radio source in the M51 system. Figure 15 shows the VLA-A 20 cm and MERLIN 18 cm maps in relation to the EVN 18 cm map (represented by the green crosses). In the FIRST survey the source is unresolved at 20 cm with a total flux density of 12.64 0.14 mJy, while at higher resolution VLA-A, a total flux density of 13.38 1.50 mJy is recovered from the unresolved 20 cm VLA-A image in Figure 15. This is similar to the peak flux density obtained by Maddox et al. (2007): 9.6 Jy beam-1 at 20 cm and 4.3 Jy beam-1 at 6 cm, giving an intermediate spectral index of 0.66. The MERLIN 18 cm image displayed in Figure 15 shows an elongated structure, closely resembling the one-sided core-jet morphology of AGNs and quasars on kpc-scales (Bridle & Perley, 1984). The total flux density as measured (via blobcat) from the MERLIN image is 9.95 1.00 mJy, recovering of the flux density of the VLA-A at 18 cm (after correcting the 20 cm flux density with a spectral index of -0.66). Subtracting the total VLBI flux density listed in Table 5 from the MERLIN 18 cm flux density gives 8.12 1.01 mJy, which may result from thermal and non-thermal emission from star formation and non-thermal emission from kpc-scale jets.
A faint X-ray source was found coincident with the position of J133005+471035 in the stacked Chandra image (855 ks). We measure a 0.3–10 keV count rate of ct s-1, mostly distributed around 1 keV. Using Cash statistics, we obtain that the spectrum is best fitted by optically-thin thermal plasma emission, at keV, absorbed by a column density cm-2 (probably due to the location of the source in a dust-rich spiral arm). A power-law model is ruled out because it would require an unphysically steep photon index . The observed flux corresponding to the best-fitting thermal-plasma model is erg s-1 cm-2, and the unabsorbed luminosity is erg s-1 if located in M51a. The thermal nature of the source makes it consistent either with an SNR, if the source is in M51a, or with knots of hot gas shock-ionized by a jet.
5.4.3 J133016+471024
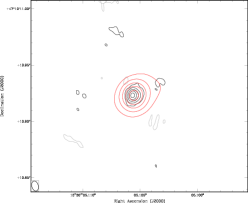
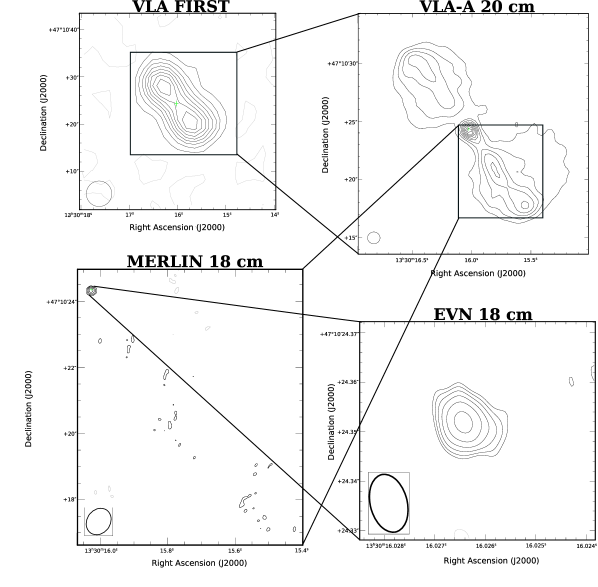
VLA-A 20 cm observations of the radio source J133016+471024 shows a morphology (see Figure 16) similar to nearby powerful FR II radio galaxies such as Cygnus A (Carilli & Barthel, 1996) and Pictor A (Perley et al., 1997), displaying the morphological components common to this type of galaxies. These sources are composed of a compact, high surface brightness temperature, typically flat spectrum source at the centre, from which elongated radio jets end in high surface brightness hotspots (Carilli & Barthel, 1996). The source was detected as a partially resolved double radio source in the FIRST survey with total flux densities of 12.560.63 mJy and 11.670.58 mJy for the southern and northern lobes, respectively. The higher resolution VLA-A 20 cm image resolves the double sources into two radio lobes and a central radio source, with evidence for elongated radio jets ending in hotspots at the extremities of the radio lobes. The VLA-A image recovered 82 and 71 of the FIRST flux density of the southern and northern lobes, respectively. The central source was found to have a total flux density of 2.150.04 mJy at 1.4 GHz191919The 1.4 GHz dataset was re-imaged with the same beamsize as the 5 GHz dataset. and 0.980.01 mJy at 5 GHz, giving a spectral index of -0.62.
The central radio source is unresolved with the higher resolution MERLIN 18 cm observations, with total flux density of 0.970.14 mJy. However, there is evidence for low surface brightness emission (150 Jy beam-1) along the direction of the southern lobe/jet (see Figure 16), and at the location of the peak VLA-20 cm surface brightness component of the northern lobe (not shown in Figure 16). The VLBI observation only detects the central radio source, showing a slightly elongated structure extending from the compact source in the direction of the southern jet, suggesting that the southern jet/lobe may be relativistically beamed towards our line of sight. From the total flux density and major axis size of the central source we obtain a brightness temperature of log10 TB = 7.1, typical of AGNs (e.g. Blundell & Beasley 1998; Ulvestad et al. 2005).
In the standard FR I/FR II classification model (Fanaroff & Riley, 1974) both types of radio sources can be divided by radio luminosity, where the dividing luminosity is 1025 W Hz-1 at 1.4 GHz (below lies the FR I and above the FR II galaxies). Based upon the morphology shown in Figure 16, it is possible to classify J133016+471024 as an FR II galaxy. Assuming a minimum luminosity of 1025 W Hz-1, and with a total flux density at 1.4 GHz of 2.15 mJy, J133016+471024 would be at a minimum distance of 6246 Mpc ( 0.95). Note, placing Cygnus A at 6246 Mpc would result in a total flux density 5 mJy at 1.4 GHz202020Assuming the Flux density of Cygnus A is = 1598 Jy at a distance of 247.2 Mpc (Bîrzan et al., 2004)..
From the Sloan Digital Sky Survey (SDSS) Data Release 9 (Ahn et al., 2012), an optical source was found to be coincident with the position of the central radio source of J133016+471024. The R-band optical data were obtained through the SDSS Science Archive Server in the “corrected frame" format, which have been calibrated in nanomaggies212121A star of brightness 1 nanomaggie has a magnitude of 22.5 in any band, or a flux density of 3.631 Jy. (www.sdss3.org/dr9/help/glossary.php) per pixel, and have had a sky-subtraction applied. We performed aperture photometry with standard Heasoft packages and found a total flux density of 13.11 nanomaggies or 47.6 Jy is obtained, which is equivalent to an of 19.5.
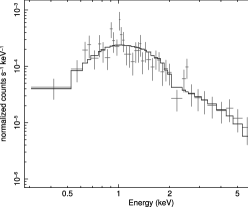
Inspecting the stacked Chandra dataset, we found an X-ray source at the position of the central radio source of J133016+471024. We extracted a combined spectrum as described in Sect.4.3. The spectrum is best fitted (Figure 17) with a simple power-law of photon index and line-of-sight Galactic absorption cm-2; adding free intrinsic absorption does not improve the fit. The observed flux is erg s-1 cm-2. Using Equation 8, we determine a radio loudness parameter , which places this background source firmly in the regime of radio-loud AGN (see Figure 4 of Terashima & Wilson 2003 and Figure 10 of Ho 2008).
5.4.4 J132932+471123
While J132932+471123 is not the weakest VLBI source in our sample, it has the lowest S/N ratio (see Table 1) which results from a high RMS noise due the source’s position at the edge of the primary beam of Ef. Its positional offset is 3.49 in RA and 19.6 in Dec from the M51a centre, placing it at the edge of the M51a disk and beyond the survey area of Maddox et al. (2007). At the VLBI position of J132932+471123, a radio source is detected in the VLA-A 20 cm image with a peak flux density of 23749 Jy beam-1. However, no corresponding source was found in the VLA-B 6 cm image above 60 Jy beam-1. This suggests that J132932+471123 is a steep spectrum source ().
In all the Chandra observations, the source is located a few arcmin from the aimpoint, near the edge of the S3 chip, where the point spread function is larger (several arcsec) and it becomes more difficult to detect faint sources. Nonetheless, we find a 3 detection in the combined X-ray image (835 ks), with a 0.3–10 keV count rate of ct s-1. A Cash-statistic power-law fit gives a photon index with fixed line-of-sight absorption; there are not enough counts for any additional fit components. The observed flux erg s-1 cm-2, which corresponds to an X-ray luminosity erg s-1 if the source is located in M51a. No optical counterparts were found in any of the archival images used for this study; this is not inconsistent with an AGN identification, because we expect mag for an X-ray-to-optical flux ratio of 1. In summary, considering its location at the outskirts of the galactic disk, we tentatively classify this object as a background AGN.
5.5 Estimating the Supernova and Star Formation rates
5.5.1 Global supernova and star formation rates
The supernovae rate, of the entire galaxy can be estimated using the age and total number of SNRs in M51. Both estimates are given in Sect. 5.1, where the ages of the SNRs were estimated to be 280 - 950 yrs. As discussed in Sect. 5.1, our VLBI observatons detected only 3/32 radio sources in M51. Since the 3 detected radio sources are background AGNs and the AGN nucleus of M51, this suggests that the 29 undetected radio sources were SNRs that have expanded beyond the maximum size detectable with our observations. This suggests a supernovae rate range of 0.03 - 0.10 yr-1. The global massive star-formation rate () can be estimated from the using Equation 20 from Condon (1992). Thus we obtain (). The lower limit of our estimation is slightly higher than the SFR the total star formation rate of the entire galaxy (3.4 ) derived via infrared and ultraviolet observations (Calzetti et al., 2005). This suggests that some of the 29 undetected radio sources are not SNRs. A more robust estimate on and the SFR from the radio observations can be achieved following the multi-epoch, multi-frequency Monte-Carlo method of Rampadarath et al. (2014), requiring further observations.
5.5.2 Star formation rate of the inner nucleus
The star formation rate (SFR) of a galaxy is directly proportional to its radio luminosity, at wavelength , assuming that all the radio emission is associated with star formation (Condon, 1992; Haarsma et al., 2000). An estimate of the flux density associated with star formation within the inner nucleus of M51 can be obtained by subtracting the compact VLBI components from the MERLIN data. A total flux density of 2.68 0.14 mJy was recovered from the MERLIN 18 cm observation, and 0.25 0.02 mJy from the EVN observation. Subtraction yields a flux density for the extended radio emission at 18 cm of 2.43 0.14 mJy. However, there may be contributions to the extended emission from the jet components that were resolved-out by the EVN observations. Since this cannot be distinguished by the MERLIN observations, the flux density of the extended emission places an upper limit of the radio emission associated with star formation and hence the SFR
Using the standard relations given in Condon (1992), Haarsma et al. (2000), and Condon et al. (2002), along with the implied standard IMFs (Salpeter, 1955; Miller & Scalo, 1979), we derive an upper limit for the star formation rate of (or ) for the inner nuclear region of M51, which is 10 the total star formation rate of the entire galaxy.
6 Conclusions
This paper presents the deepest, widest VLBI survey of a nearby grand design spiral galaxy. The target for our study is the Whirlpool galaxy (M51a, NGC 5194), that is undergoing a merger with its smaller companion, NGC 5195. The full disk of M51 was surveyed using the multi-phase centre technique (192 phase centres) for compact radio sources. By combining this single pointing of the EVN, with multi-wavelength radio observations, X-ray and optical data we investigated: the properties of the nuclear region of M51a (including a pc-scaled jet); the light curves of the Type IIb supernovae, SN 2011dh (radio) and the Type Ib/c supernova, SN 1994I (radio and x-ray); the nature of four background AGNs (J133005+471035, J133011+471041, J132932+471123, J133016+471024); and the supernova and star formation rates of M51a.
It is important to note that of the 192 phase centres, only six provided positive detections, indicating that most of the computing time was spent on imaging empty fields. Future VLBI surveys of nearby galaxies would therefore benefit from limiting the phase centres to only sources detected with lower resolution interferometers (e.g. the JVLA and eMERLIN). Nonetheless, this study demonstrates the extensive scientific capabilities of a single wide-field VLBI observation.
Acknowledgements
The International Centre for Radio Astronomy Research is a joint venture between Curtin University and the University of Western Australia, funded by the state government of Western Australia and the joint venture partners. The EVN is a joint facility of European, Russian, Chinese, South African and other radio astronomy institutes funded by their national research councils. The VLA operated by the NRAO is a facility of the National Science Foundation operated under cooperative agreement by Associated Universities, Inc. MERLIN is a National Facility operated by the University of Manchester at Jodrell Bank Observatory on behalf of STFC. The Hubble Space Telescope, is operated by NASA and the Space Telescope Science Institute. The Chandra X-ray telescope is operated for NASA by the Smithsonian Astrophysical Observatory. iVEC is a jointly operated venture between CSIRO, and various Western Australian universities, including Curtin University. SJT is a Western Australian Premier’s Research Fellow, funded by the state government of Western Australia. We wish to thank the Joint Institute for VLBI in Europe (JIVE) for conducting the EVN observations, Alessandra Bertarini, Helge Rottmann and Walter Alef for performing the data correlation for the EVN data at the University of Bonn, and Olaf Wucknitz for assisting with moving the EVN data from Bonn to Perth within reasonable time. Thanks to Chris Phillips for providing the support required to successfully utilise the computing cluster, CAVE. This research has made use of material from the NASA/IPAC Extragalactic Database (NED), operated by the Jet Propulsion Laboratory, California Institute of Technology, under contract with NASA, the VizieR catalogue access tool, and the Aladin Sky Atlas both operated by CDS Strasbourg, France. HR acknowledges support from ERC-StG 307215 (LODESTONE). We wish to thank the anonymous referee for very useful comments that have improved the quality of this manuscript.
References
- Ahn et al. (2012) Ahn C. P., Alexandroff R., Allende Prieto C., et al. 2012, ApJS, 203, 21
- Akiyama et al. (2003) Akiyama M., Ueda Y., Ohta K., Takahashi T., Yamada T., 2003, ApJS, 148, 275
- Appl et al. (1996) Appl S., Sol H., Vicente L., 1996, A&A, 310, 419
- Arnaud (1996) Arnaud K. A., 1996, in Jacoby G. H., Barnes J., eds, Astronomical Data Analysis Software and Systems V Vol. 101 of Astronomical Society of the Pacific Conference Series, XSPEC: The First Ten Years. p. 17
- Barger et al. (2002) Barger A. J., Cowie L. L., Brandt W. N., Capak P., Garmire G. P., Hornschemeier A. E., Steffen A. T., Wehner E. H., 2002, AJ, 124, 1839
- Batejat et al. (2012) Batejat F., Conway J. E., Rushton A., Parra R., Diamond P. J., Lonsdale C. J., Lonsdale C. J., 2012, A&A, 542, L24
- Becker et al. (1995) Becker R. H., White R. L., Helfand D. J., 1995, ApJ, 450, 559
- Beswick et al. (2006) Beswick R. J., Riley J. D., Marti-Vidal I., et al. 2006, MNRAS, 369, 1221
- Bietenholz et al. (2004) Bietenholz M. F., Bartel N., Rupen M. P., 2004, ApJ, 615, 173
- Bietenholz et al. (2012) Bietenholz M. F., Brunthaler A., Soderberg A. M., Krauss M., Zauderer B., Bartel N., Chomiuk L., Rupen M. P., 2012, ApJ, 751, 125
- Bîrzan et al. (2004) Bîrzan L., Rafferty D. A., McNamara B. R., Wise M. W., Nulsen P. E. J., 2004, ApJ, 607, 800
- Blundell & Beasley (1998) Blundell K. M., Beasley A. J., 1998, MNRAS, 299, 165
- Bondi et al. (2012) Bondi M., Pérez-Torres M. A., Herrero-Illana R., Alberdi A., 2012, A&A, 539, A134
- Bontempi et al. (2012) Bontempi P., Giroletti M., Panessa F., Orienti M., Doi A., 2012, MNRAS, 426, 588
- Bradley et al. (2004) Bradley L. D., Kaiser M. E., Baan W. A., 2004, ApJ, 603, 463
- Bridle & Perley (1984) Bridle A. H., Perley R. A., 1984, ARA&A, 22, 319
- Brown et al. (2007) Brown P. J., Dessart L., Holland S. T., Immler S., Landsman W., Blondin S., et al 2007, ApJ, 659, 1488
- Calzetti et al. (2005) Calzetti D., Kennicutt Jr. R. C., Bianchi L., et al. 2005, ApJ, 633, 871
- Cameron (2011) Cameron E., 2011, Publications of the Astronomical Society of Australia, 28, 128
- Campana & Immler (2012) Campana S., Immler S., 2012, MNRAS, 427, L70
- Carilli & Barthel (1996) Carilli C. L., Barthel P. D., 1996, A&A Rev., 7, 1
- Carilli et al. (1991) Carilli C. L., Perley R. A., Dreher J. W., Leahy J. P., 1991, ApJ, 383, 554
- Cash (1979) Cash W., 1979, ApJ, 228, 939
- Comastri (2004) Comastri A., 2004, in Barger A. J., ed., Supermassive Black Holes in the Distant Universe Vol. 308 of Astrophysics and Space Science Library, Compton-Thick AGN: The Dark Side of the X-Ray Background. p. 245
- Condon (1992) Condon J. J., 1992, ARA&A, 30, 575
- Condon et al. (2002) Condon J. J., Cotton W. D., Broderick J. J., 2002, AJ, 124, 675
- Conway & Murphy (1993) Conway J. E., Murphy D. W., 1993, ApJ, 411, 89
- Cordey (1987) Cordey R. A., 1987, MNRAS, 227, 695
- Cowan et al. (1994) Cowan J. J., Roberts D. A., Branch D., 1994, ApJ, 434, 128
- Crane & van der Hulst (1992) Crane P. C., van der Hulst J. M., 1992, AJ, 103, 1146
- Deller et al. (2011) Deller A. T., Brisken W. F., Phillips C. J., Morgan J., Alef W., Cappallo R., Middelberg E., Romney J., Rottmann H., Tingay S. J., Wayth R., 2011, PASP, 123, 275
- Deller et al. (2007) Deller A. T., Tingay S. J., Bailes M., West C., 2007, PASP, 119, 318
- Doi et al. (2013) Doi A., Asada K., Fujisawa K., Nagai H., Hagiwara Y., Wajima K., Inoue M., 2013, ApJ, 765, 69
- Dumas et al. (2011) Dumas G., Schinnerer E., Tabatabaei F. S., Beck R., Velusamy T., Murphy E., 2011, AJ, 141, 41
- Edmunds & George (1985) Edmunds M. G., George G. H., 1985, MNRAS, 213, 905
- Fanaroff & Riley (1974) Fanaroff B. L., Riley J. M., 1974, MNRAS, 167, 31P
- Fenech et al. (2010) Fenech D., Beswick R., Muxlow T. W. B., Pedlar A., Argo M. K., 2010, MNRAS, 408, 607
- Fiore et al. (2003) Fiore F., Brusa M., Cocchia F., Baldi A., et al. 2003, A&A, 409, 79
- Ford et al. (1985) Ford H. C., Crane P. C., Jacoby G. H., Lawrie D. G., van der Hulst J. M., 1985, ApJ, 293, 132
- Fransson et al. (1996) Fransson C., Lundqvist P., Chevalier R. A., 1996, ApJ, 461, 993
- Fruscione et al. (2006) Fruscione A., McDowell J. C., Allen G. E., et al. 2006, in Society of Photo-Optical Instrumentation Engineers (SPIE) Conference Series Vol. 6270 of Society of Photo-Optical Instrumentation Engineers (SPIE) Conference Series, CIAO: Chandra’s data analysis system
- Fukazawa et al. (2001) Fukazawa Y., Iyomoto N., Kubota A., Matsumoto Y., Makishima K., 2001, A&A, 374, 73
- Gentile et al. (2007) Gentile G., Rodríguez C., Taylor G. B., Giovannini G., Allen S. W., Lane W. M., Kassim N. E., 2007, ApJ, 659, 225
- Giacconi et al. (2001) Giacconi R., Rosati P., Tozzi P., Nonino M., Hasinger G., Norman C., Bergeron J., Borgani S., Gilli R., Gilmozzi R., Zheng W., 2001, ApJ, 551, 624
- Giroletti & Panessa (2009) Giroletti M., Panessa F., 2009, ApJL, 706, L260
- Griga et al. (2011) Griga T., Marulla A., Grenier A., et al. 2011, Central Bureau Electronic Telegrams, 2736, 1
- Haarsma et al. (2000) Haarsma D. B., Partridge R. B., Windhorst R. A., Richards E. A., 2000, ApJ, 544, 641
- Hales et al. (2012) Hales C. A., Murphy T., Curran J. R., Middelberg E., Gaensler B. M., Norris R. P., 2012, MNRAS, 425, 979
- Hancock et al. (2012) Hancock P. J., Murphy T., Gaensler B. M., Hopkins A., Curran J. R., 2012, MNRAS, 422, 1812
- Hasinger et al. (1998) Hasinger G., Burg R., Giacconi R., Schmidt M., Trumper J., Zamorani G., 1998, A&A, 329, 482
- Hjellming & Rupen (1995) Hjellming R. M., Rupen M. P., 1995, Nature, 375, 464
- Ho (2008) Ho L. C., 2008, ARA&A, 46, 475
- Horesh et al. (2013) Horesh A., Stockdale C., Fox D. B., et al. 2013, MNRAS, 436, 1258
- Immler et al. (1998) Immler S., Pietsch W., Aschenbach B., 1998, A&A, 336, L1
- Immler et al. (2002) Immler S., Wilson A. S., Terashima Y., 2002, ApJL, 573, L27
- Jones & Preston (2001) Jones D. L., Preston R. A., 2001, AJ, 122, 2940
- Kaleida & Scowen (2010) Kaleida C., Scowen P. A., 2010, AJ, 140, 379
- Kennicutt (1998) Kennicutt Jr. R. C., 1998, ARA&A, 36, 189
- Kettenis et al. (2006) Kettenis M., van Langevelde H. J., Reynolds C., Cotton B., 2006, in C. Gabriel, C. Arviset, D. Ponz, & S. Enrique ed., Astronomical Data Analysis Software and Systems XV Vol. 351 of Astronomical Society of the Pacific Conference Series, ParselTongue: AIPS Talking Python. pp 497–+
- Kohno et al. (1996) Kohno K., Kawabe R., Tosaki T., Okumura S. K., 1996, ApJL, 461, L29
- Kowal & Sargent (1971) Kowal C. T., Sargent W. L. W., 1971, AJ, 76, 756
- Krauss et al. (2012) Krauss M. I., Soderberg A. M., Chomiuk L., et al. 2012, ApJL, 750, L40
- Lacey et al. (1997) Lacey C., Duric N., Goss W. M., 1997, ApJS, 109, 417
- Lenc & Tingay (2006) Lenc E., Tingay S. J., 2006, AJ, 132, 1333
- Lenc & Tingay (2009) Lenc E., Tingay S. J., 2009, AJ, 137, 537
- Long et al. (2012) Long K. S., Blair W. P., Godfrey L. E. H., Kuntz K. D., Plucinsky P. P., Soria R., Stockdale C. J., Whitmore B. C., Winkler P. F., 2012, ApJ, 756, 18
- Long et al. (2014) Long K. S., Kuntz K. D., Blair W. P., Godfrey L., Plucinsky P. P., Soria R., Stockdale C., Winkler P. F., 2014, ApJS, 212, 21
- Lonsdale et al. (2006) Lonsdale C. J., Diamond P. J., Thrall H., Smith H. E., Lonsdale C. J., 2006, ApJ, 647, 185
- Lu & Zhou (2005) Lu J.-F., Zhou B.-Y., 2005, ApJL, 635, L17
- Maccacaro et al. (1988) Maccacaro T., Gioia I. M., Wolter A., Zamorani G., Stocke J. T., 1988, ApJ, 326, 680
- Maddox et al. (2006) Maddox L. A., Cowan J. J., Kilgard R. E., Lacey C. K., Prestwich A. H., Stockdale C. J., Wolfing E., 2006, AJ, 132, 310
- Maddox et al. (2007) Maddox L. A., Cowan J. J., Kilgard R. E., Schinnerer E., Stockdale C. J., 2007, AJ, 133, 2559
- Maeda et al. (2014) Maeda K., Katsuda S., Bamba A., Terada Y., Fukazawa Y., 2014, ApJ, 785, 95
- Mainieri et al. (2002) Mainieri V., Bergeron J., Hasinger G., Lehmann I., Rosati P., Schmidt M., Szokoly G., Della Ceca R., 2002, A&A, 393, 425
- Martí-Vidal et al. (2011) Martí-Vidal I., Tudose V., Paragi Z., et al. 2011, A&A, 535, L10
- McDonald et al. (2002) McDonald A. R., Muxlow T. W. B., Wills K. A., Pedlar A., Beswick R. J., 2002, MNRAS, 334, 912
- McHardy et al. (2003) McHardy I. M., Gunn K. F., Newsam A. M., et al. 2003, MNRAS, 342, 802
- McMullin et al. (2007) McMullin J. P., Waters B., Schiebel D., Young W., Golap K., 2007, in Shaw R. A., Hill F., Bell D. J., eds, Astronomical Data Analysis Software and Systems XVI Vol. 376 of Astronomical Society of the Pacific Conference Series, CASA Architecture and Applications. p. 127
- Merloni et al. (2003) Merloni A., Heinz S., di Matteo T., 2003, MNRAS, 345, 1057
- Middelberg et al. (2011) Middelberg E., Deller A., Morgan J., Rottmann H., Alef W., Tingay S., Norris R., Bach U., Brisken W., Lenc E., 2011, A&A, 526, A74
- Middelberg et al. (2013) Middelberg E., Deller A. T., Norris R. P., Fotopoulou S., Salvato M., Morgan J. S., Brisken W., Lutz D., Rovilos E., 2013, A&A, 551, A97
- Middelberg et al. (2004) Middelberg E., Roy A. L., Nagar N. M., Krichbaum T. P., Norris R. P., Wilson A. S., Falcke H., Colbert E. J. M., Witzel A., Fricke K. J., 2004, A&A, 417, 925
- Miller & Scalo (1979) Miller G. E., Scalo J. M., 1979, ApJS, 41, 513
- Morgan et al. (2013) Morgan J. S., Argo M. K., Trott C. M., Macquart J.-P., Deller A., Middelberg E., Miller-Jones J., Tingay S. J., 2013, ApJ, 768, 12
- Morgan et al. (2011) Morgan J. S., Mantovani F., Deller A. T., Brisken W., Alef W., Middelberg E., Nanni M., Tingay S. J., 2011, A&A, 526, A140+
- Muendlein et al. (2005) Muendlein R., Li W., Yamaoka H., Itagaki K., 2005, IAU Circ., 8553, 1
- Murgia et al. (2012) Murgia M., Markevitch M., Govoni F., Parma P., Fanti R., de Ruiter H. R., Mack K.-H., 2012, A&A, 548, A75
- Netzer (2009) Netzer H., 2009, MNRAS, 399, 1907
- Paggi et al. (2013) Paggi A., Fabbiano G., Risaliti G., Wang J., Elvis M., 2013, arXiv:1303.2630
- Panessa & Giroletti (2013) Panessa F., Giroletti M., 2013, MNRAS, 432, 1138
- Pannuti et al. (2002) Pannuti T. G., Duric N., Lacey C. K., Ferguson A. M. N., Magnor M. A., Mendelowitz C., 2002, ApJ, 565, 966
- Pannuti et al. (2000) Pannuti T. G., Duric N., Lacey C. K., Goss W. M., Hoopes C. G., Walterbos R. A. M., Magnor M. A., 2000, ApJ, 544, 780
- Parma et al. (2007) Parma P., Murgia M., de Ruiter H. R., Fanti R., Mack K.-H., Govoni F., 2007, A&A, 470, 875
- Parra et al. (2007) Parra R., Conway J. E., Diamond P. J., Thrall H., Lonsdale C. J., Lonsdale C. J., Smith H. E., 2007, ApJ, 659, 314
- Pedlar et al. (1999) Pedlar A., Muxlow T. W. B., Garrett M. A., Diamond P., Wills K. A., Wilkinson P. N., Alef W., 1999, MNRAS, 307, 761
- Pellegrini et al. (2000) Pellegrini S., Cappi M., Bassani L., Malaguti G., Palumbo G. G. C., Persic M., 2000, A&A, 353, 447
- Perez-Torres et al. (2010) Perez-Torres M., Alberdi A., Romero-Canizales C., Bondi M., Polatidis A., 2010, in 10th European VLBI Network Symposium and EVN Users Meeting: VLBI and the New Generation of Radio Arrays Arp 299A: More that ”just” a prolific supernova factory. p. 58
- Perley et al. (1997) Perley R. A., Roser H.-J., Meisenheimer K., 1997, A&A, 328, 12
- Plotkin et al. (2012) Plotkin R. M., Markoff S., Kelly B. C., Körding E., Anderson S. F., 2012, MNRAS, 419, 267
- Puckett et al. (1994) Puckett T., Armstrong J., Johnson W., et al. 1994, IAU Circ., 5961, 1
- Rampadarath et al. (2010) Rampadarath H., Garrett M. A., Józsa G. I. G., et al. 2010, A&A, 517, L8
- Rampadarath et al. (2014) Rampadarath H., Morgan J. S., Lenc E., Tingay S. J., 2014, AJ, 147, 5
- Romero-Cañizales et al. (2011) Romero-Cañizales C., Mattila S., Alberdi A., Pérez-Torres M. A., Kankare E., Ryder S. D., 2011, MNRAS, 415, 2688
- Rovilos et al. (2005) Rovilos E., Diamond P. J., Lonsdale C. J., Smith H. E., Lonsdale C. J., 2005, MNRAS, 359, 827
- Salpeter (1955) Salpeter E. E., 1955, ApJ, 121, 161
- Shepherd (1997) Shepherd M. C., 1997, in G. Hunt & H. Payne ed., Astronomical Data Analysis Software and Systems VI Vol. 125 of Astronomical Society of the Pacific Conference Series, Difmap: an Interactive Program for Synthesis Imaging. pp 77–+
- Sirianni et al. (2005) Sirianni M., Jee M. J., Benítez N., et al. 2005, PASP, 117, 1049
- Soderberg et al. (2012) Soderberg A. M., Margutti R., Zauderer B. A., Krauss M., Katz B., et al 2012, ApJ, 752, 78
- Terashima & Wilson (2001) Terashima Y., Wilson A. S., 2001, ApJ, 560, 139
- Terashima & Wilson (2003) Terashima Y., Wilson A. S., 2003, ApJ, 583, 145
- Tingay (2004) Tingay S. J., 2004, AJ, 127, 10
- Tingay et al. (1995) Tingay S. J., Jauncey D. L., Preston R. A., et al. 1995, Nature, 374, 141
- Turner & Ho (1994) Turner J. L., Ho P. T. P., 1994, ApJ, 421, 122
-
Ubeda (2014)
Ubeda L e. a., 2014, ACS Instrument Handbook Version 13.0.
STScI, Baltimore. Retreived from
http://www.stsci.edu/hst/acs/documents/handbooks/
current/cover.html - Ulvestad (2009) Ulvestad J. S., 2009, AJ, 138, 1529
- Ulvestad & Antonucci (1997) Ulvestad J. S., Antonucci R. R. J., 1997, ApJ, 488, 621
- Ulvestad et al. (2005) Ulvestad J. S., Wong D. S., Taylor G. B., Gallimore J. F., Mundell C. G., 2005, AJ, 130, 936
- Vinkó et al. (2012) Vinkó J., Takáts K., Szalai T., et al. 2012, A&A, 540, A93
- Weiler et al. (2002) Weiler K. W., Panagia N., Montes M. J., Sramek R. A., 2002, ARA&A, 40, 387
- Weiler et al. (2011) Weiler K. W., Panagia N., Stockdale C., Rupen M., Sramek R. A., Williams C. L., 2011, ApJ, 740, 79
- Weiler et al. (1986) Weiler K. W., Sramek R. A., Panagia N., van der Hulst J. M., Salvati M., 1986, ApJ, 301, 790
- White et al. (1997) White R. L., Becker R. H., Helfand D. J., Gregg M. D., 1997, ApJ, 475, 479
Appendix A LR Method
The ratio used in Sect. 3.2.2 to estimate the likelihood that a pixel in a VLBI image is associated with a catalogued source (the alternative hypothesis, ), or a noise spike (the null hypothesis, ) is given as,
| (9) |
where p() is the likelihood the pixel is a noise spike and is taken as the Cumulative Distribution Function of the positive half of the Gaussian distribution, while p() is the likelihood the pixel is associated with a catalogued source and is dependent on the position of the pixel in relation to a catalogued source position/morphology as defined by Morgan et al. (2013). Before applying the LR method, the aips task uvfix was used to produce visibilities centred on the catalogued positions allowing the data to be averaged in frequency and time, with little loss of amplitude response due to image smearing. Dirty images were generated for each of the catalogued source positions with the full array222222This test was also conducted for the reduced array of maximum baseline of 7.5 M. However there was no difference in the final result compared to the full array., using parameters: cellsize = 0.5 mas; image size listed in Table 6; and natural weighting. In addition, the outer 512 pixels removed prior to applying the LR method. The required VLBI parameters to search for sources from both catalogues are listed in Table 6.
LR images were generated for each catalogued source and the position of the maximum LR value was visually compared to the corresponding VLBI peak pixel S/N. Pixels with log and were taken as confirmed detections. Tables 7 and 8 list the LR values for the confirmed detections along with the corresponding VLBI image parameters for confirmed detections, and the non-detection with the highest LR value for both surveys. As with the results of Morgan et al. (2013), the LR test was found to be more dependent on the VLBI pixel S/N (i.e. p()), than the positional constraints given by the lower resolution catalogues.
An example of this is displayed in Figure 18, where a VLBI pixel was discovered 6from two FIRST sources, but has log10(LR) values 100 when compared with both FIRST sources. However, pixels that were found to have better positional constraints (i.e. higher values of p()), nevertheless, resulted in lower LR values. As such no significant advantage is given by the LR method over simply detecting the brightest pixels and thus, it is difficult to determine whether pixels with S/N are indeed real detections, and are henceforth considered as resulting from noise.
Of the three Maddox et al. (2007) sources detected by the EVN, two were found with very good agreement between the VLBI and lower resolution source positions (see Figure 18c). It may be possible to use estimates of the positional error of the Maddox et al. (2007) survey to improve the LR method and increase the chance of detecting sources below . However, this is beyond the scope of this study.
| Source | Bmaj | Image size | |
| Catalogue | Count | () | (pixels) |
| (1) | (2) | (3) | (4) |
| FIRST | 15 | 5 | 7936 |
| Maddox (20 cm) | 96 | 1.51 | 1984 |
VLBIpeak S/N (Jy beam-1) (Jy beam-1) (VLBIpeak/) log10(p(Ho)) log10(p(H1)) log10(LR) (1) (2) (3) (4) (5) (6) 326.42a 11.75 27.77 169.4 0.49 168.9 233.00b 10.03 23.24 118.9 0.89 118.0 231.16b 10.09 22.90 115.7 1.09 114.6 84.13c 8.96 9.39 20.5 1.09 19.4 53.35† 9.00 5.93 8.8 0.60 8.2 Source identification (see Table 1): a J123005+471035; b A single VLBI source (J133016+471024) located between two FIRST sources. See Figure 18; c J132952+471142. † The non-detection with the highest LR. (6) The likelihood ratio parameter of the brightest pixel in the image. See text for details.
| VLBIpeak | S/N | ||||
| (Jy beam-1) | (Jy beam-1) | (VLBIpeak/) | log10(p(Ho)) | log10(p(H1)) | log10(LR) |
| (1) | (2) | (3) | (4) | (5) | (6) |
| 327.26a | 17.33 | 18.31 | 74.5 | 0.49 | 74.0 |
| 317.42b | 30.23 | 10.82 | 26.9 | 0.40 | 26.5 |
| 86.07c | 10.12 | 8.51 | 17.0 | 0.30 | 16.7 |
| 47.48† | 8.52 | 5.57 | 7.9 | 0.60 | 7.3 |
| Notes. Symbols and headings have same meaning as Table 7 | |||||
| Source identification (see Table 1): a J133005+471035; b J133011+471041; c J132952+471142. | |||||