Far Ultraviolet Spectroscopy of Old Novae I. V603 Aquila11affiliation: Based on observations made with the NASA-CNES-CSA Far Ultraviolet Spectroscopic Explorer (FUSE). FUSE was operated for NASA by the Johns Hopkins University under NASA contract NAS5-32985.
Abstract
We present the results of a synthetic spectral analysis of the far ultraviolet archival IUE, HST and FUSE observations of the fast old nova V603 Aql, obtained some 90 years after its 1918 nova outburst. Our analysis utilizes the new Hubble FGS parallax distance for this nearly face-on old nova, a high white dwarf mass and a low reddening. Our analysis includes non-truncated optically thick accretion disks since V603 Aql is neither a polar nor an intermediate polar. Our synthetic spectral modeling of the FUSE and HST spectra analyzed separately indicate a mass transfer rate /yr for the FUSE and HST spectra respectively, assuming a WD mass of . The mass accretion rate also depends on the assumed WD mass, and increases by a factor of two for a WD mass of . Combining the FUSE and HST spectra together lead to the same results. Potential implications are discussed.
Key words. stars: binaries: old novae: fundamental parameters X-rays: binaries X-rays: individuals: V603 Aql
1 Introduction
There is much that we do not know about old novae (post-classical novae in, or approaching, quiescence). Do they become dwarf novae as their accretion rates drop? When does nuclear burning and hence the soft X-ray production stop following the nova explosion? What are the accretion rates of old novae as a function of time since the nova explosion? Is there enhanced mass transfer due to irradiation of the secondary donor star (causing the donor to bloat and/or by driving a wind off of the donor star) by the hot white dwarf and/or hot accretion disk?
All of the above questions tie into a critical test of whether or not the hibernation theory of cataclysmic variable evolution is viable (Shara et al. 1986). Hibernation theory posits that the mass transfer in CVs declines after the nova occurs because the secondary star detaches from its Roche lobe due to the angular momentum loss from the nova explosion. These systems would become unobservable (extinct) until magnetic stellar wind mass loss and gravitational wave radiation lead to the resumption of Roche lobe overfill by the donor star, and mass transfer. A knowledge of the mass transfer behavior of old novae as a function of time since the outburst is a potentially critical test of hibernation theory. Thus far, this theory has not been supported by long term optical observations (e.g. Schaefer (2014a, b)). The results of testing hibernation theory up to now have been mixed.
Soon after the nova outburst, the post-nova will radiate at a very high bolometric luminosity (but not quite the Eddington limit) until hydrogen is destroyed by nuclear reactions, thus causing the H shell burning to stop. The time scale for this to occur is predicted to be in the range of 1 year to 10 years, possibly as long as 300 years depending upon the mass of the WD and the amount of H left on the WD after the nova explosion, and is inversely dependent on the white dwarf mass. As mass is lost and the envelope shrinks, the effective temperature increases until exceeding K, and the peak emission moves to the UV and then to the EUV and soft X-ray ranges. Therefore, in these spectral regions the nova turn-off should be best observed (Selvelli et al., 1989).
The old nova V603 Aql (Nova Aquilae 1918) offers a number of advantages for a synthetic spectral analysis. This is important because it allows us to constrain the accretion rate in old novae by modeling the accretion disk with synthetic disk spectra. The accretion disk light is typically the dominant source of FUV flux in these systems.
Fortunately, V603 Aql has an accurate trigonometric parallax and far ultraviolet archival HST and FUSE observations. Our analysis utilizes the new Hubble FGS parallax distance of 249 pc pc (Harrison et al., 2013) which removes one critical free parameter in model fitting. The system has had many fairly good quality far ultraviolet spectra obtained with IUE, an HST STIS spectrum (Selvelli & Gilmozzi, 2013) covering much of the far UV wavelength range covered with IUE and also a FUSE spectrum (Selvelli & Gilmozzi, 2013) enabling the model fitting to extend down to the Lyman Limit. It is known to have a low orbital inclination () making it nearly face-on to the observer (Ritter & Kolb, 1998), a range of possible white dwarf mass from (Warner 1976) to , raising the possibility that it could eventually be a SN Type Ia progenitor, and it has a low reddening E(B-V) = 0.07-0.10 (Gallagher & Holm (1974); this paper). The physical and orbital parameters from the literature are summarized in Table 1. In view of these observed and derived parameters, we seek to determine or tightly constrain the accretion rate of V603 Aql and any other properties that we can derive from synthetic spectral modeling of the system.
2 Far Ultraviolet Archival Spectra
There are 110 far ultraviolet spectra obtained for V603 Aql with the short wavelength prime camera (SWP) on the IUE spacecraft. The IUE SWP spectra cover the wavelength range 1150-1978Å , while the IUE LWP spectra cover the 1885-3165Å spectral range. However, because V603 Aql has very good and high S/N HST/GHRS archival spectra, we do not use the IUE spectra for the spectral fits. Instead we use IUE SWP+LWP spectra to assess the reddening E(B-V) using the method of Verbunt (1987). Namely, we deredden a spectrum covering the 2175Å ‘bump‘ for different values of E(B-V) and then we inspect the resulting dereddened spectra. The dereddened spectrum for which the 2175Å ‘bump‘ vanishes indicates the E(B-V) value. In Fig. 1 we show the actual dereddened spectra. We find a reddening E(B-V)= which we adopt in this work. Using the 2175Å feature to estimate E(B-V) introduces an error of up to 20% Fitzpatrick (1999). Consequently we have . All of the HST and FUSE fluxes presented here were de-reddened using the IUERDAF IDL routine, UNRED, with . In the discussion we evaluate the error on due to an error on .
V603 Aql was observed with FUSE over seven FUSE orbits in June 2002. Since the inclination is low, we decided to combine the exposures together without considering possible changes due to the orbital phase. Nonetheless, we checked the individual exposures (FUSE orbits) of the spectrum and found that the continuum flux level varies by no more than 10% from one orbit to the other. The largest variation occur near the O vi doublet and Ly region, possibly due to the combined effects of broad absorption and emission of these species. The change only mildly affects the absorption lines. We note, in passing, that IUE observations have shown Borczyk et al. (2003) that both the continuum flux level and the emission lines (e.g. Civ 1550) fluctuate with time and the ‘scatter‘ is of the order of 100% in the 1992 IUE data (note that it is only % in the 1989 IUE data). The FUSE observations were obtained on 2002-06-07 with the LWRS in TIMETAG mode with a total exposure time of 16,807 s. FUSE has a spectral range covering the higher order of the Lyman series, namely from Å to Å . We combined these FUSE exposures together and then extracted the co-added spectrum from the combined fits files. We follow the procedure described in Godon et al. (2012) to process the FUSE spectra. Because the SiC channels (1aSiC, 1bSiC, 2aSiC, 2bSiC) did not collect much data, the spectrum starts at 980Å (instead of 910Å ) and it has a gap around 1085Å . The resulting combined FUSE spectrum is displayed in Fig.2 where the strongest absorption and emission features are identified. Some significant interstellar absorption (molecular hydrogen) affects the spectrum.
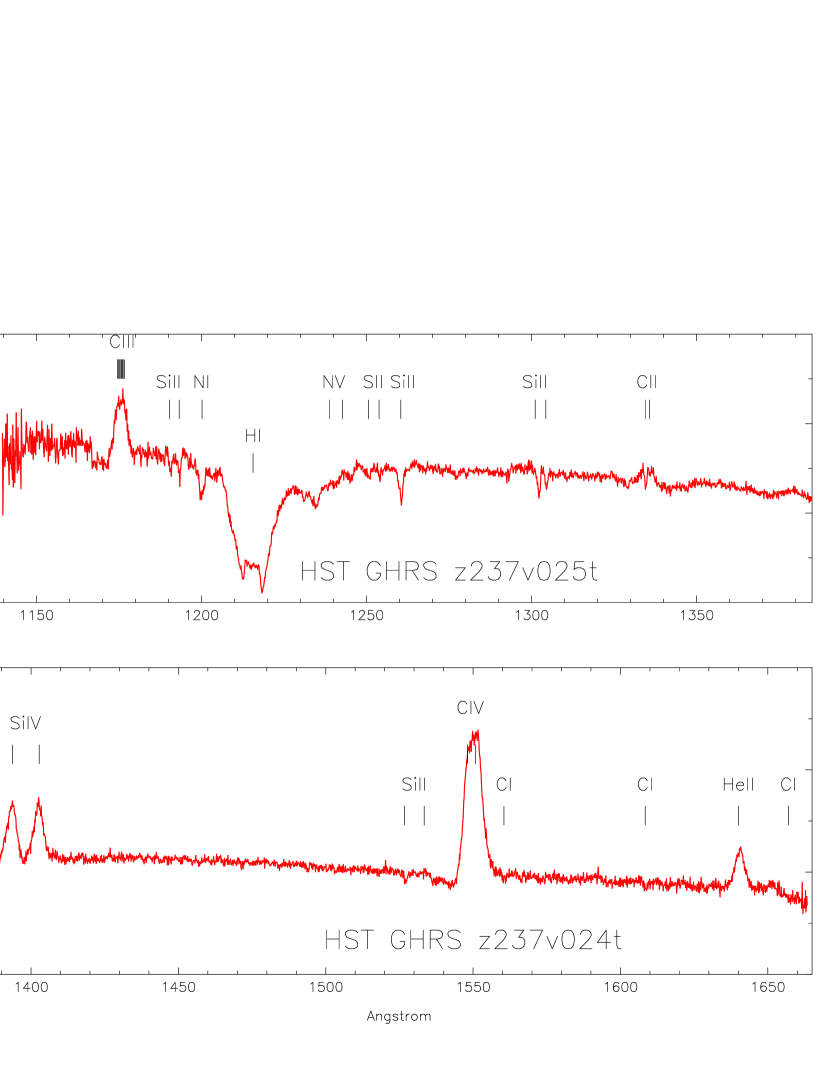
The HST GHRS spectrum of V603 Aql we use here is the combination of the z37v0204t and z37v0205t exposures which were obtained on 1996-10-06 with the G140L/2.0 configuration. The first exposure covers the 1140-1435Å spectral range, while the second exposure covers the 1367-1663Å spectral range. These pipeline-processed spectra were downloaded (as ascii/vo tables) from the virtual observatory using VOSpec. In Fig.3, we display the HST/GHRS combined z37v0204t+z37v0205t spectrum as flux versus wavelength in Angstroms - Å , covering together the spectral region from 1140Å to 1663Å . Note the Ly absorption line (which may have an interstellar contribution), steeply rising continuum and strong emission lines due to C iii (1175), Si iv (1394, 1402), C iv (1548, 1551) and He ii (1640).
3 Synthetic Spectral Analysis
We adopted model accretion disks from the optically thick, steady state disk model grid of Wade & Hubeny (1998). In these accretion disk models, the outermost disk radius, , is chosen so that is near 10,000K since disk annuli beyond this point, which are cooler zones with larger radii, would provide only a very small contribution to the mid and far UV disk flux. For the disk models, every combination of , inclination and white dwarf mass was fitted to the data. We selected those models with inclination angle and /yr) = -8.0, -8.5, -9.0, -9.5, -10.0, -10.5. For the WD models, we used TLUSTY Version 203 (Hubeny, 1988) and Synspec48 (Hubeny & Lanz, 1995) to construct a grid of temperatures from 12,000K to 60,000K in steps of 1,000K to 5,000K, with corresponding to the white dwarf mass of the accretion disk model.
The analysis of the FUV spectra of V603 Aql is strengthened by the fact that the distance is accurately known (249 +8/-9 pc) thus removing one free parameter. The inclination is very low (13 - 15 degrees) and the white dwarf mass (0.9 to 1.2 ) is known to within . Since the distance is known, for a given WD mass (and therefore radius), the best-fitting accretion disk model is obtained simply by scaling the model to the distance published from Hubble FGS trigonometric parallax, namely 249 pc +8/-9 pc. Since we feel secure with both the distance and the low inclination of V603 Aql, essentially two critical free parameters are tightly constrained. We present the results of our synthetic spectral fitting with disks and photospheres in Section 4 where we have modeled the FUSE spectrum alone, the HST spectrum alone and finally, the combination of the FUSE + HST spectrum to attempt to consistently fit a broader wavelength baseline, than HST and FUSE individually.
4 Synthetic Spectral Fitting Results
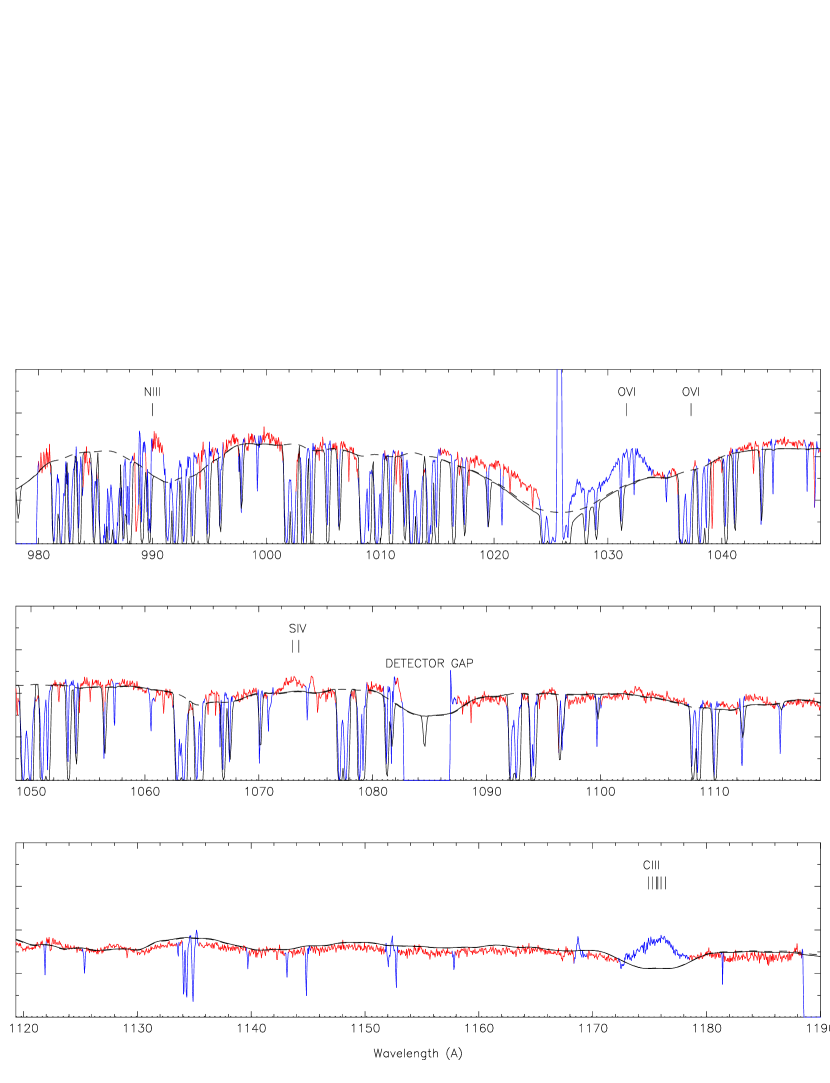
We started by fitting the FUSE spectrum alone for the combination of parameters in our disk and white dwarf model grids (see previous section) with the distance fixed at 249pc, and for white dwarf masses of 0.8, 1.0 and 1.2 . A single WD model, without a disk, could not fit the data. Namely, the white dwarf is relatively massive and has a small radius, and consequently its contribution to the overall flux was of the order of % and did not affect the results. Realistic best fits were obtained for disk models, and we included a moderately hot WD (K) for the sake of completeness even though the WD did not affect the results. The mass accretion rate of the disk model fit depended mainly on the WD mass and we list for each different value of () in Table 3. We present the model fit for the case in Figure 4. The model has /yr, deg (the lowest inclination in our disk model grid) and pc The model fit, as explained in the Figure, was carried out between the continuum unaffected by ISM absorption (in red) and the synthetic spectrum (solid black line). Excess flux appears in all the fitting and indicates broad emission from N iii (990), H i (1026), O vi (1032) C iii (1175), and possibly from S iv (1173). The C iii and O vi emission were masked before the fitting as they were readily apparent while the other lines were not.
Next we fit the HST/GHRS spectrum alone, masking the emission lines and the bottom of the Ly region. The model fit resulted in an accretion rate very similar to what we obtained by modeling the FUSE spectrum, as shown in Table 3 for the different WD masses assumed. The model fit to the HRS spectrum is shown in Figure 5 for . The model fit has the following parameters: , deg, and a corresponding accretion rate of /yr. The overall slope of the observed spectrum is more shallow than the slope of the synthetic spectrum, and this is apparent especially in the longer wavelengths. This might be due to the contribution of a colder component peaking in the NUV or optical which we are not modeling (see discussion), due to either the irradiated donor star or the hot spot at the outer rim of the accretion disk where the gas stream from the inner Lagrangian point impacts supersonically onto the disk.
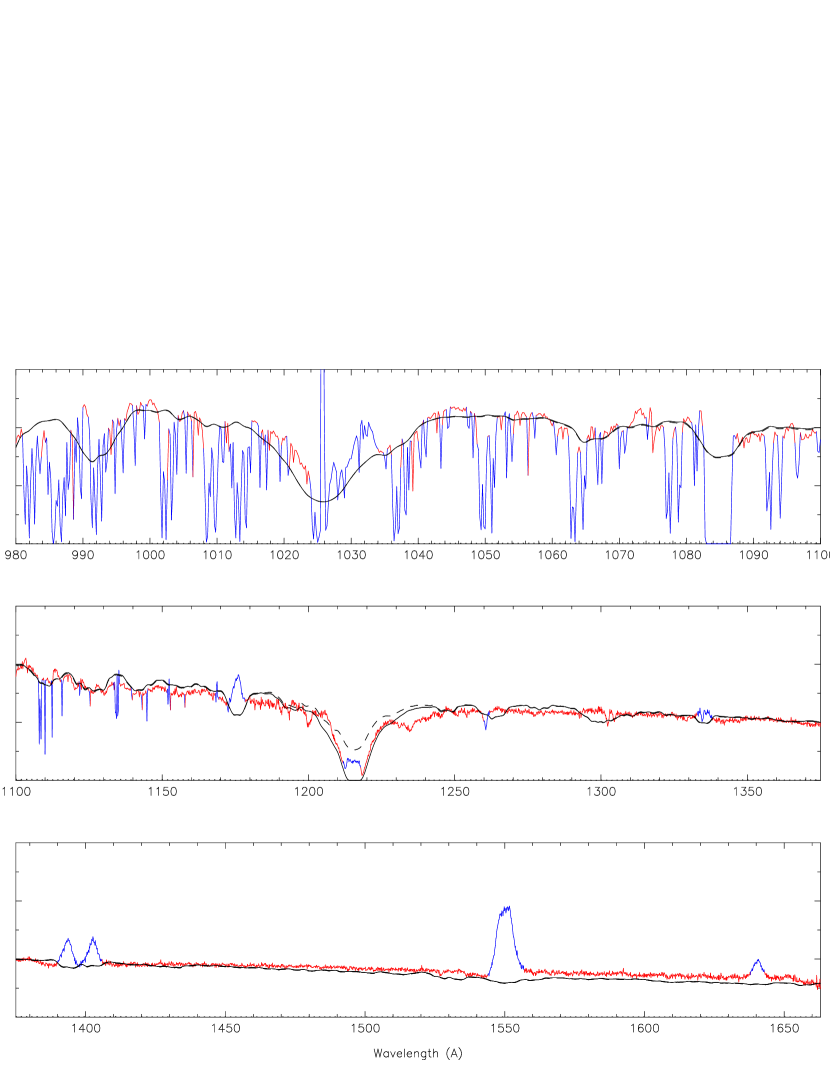
Lastly, we fit the FUSE+HRS combined spectrum, to increase the wavelength range. For this purpose we had to scale the spectra to each other and multiplied the GHRS spectrum by a factor of 0.80. As before, we fixed the distance to 249 pc and obtained results almost identical to the FUSE spectral fit results. In Table 3, we summarize the accretion rates derived from the fitting. In Figure 6, we display the fit for the model. For clarity we have intentionally removed the ISM molecular hydrogen modeling in the shorter wavelengths, but we kept it in the Ly region. Here too we see that in the longer wavelengths the observed spectrum has extra flux, indicating the possible presence of a colder component.
Overall however, we are satisfied that we have achieved a robust value of the accretion rate of V603 Aql.
For our accretion rate, and with the assumption that compressional heating alone is operating, we transform our rate of accretion to a white dwarf effective temperature. This yields K. The accreting white dwarf in the system contributes only about % of the FUV flux.
5 Discussion
It is not surprising that the FUV spectrum of the old Nova V603 Aql is dominated by accretion light from its optically thick accretion disk since old novae generally appear to sustain high accretion rates due most likely to the heating and irradiation effects on the secondary star by the nova outburst. The FUV spectra we used were obtained in 1996 and 2002, 78 and 84 years after the 1918 nova explosion. It is therefore not unusual to have an accretion rate as high as we have derived. Puebla et al. (2007) found an accretion rate of /yr, using a different model-fitting method (statistical optimization) than ours.
Since our model fitting depends sensitively on the observed continuum level and slope and there is an error range of reddening values E(B-V), namely , it is of interest to explore how the corrected fluxes are affected, and hence the derived accretion rate. The range of error in E(B-V) (0.02) affects the corrected flux by a factor of 0.85, such that for E(B-V)=0.08, the flux is decreased to 0.85 the value it has for E(B-V)=0.10; and for E(B-V)=0.12 the flux is increased to 1/0.85 (=1.17). To a first order estimate, the mass accretion itself is directly proportional to the flux, such that the error on , due to the reddening error, is (-15% and +17%).
As stated in Section 2, we used the IUERDAF script ‘unred’ (IDL routine) which by default uses the reddening law of Savage & Mathis (1979) assuming R=3.1. This option gives the same results as the reddening law by Seaton (1979) and uses the same value of R, 3.1, which is an average of the Galactic (Milky Way) reddening. Ideally the value of R has to be known in the direction of the object, as it varies in the Galaxy by more than a factor of 2 from about 2.2 to 5.5 (Fitzpatrick 1999). The reddening itself, E(B-V), varies like 1/R, and consequently the possible error in R introduces an additional error of +41% (=3.1/2.2 - 1.0) and -44% (3.1/5.5 - 1.0) in the value of the reddening and in its law (this is assuming that R could be as low as 2.1 or as high as 5.5). We cannot rule out that the discrepancy between the observed spectrum and the model is due to the reddening law we are using. Since R is unknown, however, it is standard practice to use the 3.1 value and the ‘standard’ reddening law by Seaton (1979).
Recent work by Johnson et al. (2014) has shown that V603 Aql returned to deep quiescence by 1938 and is fading in the optical at a rate of 0.44 +/- 0.02 magnitudes per century. The Hibernation model of Shara et al. (1986) predicts that old novae should fade by roughly one magnitude per century. The gradual cooling of the white dwarf reduces the irradiation thus allowing the donor star to relax into thermal equilibrium again, eventually detaching from its Roche lobe and hence entering hibernation. There is little doubt that in V603 Aql, there is enhanced mass transfer due to irradiation of the secondary donor star (causing the donor to bloat and/or by driving a wind off of the donor star) by the hot white dwarf and/or hot accretion disk. Since the FUSE spectrum was taken 6 years after the HST spectrum, it is tempting to speculate the difference in mass accretion rate obtained from fitting the FUSE and HST spectra is due to an actual decrease of the mass accretion rate (about 8%). However, based on the IUE data, it is very likely that the change in the continuum flux level between the HST data and the FUSE data is solely due to the fluctuations of the UV source as described by Borczyk et al. (2003).
Based upon the present data, we do not know how close V603 Aql is to the termination of its irradiation-induced, enhanced mass transfer (cf. Tappert et al. (2013)). Since V603 Aql has been shown to be essentially non-magnetic (Borczyk et al., 2003; Mukai & Orio, 2005), then the strong persistent He II (1640) emission line may originate in the hot inner disk region still irradiated by the heated central white dwarf.
V603 Aql was observed with ASCA, and a mass accretion rate of only /yr was derived by Mukai & Orio (2005). This is much smaller than the value we derived here, however, most CVs at high mass accretion rates usually exhibit an X-ray derived mass accretion rate much smaller than derived from UV spectral analysis. A possible explanation is that the boundary layer is optically thin (Popham & Narayan, 1995) and cannot radiate efficiently. Its energy is advected into the outer layer of the accreting white dwarf, thereby increasing its temperature. The HST-GHRS observations of Friedjung et al. (1997) reveal the presence of a chromosphere-corona which surrounds the accretion disk and co-rotates with it which they associate with the emission lines which are rotationally broadened. The blue-shifted absorption is the result of the wind outflow photo-ionized by the hot innermost disk/boundary layer. The inference of a disk corona in the above study suggests that the X-rays may arise from the corona.
6 acknowledgements
This work is supported by NASA grants NNX13AF12G and NNX13AF11G to Villanova University. We are grateful to an anonymous referee whose helpful comments have improved our paper. PG is thankful to William P. Blair for his kind hospitality in the Henry A. Rowland Department of Physics and Astronomy at the Johns Hopkins University, Baltimore, MD.
References
- Arenas et al. (2000) Arenas et al. 2000, MNRAS, 311, 135
- Borczyk et al. (2003) Borczyk, W., Schwarzenberg-Czerny, A., & Szkody, P. 2003, A&A, 405, 663
- Duerbeck (1987) Duerbeck, H. 1987, Ap&SS, 131, 461
- Fitzpatrick (1999) Fitzpatrick, E.L., 1999, PASP, 11, 63
- Friedjung et al. (1997) Friedjung, M., Selvelli, P., Cassatella, A. 1997, A&A, 318, 204
- Gallagher & Holm (1974) Gallagher, J. S. & Holm, A. V. 1974, ApJ, 189, L123
- Godon et al. (2012) Godon, P., et al. 2012, ApJS, 203, 29
- Harrison & Gehrz (1988) Harrison & Gehrz 1988, AJ, 96, 1001
- Harrison et al. (2013) Harrison et al. 2013, ApJ, 767, 7
- Hubble & Duncan (1927) Hubble, E. & Duncan, J.C., 1927, ApJ, 66, 59
- Hubeny (1988) Hubeny, I. 1988, Computer Physics Communications, 52, 103
- Hubeny & Lanz (1995) Hubeny, I., & Lanz, T. 1995, ApJ, 439, 875
- Johnson et al. (2014) Johnson, C.B., Schaefer, B.E., Kroll, P., Henden, A.A. 2014, ApJ, 780, 25
- McLaughlin (1960) McLaughlin, D.B. 1960, in Stellar atmospheres, Ed. by J.L. Greenstein,(Chicago: University of Chicago Press), p.585
- Mukai & Orio (2005) Mukai, K. & Orio, M. 2005, ApJ, 622, 602
- Puebla et al. (2007) Puebla, R.E., Diaz, M.P., Hubeny, I. 2007, AJ, 134, 1923
- Popham & Narayan (1995) Popham, R., & Narayan, R. 1995, ApJ, 442, 337
- Ritter & Kolb (1998) Ritter, H., & Kolb, U. 1998, A&A, 129, 83
- Savage & Mathis (1979) Savage, B.D., & Mathis, J.S. 1979, ARA&A, 17, 73
- Schaefer (2014a) Schaefer, B. 2014a, BAAS,224, 412.02
- Schaefer (2014b) Schaefer, B. 2014b, private communication, Columbia CV Workshop, December, 2014
- Seaton (1979) Seaton, M.J., 1979, MNRAS, 187, 73
- Selvelli et al. (1989) Selvelli et al. 1989 Lecture Notes in Physics, vol.369, IAU Colloq.122
- Selvelli & Gilmozzi (2013) Selvelli, P., & Gilmozzi, R. 2013, A&A, 560, 49
- Shara et al. (1986) Shara, M., Livio, M., Moffat, A., & Orio, M. 1986, ApJ, 311, 163
- Tappert et al. (2013) Tappert et al. 2013, MNRAS, 431, 92
- Verbunt (1987) Verbunt, F. 1987, A&AS, 71, 339
- Wade & Hubeny (1998) Wade, R., & Hubeny, I. 1998, ApJ, 509, 350
| Parameter | Value | Reference |
|---|---|---|
| Explosion Date | 1918 | |
| Nova Speed Class | Fast | |
| Orbital Period | 3.317 h (0.138201 d) | Ritter & Kolb (1998) |
| Inclination | 13-15 degrees | Ritter & Kolb (1998) |
| Distance | 330pc | Duerbeck (1987) |
| 360pc | Hubble & Duncan (1927) | |
| 380pc | McLaughlin (1960) | |
| 430pc | Harrison & Gehrz (1988) | |
| 237pc | Hipparcos Parallax | |
| 249pc | Hubble FGS parallax (Harrison et al., 2013) | |
| Visual Magnitude | 11.64 | Ritter & Kolb (1998) |
| E(B-V) | 0.07 | Gallagher & Holm (1974) |
| White Dwarf Mass | 1.2 | Ritter & Kolb (1998) |
| 0.9 | Warner 1976) | |
| Donor star mass | 0.29 | Ritter & Kolb (1998) |
| Telescope/ | Filter/Grating | Obs.ID | Obs.Date | Obs.Time | Exp.time | |
|---|---|---|---|---|---|---|
| Instrument | DD/MM/YYYY | HH:MM:SS | sec | Å | ||
| HST/GHRS | G140L/2.0 | z37v0204t | 06/10/1996 | 07:25:34 | 1088 | 1367-1663 |
| HST/GHRS | G140L/2.0 | z37v0205t | 06/10/1996 | 07:49:02 | 544 | 1140-1435 |
| FUSE | LWRS | q1130101000 | 07/06/2002 | 16:27:19 | 16807 | 980-1188 |
| FUSE | HRS | FUSE+HRS | |
|---|---|---|---|
| 0.8 | |||
| 1.0 | |||
| 1.2 |