HATS-8b: A Low-Density Transiting Super-Neptune $\dagger$$\dagger$affiliation: The HATSouth network is operated by a collaboration consisting of Princeton University (PU), the Max Planck Institute für Astronomie (MPIA), the Australian National University (ANU), and the Pontificia Universidad Católica de Chile (PUC). The station at Las Campanas Observatory (LCO) of the Carnegie Institute is operated by PU in conjunction with PUC, the station at the High Energy Spectroscopic Survey (H.E.S.S.) site is operated in conjunction with MPIA, and the station at Siding Spring Observatory (SSO) is operated jointly with ANU. This paper includes data gathered with the 6.5 m Magellan Telescopes located as Las Campanas Observatory, Chile. Based in part on observations made with the MPG 2.2 m Telescope and the ESO 3.6 m Telescope at the ESO Observatory in La Silla. This paper uses observations obtained with facilities of the Las Cumbres Observatory Global Telescope.
Abstract
HATS-8b is a low density transiting super-Neptune discovered as part of the HATSouth project. The planet orbits its solar-like G dwarf host (V=, = K) with a period of d. HATS-8b is the third lowest mass transiting exoplanet to be discovered from a wide-field ground based search, and with a mass of it is approximately half-way between the masses of Neptune and Saturn. However HATS-8b has a radius of , resulting in a bulk density of just . The metallicity of the host star is super-Solar (=), arguing against the idea that low density exoplanets form from metal-poor environments. The low density and large radius of HATS-8b results in an atmospheric scale height of almost 1000 km, and in addition to this there is an excellent reference star of near equal magnitude at just 19″ separation on the sky. These factors make HATS-8b an exciting target for future atmospheric characterization studies, particularly for long-slit transmission spectroscopy.
Subject headings:
planetary systems — stars: individual (HATS-8) — techniques: spectroscopic, photometric1. Introduction
While the Solar System planets display a rich diversity of physical properties, the discovery of exoplanets over the last two decades have revealed an even wider range of systems. The mass regimes of exoplanets is an example of this expanding diversity. The discovery of “super-Earths” (Rivera et al., 2005), with masses of , have shown us a type of planet unlike anything in our Solar System. It now appears that planets in this mass range are relatively common in the Galaxy (Fressin et al., 2013), although for many planets discovered by Kepler the masses can only be inferred from radii in a statistical sense (using mass-radius relationships) due to the difficulties of measuring radial velocities or transit timing variations for small planets orbiting faint host stars.
Another mass-class of planets that we only find outside our Solar System are planets more massive than Neptune at 0.05, but smaller than Saturn at 0.3. These low mass gas planets, or “super-Neptunes” are at the very transition between planets with H/He dominated compositions and those without H/He dominating the bulk composition. In this paper we present the discovery of HATS-8b, a transiting super-Neptune found as part of the HATSouth survey for southern transiting exoplanets Bakos et al. (2013). HATS-8b has a mass lying almost half-way between Neptune and Saturn. One of the great advantages of ground-based transit surveys that target bright stars is that we can measure both the mass and radius of discovered exoplanets, and therefore we are able to determine the density of the exoplanet. This is particularly important at these mass-ranges, as we cannot infer the radius from the mass alone or vice versa.
In Section 2 of this paper we outline the photometric and spectroscopic observations that led to the detection of HATS-8b. In Section 3 we detail the methods we used to determine the physical parameters of the planet and star as well as ruling out non-planetary interpretations of the data. Finally, in Section 4 we put HATS-8b into context with other exoplanets discovered in this mass/density range, and discuss the fact that this exoplanet orbits a super-solar metallicity star. We also discuss the possible follow-up opportunities for this system from the ground and from space.
2. Observations
2.1. Photometric detection
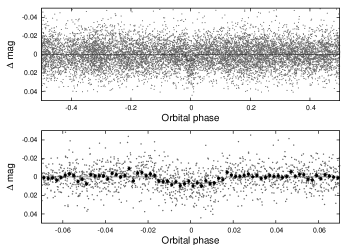
HATS-8 was intensively monitored as part of the HATSouth survey (Bakos et al., 2013). Although some data was acquired as early as September 2009, the bulk of the observations, over 10,000 images, were taken between March 2011 and August 2011 (see Table 1). Details of the HATSouth imaging system can be found in Bakos et al. (2013); Penev et al. (2013), while here we provide a summary of the critical features. HATSouth employs Takahashi astrographs (, 18cm apertures) imaged on to Apogee U16M cameras. Imaging is performed in the Sloan band with exposure times of 240s and a mean cadence of approximately 300s. Images are collected from all three sites in the global network (see Table 1, which also gives a breakdown of the number of images taken at each site), and data is reduced and light curves produced via aperture photometry in the manner detailed in Penev et al. (2013). Light curves are detrended using External Parameter Decorrelation (EPD; Bakos et al., 2010) and the Trend Filtering Algorithm (TFA; Kovács et al., 2005)). The detrended light curve for HATS-8 is set out in Table 2. We search light curves for periodic transit-like events using the Box-fitting Least Squares algorithm (BLS Kovács et al., 2002). For the case of HATS-8, we find a transit signal at a period of P= days with a depth of mmag (see Figure 1). No observable out-of-transit variation or secondary eclipse is apparent. We therefore began reconnaissance spectroscopic observations of this candidate as is detailed in Section 2.2.
| Facility | Date(s) | Number of Images aa Excludes images which were rejected as significant outliers in the fitting procedure. | Cadence (s) bb The mode time difference rounded to the nearest second between consecutive points in each light curve. Due to visibility, weather, pauses for focusing, etc., none of the light curves have perfectly uniform time sampling. | Filter | Precision (mmag) |
|---|---|---|---|---|---|
| HS-1/G579 | 2009 Sep–2011 Aug | 4484 | 301 | band | 13.9 |
| HS-3/G579 | 2010 Mar–2011 Aug | 2607 | 303 | band | 13.3 |
| HS-5/G579 | 2010 Sep–2011 Aug | 3303 | 303 | band | 12.2 |
| Swope/SiTe3 | 2013 May 29 | 107 | 213 | band | 2.3 |
| Swope/E2V | 2014 Jul 01 | 116 | 189 | band | 1.8 |
| LCOGT 1m/Sinistro | 2014 Jul 09 | 50 | 347 | band | 3.5 |
2.2. Reconnaissance Spectroscopy
Although a periodic dip in the light curve of a star may be due to a transiting exoplanet, there are many other astrophysical sources of such a signal, which can be termed “false positives”. Blended eclipsing binaries and grazing eclipsing binaries are common causes of false positives. Other candidates can be “false alarms”; that is the detected event is non-astrophysical in nature. These can be caused by artifacts on the CCD or period systematics introduced by the telescope or mount systems. The combination of all of these false candidates, coupled with a desire to find shallow transits (i.e. smaller radius planets), means that the majority of candidates produced by ground-based transit surveys such as the HATSouth survey are not genuine transiting exoplanets. It is therefore crucial to undertake an efficient vetting program of transiting exoplanet candidates by way of reconnaissance spectroscopy before attempting the resource intensive search for subtle radial velocity variations consistent with an orbiting exoplanet. Such reconnaissance spectroscopy will become even more critical as large surveys such as TESS (Ricker et al., 2014) and PLATO (Rauer et al., 2014) produce enormous numbers of candidates requiring such vetting.
The candidate HATS-8b is a good example of low a signal-to-noise detection, with a transit depth in the discovery light curve of just 8.3 mmag, compared to an RMS precision of the light curve per observation of 12 to 14 mmag level (see Table 1).
In the case of HATS-8, follow-up spectroscopy was performed in October 2012 using the echelle spectrograph on the 2.5 m Du Pont telescope at Las Campanas Observatory in Chile. We obtained two spectra using the slit (R40000) on the nights of October 25 and October 26 2012, each with an exposure time of 1800 s. From these observations we calculated that HATS-8 was a G-dwarf with a low projected rotational velocity () and there was no sign of a secondary spectrum that could be indicative of a binary system. A further observation of HATS-8 was obtained with the FEROS spectrograph (Kaufer & Pasquini, 1998) on the MPG 2.2 m telescope at the ESO Observatory in La Silla, Chile. This instrument, with slightly higher spectral resolution, confirmed the Du Pont finding that HATS-8 is a G-dwarf with low and no evidence of a composite spectrum. The three observations also showed no radial velocity variation to within the uncertainty of the measurements, indicating the system could not be a eclipsing binary system with a large radial velocity amplitude. Details of the three reconnaissance spectra taken for HATS-8 are set out in Table 3. Based on the reconnaissance spectroscopy, HATS-8 was deemed to be a sufficiently strong candidate to warrant undertaking precise photometric and radial velocity measurements as detailed in Sections 2.3 and 2.4 respectively.
2.3. Precise Photometric Follow-up
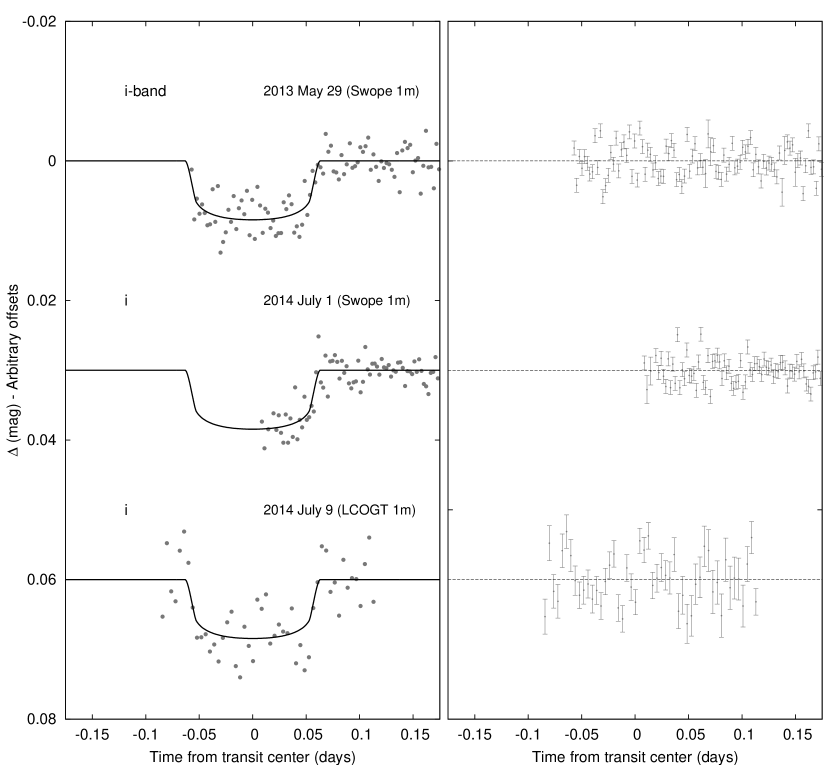
Precise photometric observations of a transit of HATS-8b were carried out using the SiTe3 imaging camera on the SWOPE 1m telescope at Las Campanas Observatory (LCO) in Chile on 2013 May 29. Defocused imaging over the 14.822.8 field was performed in band with exposure times of 120s. The images were reduced and aperture photometry extracted in the standard manner as set out in Penev et al. (2013). Figure 2 shows the resulting light curve, which covers all but the ingress of the transit on that night, and allows for a very precise determination of the period and phase of HATS-8b. Using this precise ephemeris, a second photometric observations of transits of HATS-8b was obtained with the 1m SWOPE telescope on the night of 2014 July 1. Again the monitoring was carried out in band, this time using the E2V imaging camera with exposure times of 150s. The egress of the transit of HATS-8b was detected with these observations, as detailed in Figure 2. Finally, nine days later we observed another transit of HATS-8b, this time using the LCOGT 1m telescope network (Brown et al., 2013). This observation was carried out with the LCOGT 1m telescope at CTIO in Chile using the Sinistro imaging camera in band with a 300 s exposure time and the telescope slightly defocused. The observation covered a full transit. The transits are shown in Figure 2.
All three transit events monitored with higher precision photometry confirmed the transit signal detected in the HATSouth discovery light curves. The depth and shape of the transit are consistent with that expected from a transiting exoplanet, and we use these data in combination with the discovery photometry to determine the global parameters of the HATS-8b system in Section 3.
| BJD | Magaa The out-of-transit level has been subtracted. For the HATSouth light curve (rows with “HS” in the Instrument column), these magnitudes have been detrended using the EPD and TFA procedures prior to fitting a transit model to the light curve. Primarily as a result of this detrending, but also due to blending from neighbors, the apparent HATSouth transit depth is somewhat shallower than that of the true depth in the Sloan filter (the apparent depth is 85% that of the true depth). For the follow-up light curves (rows with an Instrument other than “HS”) these magnitudes have been detrended with the EPD procedure, carried out simultaneously with the transit fit (the transit shape is preserved in this process). | Mag(orig)bb Raw magnitude values without application of the EPD procedure. This is only reported for the follow-up light curves. | Filter | Instrument | |
|---|---|---|---|---|---|
| (2 400 000) | |||||
| HS | |||||
| HS | |||||
| HS | |||||
| HS | |||||
| HS | |||||
| HS | |||||
| HS | |||||
| HS | |||||
| HS | |||||
| HS |
Note. — This table is available in a machine-readable form in the online journal. A portion is shown here for guidance regarding its form and content. The data are also available on the HATSouth website at http://www.hatsouth.org.
2.4. High Precision Spectroscopy
Radial velocity measurements play a critical role in the confirmation and characterization of transiting planets, and are needed to determine the mass, and hence the bulk density, of the exoplanet. HATS-8 is a difficult prospect for radial velocity measurements, as it is relatively faint (V=14.03). For this reason we needed to use Keck/HIRES in order to have the necessary precision and signal-to-noise to measure the radial velocity variations.
We observed HATS-8 with HIRES (Vogt et al., 1994) on Keck-I in Hawaii between June and September 2014. We used HIRES in its standard configuration for precise radial velocity measurements: a slit width of 0.86″, , and wavelength coverage of ∼3800-8000 Å. Exposure times were typically 1500 s and achieved a signal-to-noise ratio of 40 per pixel in the continuum near 5500 Å in the reduced HIRES spectra. An iodine gas absorption cell in the optical path is used to superimpose iodine absorption lines on the stellar spectrum and provide an accurate wavelength calibration (see Marcy & Butler, 1992). A synthetic iodine-free template spectrum is created by interpolating the Coelho (2014) grid of stellar models for the values of , , derived in Section 3.1. We found that using the synthetic template produced smaller residuals and measurement uncertainties when compared to using an observed iodine-free spectrum with moderate S/N as the template. In the case of the synthetic template, no deconvolution is needed to remove the effects of an asymmetric instrumental PSF, and it is completely noise-free. See Fulton (2015) for a more detailed description and performance tests of the synthetic template technique. We derived relative radial velocity measurement for HATS-8 using the method described in Butler et al. (1996), which accounts for variations of the spectrograph instrumental line profile. The radial velocity measurements are listed in Table 4 and plotted in Figure 3, along with the estimated uncertainties in these measurements and the bisector spans of the average spectral line.
We computed spectral line bisector spans from the blue orders of the Keck/HIRES observations following Torres et al. (2007) and corrected these for contamination from scattered moonlight following Hartman et al. (2011a). These data are also represented graphically as a function of orbital phase in Figure 3, along with the best fit circular orbit. No systematic variation is seen in the bisector span measurements, which would have been a signature of a blended system. The overall scatter of the bisector spans is only 9.5 . This is good evidence that HATS-8 is not a blended stellar eclipsing binary system. A more thorough rejection of blends is discussed is Section 3.2.
We measured the emission in the cores of the Ca H&K lines and found a value of -5.179. This value suggests that this star has little chromospheric activity. The residuals of the radial velocity fit show an RMS of 5.1 , which is consistent with the formal uncertainties (see Figure 3) and implies a very faint, chromospherically quiet star.
| Telescope/Instrument | Date Range | Number of Observations | Resolution | Observing Mode |
|---|---|---|---|---|
| du Pont 2.5 m/Echelle | 2012 Oct 25–26 | 2 | 40000 | RECON |
| MPG 2.2 m/FEROS | 2013 July 18 | 1 | 48000 | RECON |
| Keck-I 10 m/HIRES | 2014 June 20 | 1 | 55000 | I2-free template |
| Keck-I 10 m/HIRES | 2014 June 17 – 2014 Sep 10 | 9 | 55000 | I2/HPRV |

| BJD | RVaa The zero-point of these velocities is arbitrary. An overall offset fitted separately to the Keck/HIRES velocities in Section 3 has been subtracted. | bb Internal errors excluding the component of astrophysical/instrumental jitter considered in Section 3. | BS | Phase | Instrument | |
|---|---|---|---|---|---|---|
| (2 456 000) | () | () | () | |||
| Keck | ||||||
| Keck | ||||||
| Keck | ||||||
| Keck | ||||||
| Keck | ||||||
| Keck | ||||||
| Keck | ||||||
| Keck | ||||||
| Keck |
3. Analysis
3.1. Stellar Properties of HATS-8
The analysis of the reconnaissance spectra, described in Section 2.2, indicated that the star HATS-8 is a slowly rotating G-dwarf. We derive more precise stellar parameters by analyzing the iodine-free template spectra taken with Keck/HIRES on 2014 June 20 using the Stellar Parameter Classification (SPC) method as described in the supplementary information to Buchhave et al. (2012). This method involves cross-correlating the observed spectrum between 5050 and 5360 Å with a grid of synthetic templates covering a wide range of , , , and .
Using the method described in Sozzetti et al. (2007) and applied in previous HATSouth discoveries (e.g. Penev et al., 2013), we initially derive the mean stellar density of HATS-8 via light curve fitting, which we determine to be . To determine other stellar properties, we combine this mean stellar density with the from SPC analysis, and the Yonsei-Yale (Y2; Yi et al., 2001) stellar evolution models. This yields a =4.400.06, which we then fix in a second iteration of SPC to derive the final parameters for HATS-8. The final parameters are listed in Table 5, and reveal HATS-8 to be G dwarf host with a = K, a =, and a = . We note that this stellar surface gravity (=) is consistent with the value measured from spectra alone (=). We estimate the age of this system using using the Y2 model isochrones to be Gyr; see Figure 4. All of these stellar parameters make HATS-8 very similar to our own Sun. The primary difference is that the metallicity of HATS-8 is super-Solar at =+.

3.2. Excluding Blending Scenarios
One of the most difficult false positive scenarios to rule out is a background blended eclipsing binary, which is not obvious in either photometric or spectroscopic follow-up. Here we follow the method set out in Hartman et al. (2011c) in order to determine the if the data can be explained by a blended stellar system rather than a transiting exoplanet.
We find that a model consisting of a single star with a transiting planet provides a lower fit to the photometric data than any of the blended eclipsing binary models that we tested. The best-fit blended eclipsing binary model can be rejected in favor of the star+planet model, based solely on the photometry, with greater than confidence. We also simulated cross-correlation functions (CCFs), radial velocities and bisector span measurements for each blended eclipsing binary model considered, and find that all of the models that come close to fitting the photometric data would have easily been detected as composite stellar systems based on the spectroscopic observations (they have clearly double-peaked CCFs and/or radial velocities and bisector spans that vary by more than 1 ). We therefore conclude that HATS-8 is a transiting planet system.
We also considered the possibility that HATS-8 is a transiting planet system with an unresolved stellar companion next to the host star. While we cannot rule out very low mass stellar companions, we find that a companion with can be excluded with greater than confidence. If HATS-8 has a companion, the radius of HATS-8b would be % larger than what we measure assuming no stellar companion; the mass would also be slightly larger.
3.3. Global Modeling of Data
We derive the parameters for the HATS-8b system using a joint, Markov-Chain Monte Carlo method detailed in Bakos et al. (2010), and with modifications set out in Hartman et al. (2012). This method models the best fit parameters in a global way using the discovery photometry, follow-up photometry, and precise radial velocity measurements. The resulting planetary parameters are set out in detail in Table 6. We model the system for both a circular planet orbit and for an orbit where eccentricity is allowed to vary. We calculate the Bayesian evidence for both these scenarios, and find that the circular orbit is preferred. However we also list the confidence upper limit, which is .
Our global modeling reveals that HATS-8b is a exoplanet, which is just 2.5 times the mass of Neptune or one-third the mass of Saturn. The radius is , which results in a bulk density of just = . Its orbital distance of AU implies that HATS-8b would have a temperature of K (assuming zero albedo and a complete redistribution of heat).
| Parameter | Value | Source |
|---|---|---|
| Identifying Information | ||
| R.A. (h:m:s) | 2MASS | |
| Dec. (d:m:s) | 2MASS | |
| 2MASS ID | 2MASS 19394601-2544539 | 2MASS |
| Spectroscopic properties | ||
| (K) | SPC aa SPC = “Stellar Parameter Classification” method based on cross-correlating high-resolution spectra against synthetic templates (Buchhave et al., 2012). These parameters rely primarily on SPC, but have a small dependence also on the iterative analysis incorporating the isochrone search and global modeling of the data, as described in the text. | |
| SPC | ||
| () | SPC | |
| () | FEROS | |
| KECK | ||
| Photometric properties | ||
| (mag) | NOMAD | |
| (mag) | 2MASS | |
| (mag) | 2MASS | |
| (mag) | 2MASS | |
| Derived properties | ||
| () | Isochrones++SPC bb Isochrones++SPC = Based on the Y2 isochrones (Yi et al., 2001), the stellar density used as a luminosity indicator, and the SPC results. | |
| () | Isochrones++SPC | |
| (cgs) | Isochrones++SPC | |
| (cgs) | Isochrones++SPC cc In the case of the parameter is primarily determined from the global fit to the light curves and radial velocity data. The value shown here also has a slight dependence on the stellar models and SPC parameters due to restricting the posterior distribution to combinations of ++ that match to a YY stellar model. | |
| () | Isochrones++SPC | |
| (mag) | Isochrones++SPC | |
| (mag,ESO) | Isochrones++SPC | |
| Age (Gyr) | Isochrones++SPC | |
| (mag) dd Total band extinction to the star determined by comparing the catalog broad-band photometry listed in the table to the expected magnitudes from the Isochrones++SPC model for the star. We use the Cardelli et al. (1989) extinction law. | Isochrones++SPC | |
| Distance (pc) | Isochrones++SPC | |
| Parameter | Value aa The adopted parameters assume a circular orbit. Based on the Bayesian evidence ratio we find that this model is strongly preferred over a model in which the eccentricity is allowed to vary in the fit. For each parameter we give the median value and 68.3% (1) confidence intervals from the posterior distribution. |
|---|---|
| Light curve parameters | |
| (days) | |
| () bb Reported times are in Barycentric Julian Date calculated directly from UTC, without correction for leap seconds. : Reference epoch of mid transit that minimizes the correlation with the orbital period. : total transit duration, time between first to last contact; : ingress/egress time, time between first and second, or third and fourth contact. | |
| (days) bb Reported times are in Barycentric Julian Date calculated directly from UTC, without correction for leap seconds. : Reference epoch of mid transit that minimizes the correlation with the orbital period. : total transit duration, time between first to last contact; : ingress/egress time, time between first and second, or third and fourth contact. | |
| (days) bb Reported times are in Barycentric Julian Date calculated directly from UTC, without correction for leap seconds. : Reference epoch of mid transit that minimizes the correlation with the orbital period. : total transit duration, time between first to last contact; : ingress/egress time, time between first and second, or third and fourth contact. | |
| cc Reciprocal of the half duration of the transit used as a jump parameter in our MCMC analysis in place of . It is related to by the expression (Bakos et al., 2010). | |
| (deg) | |
| Limb-darkening coefficients dd Values for a quadratic law, adopted from the tabulations by Claret (2004) according to the spectroscopic (SPC) parameters listed in Table 5. | |
| (linear term) | |
| (quadratic term) | |
| RV parameters | |
| () | |
| ee The 95% confidence upper-limit on the eccentricity from a model in which the eccentricity is allowed to vary in the fit. | |
| RV jitter () ff Error term, either astrophysical or instrumental in origin, added in quadrature to the formal radial velocity errors. This term is varied in the fit assuming a prior inversely proportional to the jitter. | |
| Planetary parameters | |
| () | |
| () | |
| gg Correlation coefficient between the planetary mass and radius determined from the parameter posterior distribution via where is the expectation value operator, and is the standard deviation of parameter . | |
| () | |
| (cgs) | |
| (AU) | |
| (K) hh Planet equilibrium temperature averaged over the orbit, calculated assuming a Bond albedo of zero, and that flux is reradiated from the full planet surface. | |
| ii The Safronov number is given by (see Hansen & Barman, 2007). | |
| () ii The Safronov number is given by (see Hansen & Barman, 2007). | |
4. Discussion
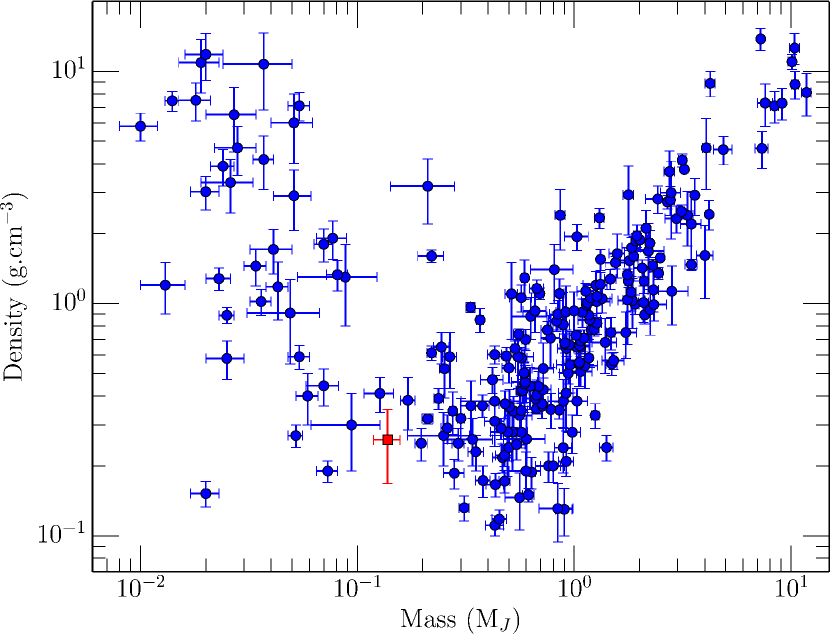
4.1. Density
HATS-8b is a very low density exoplanet, with a mean density of just . Figure 5 shows HATS-8b in context with all known exoplanets with precisely measured densities. We see from Figure 5 that HATS-8b sits in a transition region: between the low-mass, non-degenerate planets where bulk density decreases with total mass and the high mass, partially degenerate gas giants where bulk density increases with total mass. Discovering transiting super-Neptunes in this transition region is important, as it allows us to investigate the properties of planets that have not undergone “run-away” gas-accretion (Mordasini et al., 2009), in contrast to the well-studied population of hot-Jupiters.
HATS-8b is closest in mass and density to the exoplanet HAT-P-18b (Hartman et al., 2011a), which has a similar density (0.25 ) but is slightly more massive at M=0.197. Using the Fortney et al. (2007) models for gas giant planets, and assuming an age of the system to be approximately 4.5 Gyrs as indicated from the YY isochrones (see Figure 4), HATS-8b would have a core-mass of just 10. As with HAT-P-18, the metallicity of HATS-8 is not low (=), and therefore the low-mass core that we infer is unlikely to be related to a lack of metals in the proto-planetary disk from which HATS-8b formed. This argues against the metallicity-radius relationship for low-mass gas giants as discussed in Faedi et al. (2011). Purely in terms of mass, HATS-8b is similar to the exoplanet Kepler-101b, which is slightly more massive at 0.16 (Bonomo et al., 2014). However Kepler-101b has a radius of just 0.515 and a resulting bulk density of 1.45, which is 5.6 times higher than HATS-8b. This huge diversity in densities exhibited by super-Neptunes points to very different formation scenarios for these systems. In order to understand these differences, however, it is incumbent on both precise ground-based surveys and future space-based transit surveys to expand the population of known super-Neptunes.
We note that HATS-8b has a mass and period that puts it right on the edge of the ‘sub–Jupiter desert’ proposed by Szabó & Kiss (2011). This desert may be due to evaporation (Kurokawa & Nakamoto, 2014), in which case HATS-8b is at the orbital limit for super-Neptunes, and if it were any closer to its host star then evaporation may have reduced it to a super-Earth class exoplanet. The fact that HATS-8 is currently a quiet star (see Section 2.4) may also point to a history of comparatively low X-ray flux, lowering the mean evaporation rate of HATS-8b and permitting it to exist on the edge of the “sub-Jupiter desert”.
4.2. Ground-based Sensitivity
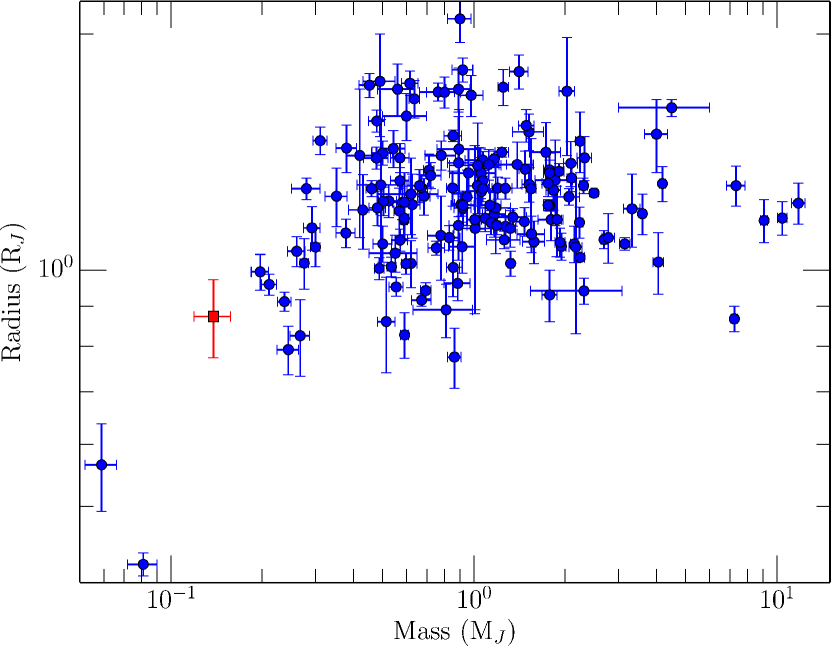
While the period of HATS-8b is typical for an exoplanet detected by a wide-field, ground-based transit survey (P= d), the derived mass (M= ) and to a lesser extent the radius (R= ), are much lower than typical, as is displayed in Figure 6. In fact HATS-8b is the third lowest mass planet to be detected by a wide-field, ground-based transit survey: only HAT-P-26b (Hartman et al., 2011b) and HAT-P-11b (Bakos et al., 2010) are less massive. The discovery demonstrates that the HATSouth global network is capable of discovering gas planets in this low-mass regime. The importance of Keck/HIRES in this discovery should also be emphasized; given the magnitude of HATS-8 and the mass of HATS-8b, Keck/HIRES is one of the only facilities in the world capable of confirming this discovery. The ability to use a synthetic template (see Section 2.4) for cross-correlation is also a significant development for faint targets such as HATS-8, for not only can it result in more precise radial velocity measurements, but it can also potentially dispense with the time-consuming step of creating an iodine-free template of the star.
It is interesting to consider whether HATS-8b and other transiting exoplanets detected from ground-based transit surveys should be included as targets on upcoming space missions such as TESS (Ricker et al., 2014) and PLATO (Rauer et al., 2014). Nominally HATS-8 would fall outside the magnitude range of the TESS mission ( for F,G,K stars), and so it would only be able to be monitored at a 30-minute cadence via the TESS full-framed images. However there are reasonable arguments to make that it would be wise to select the 4 pixels which HATS-8 would occupy in order to obtain 2-minute cadence photometry. First, a set of well-sampled transits observed in 2019 would provide a long baseline with which to measure if the orbit had evolved in terms of transit timing variations. Secondly, the results from the Kepler and HARPS surveys for exoplanets show that many planetary systems are very well aligned (Figueira et al., 2012), making it much more probable that additional planets could be discovered if we monitor a known transiting system. Although most hot Jupiters do not appear to have close planetary companions (Steffen et al., 2012), it is possible that super-Neptunes such as HATS-8b would not follow this trend. Finally, precise photometry may help us understand this system in more detail, such as providing a stellar rotation rate or probing star spots if the planet happens to occult an active region of the star during transits (e.g. Mohler-Fischer et al., 2013).
4.3. Neighbors
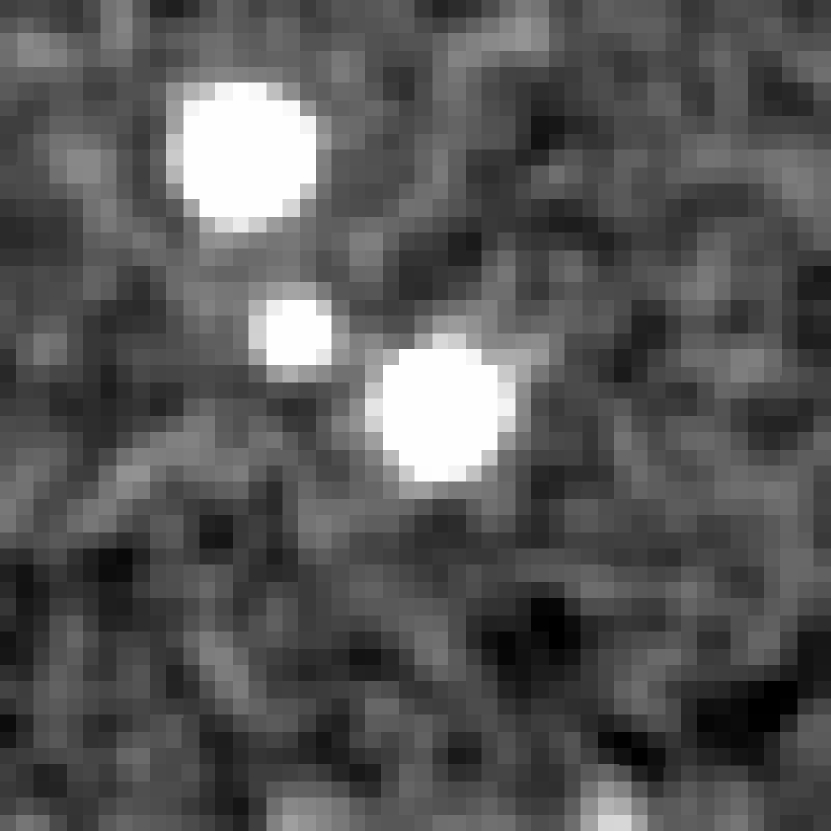
HATS-8 is in a relatively crowded field (see Table 5), that lies approximately off the Galactic plane. While there is no evidence of a blended neighbor very close (″) to HATS-8, there are two neighboring stars at 10″ and 19.4″, which are displayed in Figure 7. At the estimated distance to HATS-8 ( pc), these neighboring stars are not physically associated with HATS-8. They also do not significantly affect the HATSouth photometry, as the HATSouth pixel scale (3.7″ per pixel) means the neighbors are spatially resolved in the HATSouth images and in our follow-up photometry. However the neighbor at 19.4″ (2MASS19394689-2544386) is almost exactly the same magnitude (just 0.4 mag brighter) and with a similar color: compared with for HATS-8. This makes 2MASS19394689-2544386 an ideal reference star for long-slit, high resolution transit spectroscopy of HATS-8. Such observations have been carried out from ground-based facilities in other systems where there is a nearby reference star available (e.g. XO-2b, Sing et al., 2012). We also expect HATS-8b to have an atmospheric scale height of 927 km if we assume a Neptune like mean molecular weight (=2.53 g.mol-1). Such a large scale height would increase the strength of the absorption signal for transmission spectroscopy. The primary limitation will, of course, be the fact that HATS-8 is relatively faint at V=14.03, so building up high signal-to-noise data will be difficult.
Acknowledgements
Development of the HATSouth project was funded by NSF MRI grant NSF/AST-0723074, operations have been supported by NASA grants NNX09AB29G / NNX12AH91H and internal Princeton funds. Follow-up observations receive partial support from grant NSF/AST-1108686. A.J. acknowledges support from FONDECYT project 1130857, BASAL CATA PFB-06, and project IC120009 “Millennium Institute of Astrophysics (MAS)” of the Millenium Science Initiative, Chilean Ministry of Economy. R.B. and N.E. are supported by CONICYT-PCHA/Doctorado Nacional. R.B. and N.E. acknowledge additional support from project IC120009 “Millenium Institute of Astrophysics (MAS)” of the Millennium Science Initiative, Chilean Ministry of Economy. V.S. acknowledges support form BASAL CATA PFB-06. K.P. acknowledges support from NASA grant NNX13AQ62G. B.J.F acknowledges support from NSF Graduate Research Fellowship Grant No. 2014184874. Any opinion, findings, and conclusions or recommendations expressed in this material are those of the authors and do not necessarily reflect the views of the National Science Foundation. Operations at the MPG 2.2 m Telescope are jointly performed by the Max Planck Gesellschaft and the European Southern Observatory. This work is based on observations made with ESO Telescopes at the La Silla Observatory. Observations from the duPont and Swope telescopes were taken as part of programs CN2012A-61, CN2013A-171 and CN2014A-104 awarded by the Chilean Telescope Allocation Committee (CNTAC). This paper also uses observations obtained with facilities of the Las Cumbres Observatory Global Telescope. The radial velocity data presented herein were obtained at the W.M. Keck Observatory, which is operated as a scientific partnership among the California Institute of Technology, the University of California and the National Aeronautics and Space Administration. The Observatory was made possible by the generous financial support of the W.M. Keck Foundation. The authors wish to recognize and acknowledge the very significant cultural role and reverence that the summit of Mauna Kea has always had within the indigenous Hawaiian community. Work at the Australian National University is supported by ARC Laureate Fellowship Grant FL0992131. This research has made use of the NASA Exoplanet Archive, which is operated by the California Institute of Technology, under contract with the National Aeronautics and Space Administration under the Exoplanet Exploration Program.
References
- Akeson et al. (2013) Akeson, R. L., Chen, X., Ciardi, D., et al. 2013, PASP, 125, 989
- Bakos et al. (2010) Bakos, G. Á., Torres, G., Pál, A., et al. 2010, ApJ, 710, 1724
- Bakos et al. (2013) Bakos, G. Á., Csubry, Z., Penev, K., et al. 2013, PASP, 125, 154
- Bonomo et al. (2014) Bonomo, A. S., Sozzetti, A., Lovis, C., et al. 2014, A&A, 572, A2
- Brown et al. (2013) Brown, T. M., Baliber, N., Bianco, F. B., et al. 2013, PASP, 125, 1031
- Buchhave et al. (2012) Buchhave, L. A., Latham, D. W., Johansen, A., et al. 2012, Nature, 486, 375
- Cardelli et al. (1989) Cardelli, J. A., Clayton, G. C., & Mathis, J. S. 1989, ApJ, 345, 245
- Claret (2004) Claret, A. 2004, A&A, 428, 1001
- Coelho (2014) Coelho, P. R. T. 2014, MNRAS, 440, 1027
- Faedi et al. (2011) Faedi, F., Barros, S. C. C., Anderson, D. R., et al. 2011, A&A, 531, A40
- Figueira et al. (2012) Figueira, P., Marmier, M., Boué, G., et al. 2012, A&A, 541, A139
- Fortney et al. (2007) Fortney, J. J., Marley, M. S., & Barnes, J. W. 2007, ApJ, 659, 1661
- Fressin et al. (2013) Fressin, F., Torres, G., Charbonneau, D., et al. 2013, ApJ, 766, 81
- Fulton (2015) Fulton, B. J. 2015, in prep
- Hansen & Barman (2007) Hansen, B. M. S., & Barman, T. 2007, ApJ, 671, 861
- Hartman et al. (2011a) Hartman, J. D., Bakos, G. Á., Sato, B., et al. 2011a, ApJ, 726, 52
- Hartman et al. (2011b) Hartman, J. D., Bakos, G. Á., Kipping, D. M., et al. 2011b, ApJ, 728, 138
- Hartman et al. (2011c) Hartman, J. D., Bakos, G. Á., Torres, G., et al. 2011c, ApJ, 742, 59
- Hartman et al. (2012) Hartman, J. D., Bakos, G. Á., Béky, B., et al. 2012, AJ, 144, 139
- Kaufer & Pasquini (1998) Kaufer, A., & Pasquini, L. 1998, in Society of Photo-Optical Instrumentation Engineers (SPIE) Conference Series, Vol. 3355, Optical Astronomical Instrumentation, ed. S. D’Odorico, 844–854
- Kovács et al. (2005) Kovács, G., Bakos, G., & Noyes, R. W. 2005, MNRAS, 356, 557
- Kovács et al. (2002) Kovács, G., Zucker, S., & Mazeh, T. 2002, A&A, 391, 369
- Kurokawa & Nakamoto (2014) Kurokawa, H., & Nakamoto, T. 2014, ApJ, 783, 54
- Marcy & Butler (1992) Marcy, G. W., & Butler, R. P. 1992, PASP, 104, 270
- Mohler-Fischer et al. (2013) Mohler-Fischer, M., Mancini, L., Hartman, J. D., et al. 2013, A&A, 558, A55
- Mordasini et al. (2009) Mordasini, C., Alibert, Y., & Benz, W. 2009, A&A, 501, 1139
- Penev et al. (2013) Penev, K., Bakos, G. Á., Bayliss, D., et al. 2013, AJ, 145, 5
- Rauer et al. (2014) Rauer, H., Catala, C., Aerts, C., et al. 2014, Experimental Astronomy, 38, 249
- Ricker et al. (2014) Ricker, G. R., Winn, J. N., Vanderspek, R., et al. 2014, in Society of Photo-Optical Instrumentation Engineers (SPIE) Conference Series, Vol. 9143, Society of Photo-Optical Instrumentation Engineers (SPIE) Conference Series, 20
- Rivera et al. (2005) Rivera, E. J., Lissauer, J. J., Butler, R. P., et al. 2005, ApJ, 634, 625
- Sing et al. (2012) Sing, D. K., Huitson, C. M., Lopez-Morales, M., et al. 2012, MNRAS, 426, 1663
- Sozzetti et al. (2007) Sozzetti, A., Torres, G., Charbonneau, D., et al. 2007, ApJ, 664, 1190
- Steffen et al. (2012) Steffen, J. H., Ragozzine, D., Fabrycky, D. C. et al. 2012, PNAS, 109, 7982
- Szabó & Kiss (2011) Szabó, G. M., & Kiss, L. L. 2011, ApJ, 727, L44
- Torres et al. (2007) Torres, G., Bakos, G. Á., Kovács, G., et al. 2007, ApJ, 666, L121
- Vogt et al. (1994) Vogt, S. S., Allen, S. L., Bigelow, B. C., et al. 1994, in Society of Photo-Optical Instrumentation Engineers (SPIE) Conference Series, Vol. 2198, Instrumentation in Astronomy VIII, ed. D. L. Crawford & E. R. Craine, 362
- Yi et al. (2001) Yi, S., Demarque, P., Kim, Y.-C., et al. 2001, ApJS, 136, 417