Investigating the nature of IGR J174542919 using X–ray and Near-Infrared observations
Abstract
IGR J174542919 is a hard X-ray transient discovered by INTEGRAL on 2014 September 27. We report on our 20 ks Chandra observation of the source, performed about five weeks after the discovery, as well as on INTEGRAL and Swift monitoring long-term observations. X–ray broad-band spectra of the source are compatible with an absorbed power-law, 1.6-1.8, (10–12), with no trace of a cut-off in the data up to about 100 keV, and with an average absorbed 0.5–100 keV flux of about (7.1–9.7). With Chandra, we determine the most accurate X-ray position of IGR J174542919, =17h 45m 27s.69, = 29∘ 19′ 53′′.8 (90% uncertainty of 0′′.6), consistent with the NIR source 2MASS J17452768–2919534. We also include NIR investigations from our observations of the source field on 2014 October 6 with GROND. With the multi-wavelength information at hand, we discuss the possible nature of IGR J174542919.
Subject headings:
accretion, accretion disks – X-rays: binaries – binaries: close – stars: individual (IGR J174542919)1. Introduction
The bulge of our Galaxy contains a variety of high–energy transient and persistent sources. It is a unique environment where we can study a wide range of X–ray intensities, down to the fainter levels. Quantifying the spatial distribution, activity and properties of these sources is essential for population studies and hence for understanding the evolution of our own Galaxy. Large field-of-view instruments with high sensitivity in the hard X–ray energy band, less contaminated by the numerous soft X–ray emitting stars, are essential ingredients for such a study. In this respect, the INTEGRAL observatory (winkler03; winkler11), with its regular monitoring and deep observations of the Galactic center, has offered a fundamental contribution (e.g. kuulkers07; revnivtsev08; bird10; krivonos12; lutovinov13).
On 2014 September 27, INTEGRAL discovered the new hard X-ray transient source IGR J174542919 (chenevez14). The source, less than 24′ from the Galactic Center, was detected by both JEM–X detectors (lund03) in mosaic images obtained from observations during INTEGRAL revolution 1460 (2014 September 27-30). The reported JEM–X average fluxes were 6.51 mCrab (3–10 keV) and 8.21.7 mCrab (10–25 keV). The source was not detected in previous observations of the region, with a 5 3–25 keV upper limit of about 1 mCrab. chenevez14 also report on a Swift 2 ks follow-up observation on 2014 October 2. IGR J174542919 was clearly visible, =17h 45m 28s, = 29∘ 19′ 55′′ (90% error confidence of 5′′), only 10′′ from the JEM–X position.
Later on, chenevez14b reported that the source flux, observed by INTEGRAL/JEM–X on 2014 October 18-20, had increased by about a factor of two with respect to the previous observations, reaching a flux of 101 mCrab in 3–10 keV and 152 mCrab in 10–25 keV.
On 2014 October 10, NuSTAR (harrison13) observed IGR J174542919 for a total of about 29 ks (tendulkar14). The energy spectrum could be well described by an absorbed power-law (, ) with an exponential cut-off (100 keV) and a broad, asymmetric, iron emission line. The unabsorbed 3–79 keV flux was 3.96, corresponding to an isotropic luminosity of 3 at 8 kpc. Similarly to JEM–X (chenevez14), the 3–79 keV light curve did not show any evidence for bursts or pulsations. tendulkar14 noted a 14% drop in the count rate over the course of their observation, with 253% rms variability in the form of a power density spectrum (PDS) described by a zero frequency centered Lorentzian with 2 Hz width and peaking at 1 Hz. Additional power in the PDS was seen at low frequencies in the form of a power-law. According to the authors, the hard power-law index, high energy cut-off, and level of variability are consistent with IGR J174542919 being an accreting black hole (BH) in the hard state, though the possibility of a low magnetic field neutron star (NS) cannot be ruled out.
On 2014 November 3, we observed IGR J174542919 with Chandra/HETGS for 20 ks. Our Chandra based position was reported in paizis15 as =17h 45m 27s.69,
= 29∘ 19′ 53′′.8
(90% uncertainty of 0′′.6). This position (2.4′′ away from the Swift/XRT one) is consistent with the near-infrared (NIR) source 2MASS J17452768–2919534.
On 2015 February 16–17, INTEGRAL observed again the Galactic center and boissay15 reported the non detection of IGR J174542919, with an estimated
5 upper limit on the source flux of 4 mCrab in the 3–10 keV energy band and of 2 mCrab in the 10–20 keV energy band.
At the time of writing, the nature of IGR J174542919 is still to be unveiled. In this paper we present the results of our Chandra observation as well as long term INTEGRAL and Swift observations, to place our Chandra observation in the source emission context, as well as to obtain a broad-band source coverage. We report also on archival and new NIR observations of the source taken during the outburst.
2. Observations and data analysis
2.1. Chandra data
We observed IGR J174542919 for 20 ks with Chandra on 2014 November 3, between UT 00:05 and 06:17 (MJD 56964.0-56964.26, Observation ID 15744) with the High Energy Transmission Grating Spectrometer, HETGS (canizares00).
Throughout this work we shall consider data from the spectral order for source position extraction, and from the orders for spectral extraction. Higher spectral orders have very low count rates and thus shall be ignored, while the order spectrum will not be considered in the spectral analysis as it severely suffers from pileup. The data were analyzed in a standard manner, using the CIAO version 4.6 software package and Chandra CALDB version 4.6.3.
To increase the signal-to-noise ratio, we have merged the orders in a single first order Medium Energy Grating (MEG) spectrum and a single first order High Energy Grating (HEG) spectrum. Starting from 0.5 keV and 0.7 keV in MEG and HEG, respectively, the data were grouped to have 7 bins (for the investigation of discrete features) and 14 (for the joint Chandra/Swift spectra). Spectra were fitted using XSPEC version 12.7.0. Only the results from the latter grouping (consistent with the former) are shown in the paper.
Our Chandra observation revealed another bright source located slightly further than 18′ from our target source. Basic results on the source are also given, in Section 3.1.2.
2.2. Swift data
The Swift satellite pointed IGR J174542919 five times between 2014 October 11 and 2014 November 2, the latter being one day prior to our Chandra observation. The log of the observations is reported in Table 1.
| ObsId | Date Start | Exposure | XRT mode |
|---|---|---|---|
| (#) | (UTC) | (s) | |
| 00033470002 | 2014-10-11 00:10:17 | 4640 | WT |
| 00033470003 | 2014-10-13 06:56:17 | 1594 | WT |
| 00033470004 | 2014-10-13 04:48:45 | 4365 | PC⋆ |
| 00033470006 | 2014-10-23 08:06:21 | 1673 | WT |
| 00033470007 | 2014-11-02 07:52:01 | 1015 | PC |
-
⋆
Spectrum strongly piled-up and not used.
The Swift/XRT spectra were obtained thanks to the on-line tool provided by the Swift UK center111http://www.swift.ac.uk/user_objects/. The complete procedure for products extraction is described in evans09. Note that, as recommended for absorbed sources, we extracted spectra from grade 0 only for the window timing data. We also cross-checked the results by reducing a couple of the observations from the raw data following standard procedures using the HEASOFT software suite (through XSELECT, e.g. Rodriguez10; Rodriguez11). As the products showed no significant deviations, we used those obtained from the on-line tool for the spectral fits obtained here. The data were grouped so as to have a minimum of 25 counts/bin and then fitted in XSPEC between 0.6 keV and 8/10 keV, depending on the quality of the data.
The Swift/BAT survey data, retrieved from the HEASARC public archive222http://swift.gsfc.nasa.gov/archive/, cover the period from MJD 56778.2 to 57032.9 (2014 May 1 – 2015 January 10). Due to Solar constraints, no observatory could look at the source after 2014 November and IGR J174542919 was not detected in the available Swift/BAT data after the solar constraint, up to 2015 January 10.
The Swift/BAT data were processed using BAT_IMAGER software (segreto2010). This ad-hoc code, dedicated to the processing of coded mask instrument data, computes all-sky maps and, for each detected source, produces standard products such as light curves and spectra. We note that the code takes into account the cross-contamination between sources in the field of view. This is essential in crowded fields such as the one of IGR J174542919 that has two nearby sources, 1A 1742–294, 13′ away, and AX J1745.62901, 18′ away (see also cusumano15, for another application of the decontamination process). The Swift/BAT spectra were analyzed in XSPEC between 15 keV and 150 keV.
2.3. INTEGRAL data
IGR J174542919 has been in the INTEGRAL field of view during the observations of the Galactic Centre (ID 1120027) and of the Galactic Bulge region333http://integral.esac.esa.int/BULGE/ (ID 1120001). The third set of observations covering the source, ID 1020021, consists of proprietary data and is not included in this work. A complete study of these INTEGRAL data is out of the scope of this paper, however to have a feeling of the broad-band long-term behavior of the source, we have analyzed the IBIS/ISGRI and JEM–X444Results are given for JEM–X1 and JEM–X2 combined. data (lebrun03; lund03, respectively) starting from revolution 1446 (2014 August 18, 01:17:28 UT, MJD 56887.05, about forty days prior to the reported discovery) up to revolution 1470 (2014 October 28, 15:42:00 UT, MJD 56958.65), the latest dates compatible with solar constraints. The first INTEGRAL observation of the Galactic center occurred again on 2015 February 16–17, during which IGR J174542919 was not detected (boissay15).
A standard analysis using version 10.1 of the Off-line Scientific Analysis (OSA) software was performed on the pointings where the source was simultaneously in the field of view of IBIS/ISGRI and JEM–X.
2.4. Near-infrared data
With our Chandra position of IGR J174542919 at hand, we searched for candidate counterparts in several NIR surveys as well as obtained new optical/NIR observations of the source field during the outburst.
The position of IGR J174542919 had been observed on 2010 August 15 by the VISTA Variables in the Vía Láctea Survey (VVV, minniti10), on 2006 July 18 during the UKIRT Infrared Deep Sky Survey (UKIDSS555The UKIDSS project is defined in lawrence12. UKIDSS uses the UKIRT Wide Field Camera (WFCAM; casali07). The photometric system is described in hewett06, and the calibration is described in hodgkin09. The pipeline processing and science archive are described in hambly08. We have used data from the 10th data release, which is described in detail in lawrence12., lawrence07), and also on 1998 July 2 as part of the Two Micron All-Sky Survey (2MASS, skrutskie06).
Furthermore, we observed IGR J174542919 during the outburst with the 7-channel imager Gamma-Ray burst Optical Near-infrared Detector (GROND, greiner08) at the MPG 2.2 m telescope at ESO La Silla Observatory at UT 00:31 on 2014 October 6 (MJD 56936.0). GROND observes in the four optical and three near-IR bands simultaneously. Because of the severe Galactic foreground reddening (A44, A12), we consider here only the , , and bands. The total integration times in each band was min and the average seeing was . The GROND data were reduced and analyzed with the standard tools and methods described in kruhler08. Here, the and photometry was measured from 1.3′′ apertures and calibrated relative to point-like field sources from the UKIDSS DR10 (lawrence12).
3. Results
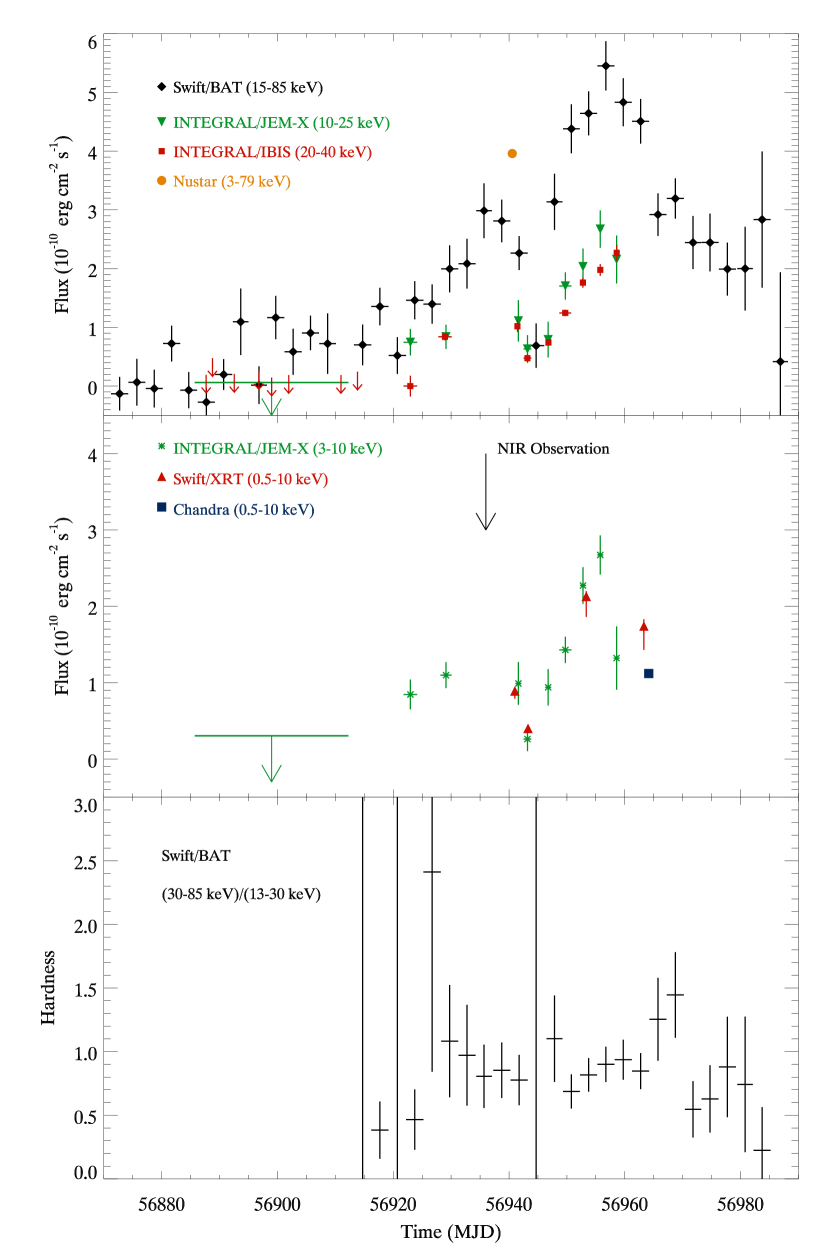
A summary of all the data discussed in this work is shown in Figure 1 where the overall 2014 outburst of IGR J174542919 can be seen.
The upper panel depicts the hard X–ray behavior of IGR J174542919 with results from INTEGRAL/JEM–X (10–25 keV flux, green down triangles), INTEGRAL/IBIS (20–40 keV flux, red boxes) and Swift/BAT (15–85 keV flux, black filled diamonds, 3 day bins). The NuStar unabsorbed 3–79 keV flux (yellow circle, tendulkar14) is also shown here.
The middle panel shows the soft X–ray behavior with results from INTEGRAL/JEM–X (absorbed 3–10 keV flux, green asterisks), Swift/XRT (absorbed 0.5–10 keV flux, red triangles), Chandra/HETGS (absorbed 0.5–10 keV flux, blue box). The time of our NIR GROND observation is marked by the black vertical arrow. As it can be seen, it occurred during the first peak of the outburst of IGR J174542919, as traced by Swift/BAT (upper panel).
The lower panel is the hardness ratio evolution computed with Swift/BAT in 30–85 keV versus 15-30 keV.
3.1. Chandra results
3.1.1 Chandra position, variability and spectra of IGR J174542919
Given the brightness of the source, the order image is piled-up, hence the resulting shape of the point spread function is distorted and no longer exactly point-like. This renders more difficult to locate the precise centroid position of the source. For this reason, the source location was determined by intersecting the readout streak with the grating arms. This was accomplished with the findzo algorithm, which is used for determining the order position when a readout streak is detected (and hence pileup is affecting the order image), as in our case.
The X-ray position obtained is =17h 45m 27s.69, = 29∘ 19′ 53′′.8, as reported in paizis15. Since the statistical error is smaller than the absolute position accuracy of Chandra, 0′′.6 at 90% uncertainty666http://cxc.harvard.edu/cal/ASPECT/celmon/, we attribute to the position found a 90% uncertainty of 0′′.6.
The Chandra light-curve of IGR J174542919, similarly to what was reported by chenevez14 and tendulkar14, showed no evidence for bursts or pulsations on the time scales accessible to our Chandra observation, i.e. 4–10000 s (twice a Chandra time bin to half the observation).
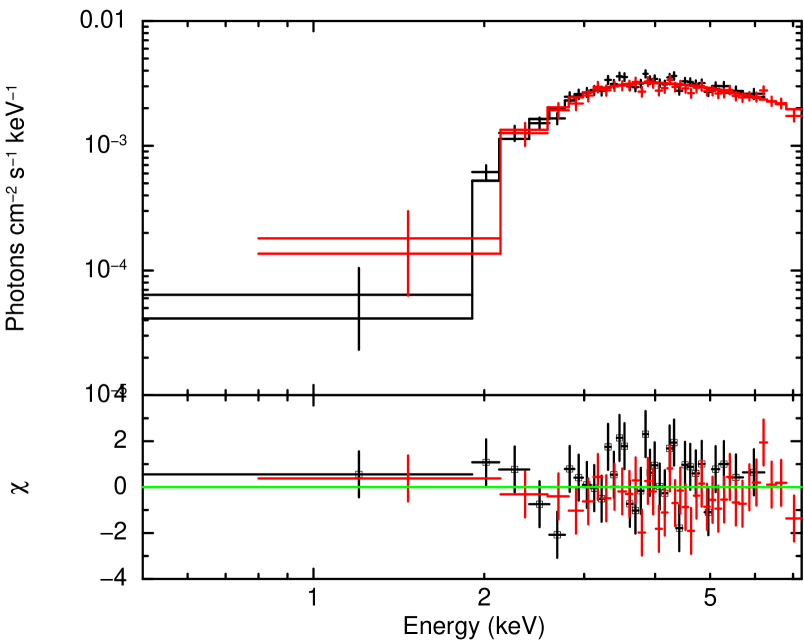
The Chandra spectrum of IGR J174542919 can be well fit by an absorbed (tbabs) power-law (12, and photon index 1.6) with an average absorbed 2–8 keV flux of about 1. Figure 2 shows the best fit we obtained with the absorbed power-law model, while Table 3.1.1 shows the obtained parameters.
In the fit, and throughout the paper, we have used an improved model for the absorption of X-rays in the ISM by wilms00777In XSPEC terminology: tbabs with xsect vern and abund wilm.. Such a model results in higher column densities with respect to, e.g., the wabs model by morrison83. For comparison, using the wabs model, the following is obtained: =(8.20.7), and photon index =1.60.17.
| Spectra | (a)(a)In the fit we have used an improved model for the absorption of X-rays in the interstellar medium by wilms00. | Average U_Flux | Average Flux | Average Luminosity | Red Dof | |
|---|---|---|---|---|---|---|
| () | () | () | (1036 ) | |||
| Chandra/HETGS | 1.60.2 | 2.0(b)(b)Unabsorbed 2–8 keV flux. | 1.1(c)(c)Absorbed 2–8 keV flux. | 0.9(d)(d)Absorbed 2–8 keV luminosity, assuming a distance of 8 kpc. | 1.05/66 | |
| Swift/(XRTBAT) | 1.80.1 | 9.7(e)(e)Unabsorbed 0.5–100 keV flux. | 7.1(f)(f)Absorbed 0.5–100 keV flux. | 5.4(g)(g)Absorbed 0.5–100 keV luminosity, assuming a distance of 8 kpc. | 0.87/66 | |
| Chandra/HETGSSwift/BAT | 1.60.2 | 11.7(e)(e)Unabsorbed 0.5–100 keV flux. | 9.7(f)(f)Absorbed 0.5–100 keV flux. | 7.4(g)(g)Absorbed 0.5–100 keV luminosity, assuming a distance of 8 kpc. | 1.03/69 | |
Note. — Error bars are 90% confidence level for one
parameter. Chandra spectra are shown in Figure 2 and discussed in Section 3.1.1.
Swift/(XRTBAT) spectra are shown in Figure 3, upper panel, and discussed in Section 3.3.1 while
Chandra Swift/BAT spectra are shown in Figure 3, lower panel, and discussed in Section 3.3.2.
3.1.2 The second source in the Chandra field of view: AX J1745.62901Our Chandra observation revealed another bright source located 18′ from our target source888We note that this source does not contaminate the results we obtain for IGR J174542919 in hard X–rays, neither with INTEGRAL/IBIS-JEM–X nor with Swift/BAT. Indeed, for INTEGRAL, the source is further than the instrncic instrumental angular resolution (12′ for IBIS and 3′ for JEM–X), while for BAT source cross-contamination is taken care of by the code used (see Section 2.2).. At this off-axis angle, the Chandra point spread function (PSF) becomes very extended and obtains an elliptical shape. The image of this source appears as an ellipse with semi-major/semi-minor axes of approximately 1.1′/0.7′, respectively, with shadows of the mirror support structures clearly visible in the PSF. The intersections of these shadow structures occur within 2′′ of =17h 45m 35s.44, = 29∘ 01′ 33′′.6 (J2000), which is the location of a known transient, the bursting NS AX J1745.62901 (see degenaar2009; muno2004, and references therein). We extracted the order spectrum for this source using the CIAO specextract tool (taking the background from a nearby 0.7′ circular region). Binning the spectrum to a signal-to-noise per channel of 8 and noticing the 2–8 keV region, the spectrum is well fit (=224.6 for 222 degrees of freedom) by an absorbed, power-law (). Error bars are 90% confidence for one interesting parameter. This value is 50% higher than the value reported by degenaar2009; however, they do not specify the absorption model used. The fitted, unabsorbed 2–10 keV luminosity is , assuming isotropic emission at a distance of 8 kpc. This would place this outburst of AX J1745.62901 at the same level as the brightest of the four historical outbursts discussed by degenaar2009, with the other outbursts being approximately 6–30 times fainter. We searched the source light-curve for evidence of variability (there is an 8.4 hr period known from eclipses), including any evidence of type-I bursts, but no statistically significant variability was found on any time scale accessible to this Chandra observation (4–10000 s). 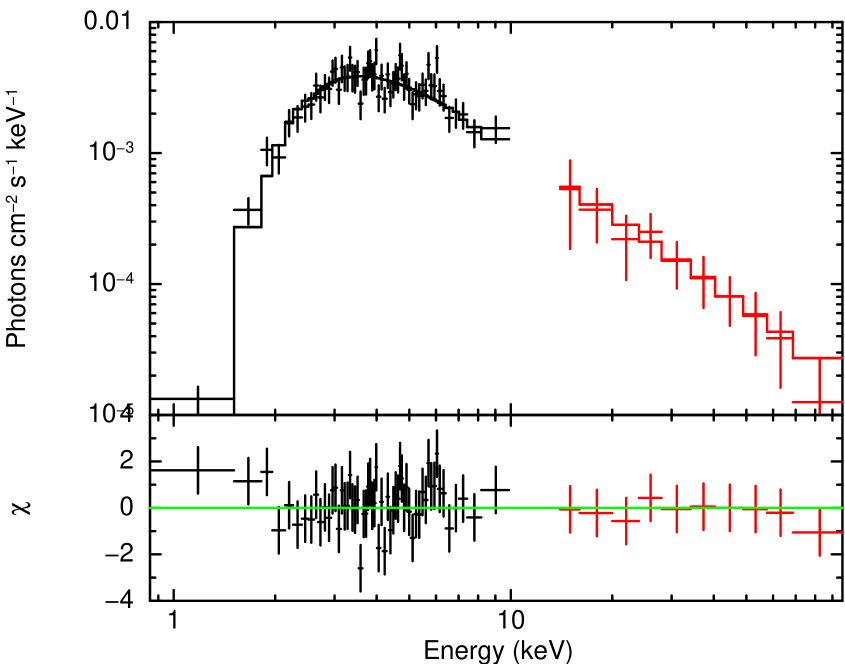 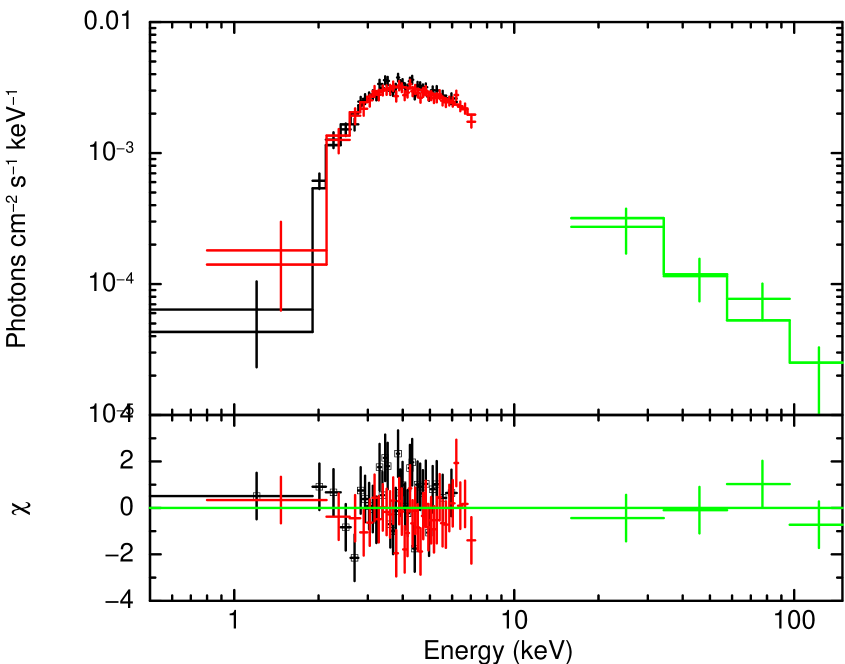 3.2. Swift results on IGR J1745429193.2.1 Swift/XRT resultsExcluding the severely piled up observation 00033470004 (see Table 1), we have extracted Swift/XRT spectra for the remaining four observations. All spectra could be well fit by an absorbed power-law. The obtained fluxes are shown in Figure 1, middle panel. During three of these four observations (first, third and fourth, chronologically), the source did not show any relevant spectral evolution although the source flux doubled, with spectral slope remaining around =1.50.3 and absorption within the interval (7.5-10.7). The second observation, 00033470003 occurred on 2014 October 13 (MJD=56943.28), resulted in a very poorly constrained fit (= and =) since the source experiences a flux drop, as also detected by INTEGRAL and Swift/BAT (Figure 1). |
||||||
3.2.2 Swift/BAT resultsDue to its extremely wide field of view, Swift/BAT has nicely monitored IGR J174542919. The all-outburst Swift/BAT light-curve (3 day bins) can be seen in Figure 1, upper panel, while the hardness ratio in the bands 30-85 keV versus 15–30 keV is shown in Figure 1, lower panel. A complete study of all the Swift/BAT data is beyond the scope of the paper, but we have extracted Swift/BAT spectra for three time intervals: the first one corresponding to Swift/XRT ObsID 00033470007 (see Table 1, MJD 56963.3, November 2, Swift/BAT exposure of about 87 ks) about a day prior to our Chandra data, the second simultaneous to our Chandra observation (MJD 56964.0, November 3, 17 ks), and the third covering the outburst peak of IGR J174542919, from October 20 to November 4 (MJD 56950–56965, roughly the highest five bins in Figure 1, 172 ks). The three Swift/BAT spectra could be well fit by a simple power-law with =1.90.5 (November 2), =1.30.8 (November 3) and =1.90.1 (peak). Though the second result (=1.30.8) appears to suggest a hardening of IGR J174542919, the result is not statistically significant and the slopes overlap. In the next Section we use the Swift/BAT spectra to investigate the broad-band behavior of IGR J174542919. 3.3. Broad-band results of IGR J1745429193.3.1 Swift/(XRTBAT) observation (November 2)The simultaneous Swift/(XRTBAT) spectrum of IGR J174542919 as obtained from November 2 (see Table 1) can be well fit by an absorbed power-law (10.5 and photon index 1.8) with an average absorbed 0.5–100 keV flux of about 7.1. Figure 3, upper panel, shows the best fit we obtained with the absorbed power-law model, while Table 3.1.1 shows the obtained parameters. There is clearly no need for a power-law cut-off energy in the data. |
||||||
3.3.2 Chandra-Swift/BAT observation (November 3 and peak)As visible in Figure 1, our Chandra observation is simultaneous to a Swift/BAT coverage. Hence to obtain broad-band information on the source, we performed a joint Chandra-Swift/BAT spectral fitting of the simultaneous data. The data can be well fit by an absorbed power-law (11.9, and photon index 1.6) with an average absorbed 0.5–100 keV flux of about 9.7. Figure 3, lower panel, shows the best fit we obtained with the absorbed power-law model, while Table 3.1.1 shows the obtained parameters. Similarly to the previous case, there is no trace of a high energy cut-off in the data. From Figure 1 it is possible to see that our Chandra observation occurred at a similar Swift/BAT (15–85 keV) flux as the NuSTAR one. Hence to compare the results, we fitted our broad-band Chandra-Swift/BAT spectra with the same model used by tendulkar14, i.e. a cut-off power-law with absorbing model (tbabs, Tendulkar, private communication) and abundances by anders89, instead of the ones used up to now by wilms00. We obtained: , = and cut-off energy 80 keV. Compared to the results by tendulkar14 (, and 100 keV), we see that while the power-law slope and cut-off energy are comparable, the absorbing column density is about a factor of two different. As a final check, we fit the Chandra data with the peak Swift/BAT spectrum (with the peak defined in Section 3.2.2 i.e. from October 20 to November 4, roughly the highest five bins in Figure 1), in an attempt to improve the fit quality with the better Swift/BAT statistics, for there is an overlap, though the data are not exactly simultaneous. Similarly to the previous cases, there is no significant detection of a cut-off in the spectrum with energy 80 keV. 3.4. INTEGRALDuring the discovery outburst, the source was never detected in a single INTEGRAL pointing (2 ks) and several pointings needed to be stacked to increase the sensitivity with longer exposures. Therefore, we have built mosaic images with the IBIS/ISGRI and JEM–X12 instruments, to obtain average flux measurements for each INTEGRAL revolution. In Figure 1, we show, in the upper panel, the source flux variations between 20–40 keV (IBIS/ISGRI) and 10–25 keV (JEM–X), while the 3–10 keV (JEM–X) flux variations are shown in the middle panel. In the case of JEM–X, upper limits in Figure 1 are from the total combined JEM–X mosaic with the deepest exposure available prior to the onset of the outburst and are at 5, while for IBIS/ISGRI the upper limits are given per revolution and are at 3. Inspection of our all-public IBIS/ISGRI archive (October 2002 – March 2014; paizis2013, 17–50 keV) for previous unnoticed outbursts from IGR J174542919 shows that during the 35.2 Ms (good IBIS/ISGRI time) in which IGR J174542919 was in the IBIS/ISGRI field of view (source position within 15∘ from the pointing coordinates), the source has never been detected at a single pointing level (2 ks), implying that IGR J174542919 was (at best) at the detection limit in IBIS/ISGRI, corresponding to about 20 mCrab in a 2 ks pointing (krivonos2010). 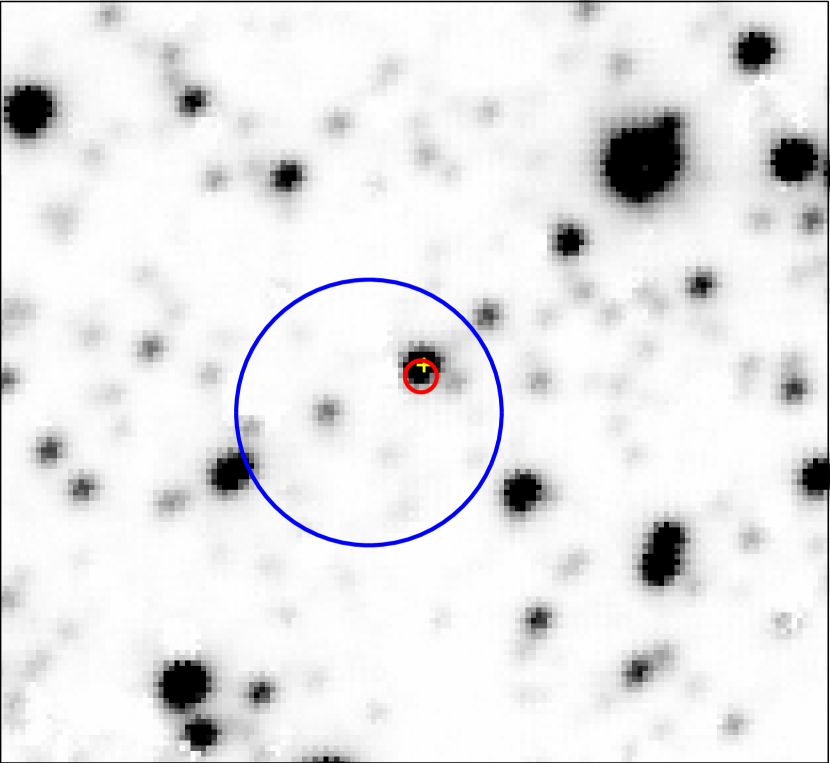
3.5. Near-infraredFigure 4 shows the archival UKIDSS -image of the field around IGR J174542919. The Swift/XRT 90% error circle (5′′ in blue, chenevez14) and Chandra 90% error circle (0.6′′ in red, this work) are shown. While the Swift/XRT position error includes more than one source in the crowded field towards the Galactic center, our Chandra position coincides within the errors with a 2MASS object, 2MASS J174527682919534 (indicated with a yellow cross in the map) which makes it the most likely NIR counterpart. Due to the large Galactic foreground reddening, no optical counterpart is detected in the GROND bands. However the likely 2MASS counterpart is detected in the infrared and bands. A comparison of the GROND, UKIDSS, 2MASS and VVV999We took here default 2′′ aperture photometry of the VVV catalogue (so-called jAperMag3, hAperMag3 and ksAperMag3), and we also added the uncertainty in the photometric zero-points of 0.01 mag, in quadrature to the catalogued statistical uncertainties. photometry (all magnitudes in the Vega System) is presented in Table LABEL:tab:GROND-UKIDSS-2MASS-VISTA. |
||||||
| b: Archival NIR catalogues. | ||||||
The candidate counterpart is constant within the error bars in the -band and also constant between GROND, UKIDSS and VVV in the -band.
The band, however, shows a hint of variability with respect to the UKIDSS and VVV survey.
Hence, we conclude that 2MASS J174527682919534 underwent a slight brightening in the -band during the X–ray outburst, while it remained constant in the and bands.
4. DiscussionAfter the discovery, IGR J174542919 has undergone an outburst of about 60 days (MJD 56923.7-56983.7, as suggested by the last non-detection in Swift/BAT, see Figure 1). Due to Solar constraints, however, no observatory could look at the source after 2014 November, so a longer outburst cannot be excluded. The X–ray light-curve of IGR J174542919 (Figure 1) shows a double peak with a clear flux decrease seen in all X–ray bands around MJD 56945 (duration 4–5 d). The obtained spectra during such a dip are too dim to verify a significant variability of the spectral model parameters (see Section 3.2 and Fig 1 lower panel), but the fact that this flux decrement is present in all the X–ray data may suggest that it does not correspond to an important spectral state change, rather to a decrease in the overall flux. Such a decrease may be due to an intrinsic change in mass transfer from the companion in an eccentric orbit (see, e.g. the few, 2–3, day dip in the X–ray light-curve of Cir X–1, shirey96; murdin80), or due to a change of the absorbing medium (dips from intervening matter or eclipses by the donor or by a tilted and/or warped accretion disk, see e.g. clarkson03, and references therein). Broad band spectra of the source are compatible with an absorbed power-law (1.6-1.8 and 10–12), with no trace of a cut-off in the data. Unlike NuSTAR (tendulkar14), we do not see evidence of a broad iron line in our soft X–ray spectra, which is not a surprise considering the significantly larger effective collecting area in the iron domain of NuSTAR with respect to Chandra and Swift/XRT. Using the same model by tendulkar14 to fit our broad-band Chandra-Swift/BAT spectra, we obtained a significantly different absorbing column density, versus their . This could imply a real variability in (hence a part of it is local to the system), but we note that the discrepancy could be due to the lack of data below 3 keV and/or to the modeling of the Fe line in the NuSTAR data. The X–ray characteristics of IGR J174542919 are typical of a Low Mass X–ray Binary (LMXB) rather than of a High Mass X–ray binary (HMXB). Indeed, most HMXBs, apart from the exceptionally few BH HMXBs such as Cyg X–1, have spectra with a very clear cut-off below 40 keV (coburn02), while IGR J174542919 has a clear non attenuated power-law up to 100 keV, as seen in the broad band spectra presented in the present work. Furthermore, the spectral slope of IGR J174542919 is typical of an LMXB in the low-hard state, different from the flatter slope generally seen in HMXBs (1). Regarding the nature of the compact object in the binary system, we note that up to now no pulsations or type-I X-ray bursts, that would point to the presence of a NS in the system, have been detected (this work, chenevez14; chenevez14b; tendulkar14). Furthermore, the spectral analysis and long term light-curve investigated in this work do not seem to strongly favor the BH option, with respect to the NS. Indeed, the ultra-compact binary and X–ray burster (hence an LMXB with NS) 4U 1850–087 has shown a similar spectrum to IGR J174542919: a non attenuated power-law up to about 100 keV, with best-fit photon index of =1.90.1 and 2–100 keV luminosity of 1.5 at 6.8 kpc (sidoli06). This source, observed with BeppoSAX and INTEGRAL, spent most of the time in this low luminosity hard state. Its simultaneous XMM-Newton/EPIC-INTEGRAL/IBIS spectrum required a soft disk emission besides the power-law (=0.80.1), but the source had a very low absorbing column density (=0.4), whereas in our case , be it local to the system or Galactic, is high and the soft disc component, if any, is most likely hidden and undetected. The peak flux reached by IGR J174542919 during the outburst as seen by Swift/BAT in 15–85 keV is (5.50.4) (Figure 1). Placing the source at 8 kpc and assuming the same spectrum as in Table 3.1.1, we obtain a corresponding 0.5–100 keV peak luminosity of 9 (3.5 at 5 kpc) that is in the range of X–ray binary outbursts (both LMXB and HMXB). In this respect, the peak flux does not allow us to constrain the nature of the source. On the other hand, broad asymmetric iron lines as the one detected by tendulkar14 are in general typical of accretion disks, hence mainly found in LMXBs (e.g. ng10), whereas in the case of HMXBs, the observed lines have normally a narrow profile (e.g. Vela X–1, GX 301–2, 4U 1700–37), usually interpreted as fluorescence of iron in a wind or circumstellar matter (rodriguez06; gimenez15). The large value of the absorption we obtain (10–12 or =8.20.7 using wabs) is well in excess with respect to the average Galactic value in the source direction, 1.2 cm-2 (dickey90). This could imply that there is an additional contribution from within the system and/or that we are seeing the system at high inclination. Nevertheless, the value obtained with the radio maps by dickey90 does not resolve the small scale, 1′, non-uniformity of and does not include the possible contribution of molecular hydrogen, probably underestimating the true value. Indeed also the second source in the Chandra field of view, AX J1745.62901 located 18′ from our target source, is heavily obscured with (average Galactic value in the source direction 1.2 cm-2 dickey90) possibly related to the patchy nature of towards the Galactic Center. Our NIR observations showed that 2MASS J174527682919534 underwent a slight brightening in the -band during the X–ray outburst, while it remained constant in the and bands. This variability detected in the bluer bands rather than in the band could be consistent with an enhanced emission from an accretion disk of an LMXB, in which the donor star (or even the jet emission) dominates the NIR flux in and , with an increasing disk contribution at bluer wavelengths (e.g. charles06; khargharia10). To estimate the extinction towards the source, we modify the relationship of predehl95 to account for the fact that the absorption model of wilms00 used throughout the paper fits neutral columns 30% larger than the model used by predehl95, hence we assume A2.7 (as in nowak12). Using the ratio A/AV=0.112 and AJ/AV=0.282 (rieke85), our broad-band observed column density 11.9 translates into an absolute magnitude =-8.1 mag with an assumed distance of 8 kpc (=-7.1 mag at 5 kpc), an absolute magnitude =-10.9 mag (=-9.9 mag at 5 kpc) and -=-2.8 mag. The obtained band value is compatible with an M-type companion in the case of a red giant, however the - value does not seem to fit with any spectral type (see Figure 1 in chaty02, where -0.5-1.5). Notwithstanding the patchy nature of towards the Galactic Center, it would take an unusually low extinction to match the obtained value to a given spectral type. We note that similar results are obtained also if we use more recent interstellar extinction laws, such as by nishiyama09 and guver09. In both cases, the -band indicates an M-type red giant companion (LMXB), whereas - does not belong to any spectral type (-=-3.2 mag and -4.45 mag, respectively). On the other extreme, we could consider that all the absorbing material is local to the accreting compact object alone, while the companion is not enshrouded in it. In this case, as in some INTEGRAL highly absorbed HMXBs (e.g., chaty13, and references therein), we estimate the extinction towards the source only using the expected line of sight absorption (1.2 cm-2 dickey90). This leads to an absolute magnitude -3.9 mag for an assumed distance of 8 kpc (=-2.9 mag at 5 kpc), compatible with a K/M-type red giant companion (LMXB) or a B-type main sequence star (HMXB). Similarly to the previous case, the - value obtained (-=3.6 mag) does not seem to match any spectral type. Most likely, IGR J174542919 lies somewhere in between, with some of the absorbing material local to the accreting compact object. Furthermore, part of the - discrepancy could mean that we are seeing the contribution from the accretion disk (suggesting an LMXB). Indeed, NIR increases up to 4–7 mag have been seen in the high-soft state of LMXBs (charles06), and of about 3 mag in the low-hard state (chaty03). Since IGR J174542919 is right in the crowded region of the Galactic center, it is possible that the associated NIR counterpart discussed up to now is not the correct one, with the real one lying behind our candidate, or within a blend with other bright stars dominating the NIR scene. As a first order estimate however, we note that in Figure 4 we have about 25 comparably bright sources to IGR J174542919 in an area about 790 times that of the Chandra error circle, resulting in a low chance coincidence probability, of about 3%. For completeness, we investigate also the active galactic nucleus (AGN) possibility. There are a few examples of AGNs located in the Galactic plane, and even towards the Galactic center (chaty08; zurita09; tomsick12). However, no extragalactic object is known to be located within a radius of 30′ from the Galactic Centre (SIMBAD), with IGR J174542919 being less than 24′ from it. Furthermore, IGR J174542919, with its 2 in 20–40 keV (see Figure 1) would place itself among the brightest AGNs detected by INTEGRAL. Comparing with beckmann09, we see that out of 199 AGNs detected with INTEGRAL above 20 keV, only four do have a flux brighter than 1 in the 20–40 keV: Mrk 421 (BLLac), NGC 4151 (Sy1.5), Cen A (Sy 2) and the Circinus Galaxy (Sy 2). The latter three are Seyfert galaxies and, similarly to IGR J174542919, are highly absorbed in X–rays, but while in their case this results in a significant infrared emission due to the thermal radiation from the dust (4 mag for Cen A and 7.5 mag for NGC 4151, skrutskie06), in our case we reach a level of 11 mag, much dimmer. On the other hand, this source seems too absorbed to be a blazar AGN (e.g. for Mrk 421, =0.08 is obtained). Finally, the AGN hypothesis is discarded also by the NIR images since if the X–rays were from an AGN similar to the above, the source would be nearby and thus we would observe a NIR extended source (several arcsecs to even arcminutes, see e.g. the dimmer IGR J09026–4812 with its 4.9′′ semi-major axis in , zurita09). This is clearly not the case in the archival and GROND NIR maps. |
||||||
5. SummaryOn 2014 September 27th, INTEGRAL discovered the new transient IGR J174542919, 24′ away from the Galactic center. The outburst lasted at least about 60 days, with a longer monitoring being hampered by solar constraints. We studied the long-term X–ray light-curve and broad-band spectra of IGR J174542919 using data from three high energy missions: Chandra, Swift and INTEGRAL. The outburst X–ray light-curve shows a double peak with a clear 4–5 d flux decrease seen in all X–ray bands. This may suggest a mass transfer change from the companion in an eccentric orbit, or a change of the absorbing medium (e.g. dips from intervening matter, eclipses by the donor or by a tilted and/or warped accretion disk). The outburst peak flux is 5.5 (15–85 keV) corresponding to 0.5–100 keV peak luminosity of 9 at 8 kpc, in the range of X–ray binary outbursts. The broad band spectra of the source are compatible with an absorbed power-law (1.6-1.8 and 10–12), with no trace of a cut-off in the data up to about 100 keV. This is compatible with an LMXB in the low-hard state. The detection of a broad iron line by NuSTAR (tendulkar14) strengthens this association. Up to the time of writing, there is no indication on the nature of the compact object (i.e. pulsations or type-I X-ray bursts that would point to a NS). With Chandra, we determined the most accurate X-ray position of IGR J174542919, enabling a candidate NIR counterpart search in the crowded field towards the Galactic center. The X–ray position of IGR J174542919 is compatible with the NIR source 2MASS J17452768–2919534. Archival (2MASS, UKIDSS, VVV) and new (GROND) NIR observations of the source taken during the 2014 outburst have been investigated. The obtained band values are compatible with an K/M-type companion in the case of a red giant with a hint of brightening in the band. This is consistent with an enhanced emission from the accretion disk of an LMXB. Moreover, the - value does not seem to match any spectral type and this could mean that we are seeing the contribution from the accretion disk, with some of the absorbing material possibly local to the accreting object alone. It is not straightforward to unveil the nature of this elusive source. However, considering the outburst X–ray properties and the NIR ones, IGR J174542919 is most likely an LMXB, with no current indication on the nature of the compact object. We thank the Chandra team for their rapid response in
scheduling and delivering the observation.
|
||||||
| This work is partly based on observations with INTEGRAL, an ESA project with instruments and science data center funded by ESA member states, Czech Republic and Poland, and with the participation of Russia and the USA. | ||||||
| This research has made use of the INTEGRAL sources page http://irfu.cea.fr/Sap/IGR-Sources/. | ||||||
| Part of the GROND funding (both hardware and personnel) was generously granted from the Leibniz-Prize to Prof. G. Hasinger, Deutsche Forschungsgemeinschaft (DFG) grant HA 1850/28-1. Sebastian Schmidl acknowledges support by the Thüringer Ministerium für Bildung, Wissenschaft und Kultur under FKZ 12010-514. Based on data products from observations made with ESO Telescopes at the La Silla or Paranal Observatories under ESO programme ID 179.B-2002. |