KamLAND Sensitivity to Neutrinos from Pre-Supernova Stars
Abstract
In the late stages of nuclear burning for massive stars (), the production of neutrino-antineutrino pairs through various processes becomes the dominant stellar cooling mechanism. As the star evolves, the energy of these neutrinos increases and in the days preceding the supernova a significant fraction of emitted electron anti-neutrinos exceeds the energy threshold for inverse beta decay on free hydrogen. This is the golden channel for liquid scintillator detectors because the coincidence signature allows for significant reductions in background signals. We find that the kiloton-scale liquid scintillator detector KamLAND can detect these pre-supernova neutrinos from a star with a mass of at a distance less than 690 pc with 3 significance before the supernova. This limit is dependent on the neutrino mass ordering and background levels. KamLAND takes data continuously and can provide a supernova alert to the community.
1 Introduction
The first extrasolar neutrinos were detected from SN1987A by the Kamiokande-II (Hirata et al., 1987, 1988), IMB (Bionta et al., 1987), and Baksan (Alekseev et al., 1987) experiments. This dataset has provided many insights into the properties of neutrinos and the physics of supernovae (Vissani, 2015). SN1987A was located in the Large Magellanic Cloud at a distance of kpc. A core-collapse supernova in the Milkyway proper would provide a larger flux of neutrinos. This combined with the large suite of running neutrino experiments makes the next Galactic supernova a greatly anticipated event (Scholberg, 2012).
In a Type II supernova, a huge burst of neutrinos is released, carrying away ergs of energy in 10 s. Leading up to this cataclysmic event, neutrinos have already been playing an important role in the cooling of the evolving giant star. Starting in the carbon burning phase, the dominant mechanism for cooling these massive stars is the loss of energy due to pairs created by thermal processes. From applying the discussion in Itoh et al. (1996) to Woosley & Heger (2015), the dominant process in most of stars is the pair process, . For other stars with smaller masses, the plasmon decay becomes more important, . Secondary contributions come from the photo process, and bremsstrahlung, . These thermal processes are often used to set limits on non-standard neutrino interactions since such processes would change the evolution of these objects (Heger et al., 2009). The most stringent limits on the neutrino magnetic moment come from this type of analysis (Arceo-Díaz et al., 2015).
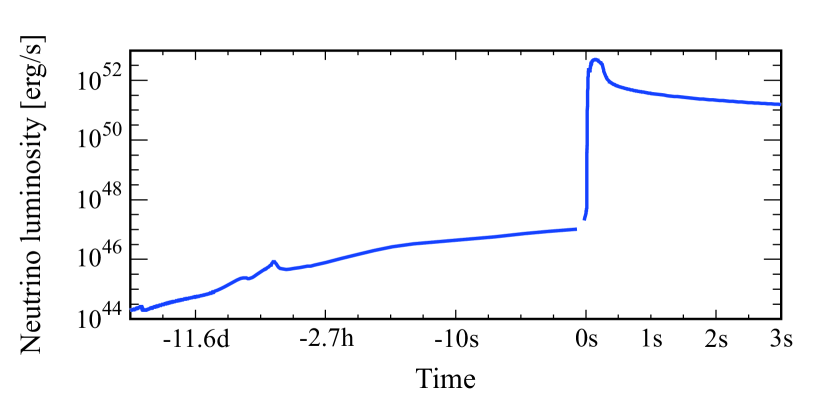
Since these thermal neutrinos precede the supernova, they can also be called pre-supernova neutrinos (preSN). Figure 1 shows the overall time evolution of the luminosity before and after the collapse according to the preSN model developed by the Odrzywolek group (Odrzywolek et al., 2004; Odrzywolek & Heger, 2010). The supernova neutrinos (SN) which follow the collapse based on Nakazato et al. (2013) are also shown for reference. Although the preSN luminosity is several orders of magnitude smaller than the SN luminosity, the detection of preSN is desired since the preSN encode information about the late stages of stellar evolution for high mass stars and could act as a supernova alert, a more detailed discussion is found in section 5.
SN extend to a few tens of MeV. In comparison, the average energy of preSN is low, typically MeV. In this energy range, there are three reactions that can be used to detect these neutrinos in realtime: coherent neutrino scattering, neutrino-electron scattering and inverse beta decay (IBD), . IBD has one of the highest cross sections for neutrino detection. It also has relatively low backgrounds due to the easily identifiable delayed coincidence signal created by the prompt positron annihilation followed by the delayed neutron capture. Depending on the detector material, coherent neutrino scattering may have a higher cross section than IBD, but the signal has never been observed due to the very low reconstructed energy of the recoiling nucleus. The detection of preSN through neutrino-electron scattering is possible. However, its cross section is lower than IBD, which reduces the total number of detected events, and the background rate is high since there is no coincidence signal. Thus, IBD is the most promising channel for preSN detection.
The energy threshold for IBD is 1.8 MeV. A few days before the supernova, a significant fraction of exceeds the IBD threshold and it becomes possible to detect the preSN with IBD. IBD is the main supernova channel for both liquid-scintillator detectors and water-Cherenkov detectors like Super-Kamiokande. Water-Cherenkov detectors have relatively high energy thresholds, such as MeV (Renshaw et al., 2014). This limits both the number of IBD prompt events and the efficiency for detecting the delayed neutron capture. In comparison, monolithic liquid-scintillator detectors have energy thresholds below 1 MeV and are therefore able to sample a larger fraction of the preSN prompt energy spectrum and effectively detect the neutron capture. Thus, liquid-scintillator detectors have an advantage for the detection of preSN, even if they are smaller than typical water-Cherenkov detectors.
There are two operating monolithic liquid-scintillator detectors with low-energy thresholds, KamLAND and Borexino (Cadonati et al., 2002). The SNO+ detector (Chen, 2008) is expected to come online soon and construction has started on the 20 kton JUNO detector (Li, 2014). In addition, there are several proposals for multi-kton experiments such as RENO-50 (Kim, 2014), HANOHANO (Learned et al., 2008), LENA (Wurm et al., 2012), and ASDC (Alonso et al., 2014). All of these detectors would be sensitive to this preSN IBD signal. A large Gd-doped water-Cherenkov detector such as Gd-doped Super-Kamiokande (Beacom & Vagins, 2004) would have increased sensitivity due to the higher neutron capture detection efficiency but the higher energy threshold continues to limit the sensitivity. The Baksan and LVD scintillator detectors are similarly limited in their sensitivity to preSN due to their relatively high energy thresholds (Novoseltseva et al., 2011; Agafonova et al., 2015).
In the previous studies (Odrzywolek et al., 2004; Odrzywolek & Heger, 2010; Kato et al., 2015), the expected number of IBD events in several detectors is evaluated without a detailed detector response model. We focus on KamLAND since it is currently the largest monolithic liquid-scintillator detector. In this article, we quantify KamLAND’s sensitivity to the preSN using the actual background rates and a realistic detector response model. We discuss the development of a supernova alert based on preSN. Betelgeuse is a well-known possible supernova progenitor (Dolan et al., 2014) and we evaluate the performance of the preSN alert based on this astrophysical object.
2 PreSN signal
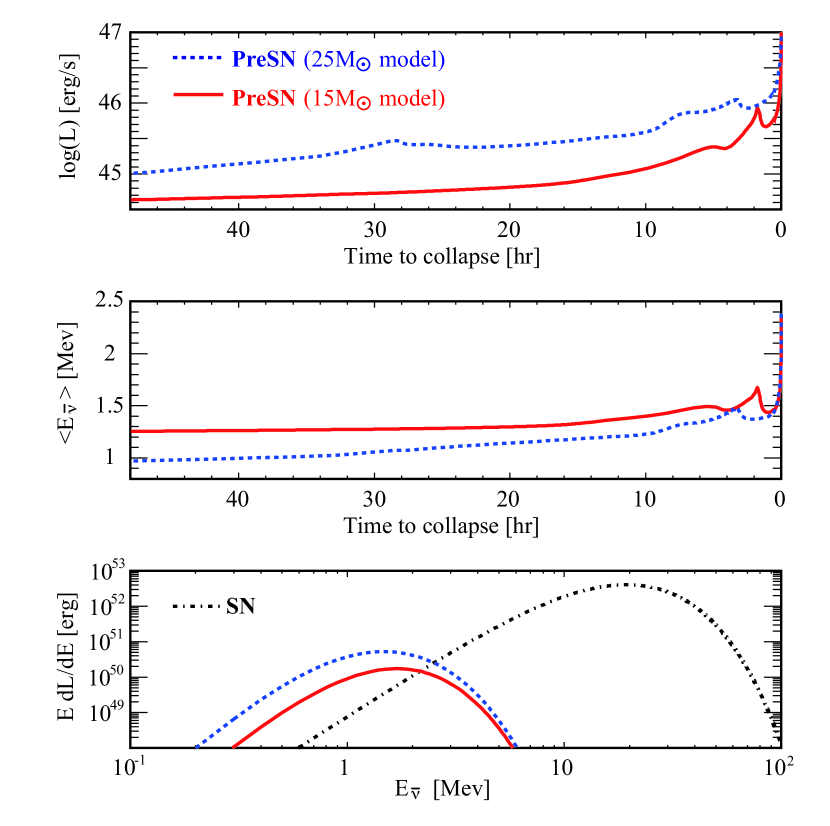
The first calculation of the number of detected preSN is found in Odrzywolek et al. (2004) and updates can be found in Odrzywolek & Heger (2010) and Kato et al. (2015). We use the preSN spectra as a function of time and energy from the Odrzywolek’s results corrected for the distance of to the pre-supernova star. We use this to calculate KamLAND’s sensitivity to preSN with two example stars of and . Figure 2 shows the time evolution of the luminosity in the top panel and the averaged energy in the middle panel during the 48 hr before the collapse. The integrated luminosity over the last 48 hr preceding collapse is erg and erg, respectively, for the two star masses. They correspond to and , respectively. The weighed differential luminosity by energy, , is also shown in the bottom of Figure 2 with the SN for reference. The average energy of the integrated flux is 1.4 MeV and 1.2 MeV for the and models, respectively.
In detectors, the reconstructed prompt (positron in IBD) spectrum can be written as,
| (1) |
where is the number of target protons in the analysis volume, is the IBD cross section (Strumia & Vissani, 2003), is the mean livetime-to-runtime ratio, is the total detection efficiency. The details of these parameters are presented in Section 3. is the reconstructed energy and MeV is the expected energy of the prompt event for an input with an energy of . The integration in Equation (1) is a convolution of the theoretical spectrum with the detector response. We model the detector response as a Gaussian with with energy resolution :
| (2) |
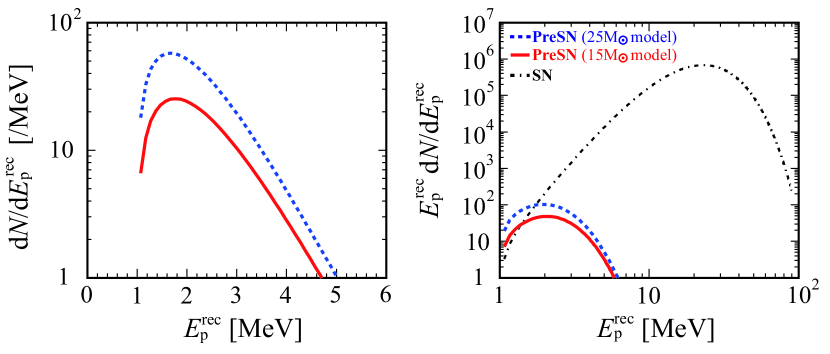
Assuming preSN emitted from the 200 pc star and the perfect 1 kt detector with , , and , the event spectrum integrated over the last 48 hr preceding collapse is shown in the left panel of Figure 3. The number of arrival in the last 48 hr is for the star and for the star, respectively. The total number of preSN events in the detector is 44 and 95, respectively.
The right panel of Figure 3 shows the preSN spectrum integrating over the last 48 hr and SN spectrum integrating over 10 sec with the vertical axis of . Our assumption of supernovae at 200 pc is 50 times closer than the usually assumed 10 kpc. We note that the SN from 200 pc supernovae will create events in the detector. The current KamLAND electronics will not be able to record more than the basic hit information for the SN. The information from the preSN will not be lost in the case of the DAQ crash.
Neutrino oscillation in the preSN emission region reduces the flux. The flux of observable can be expressed following Kneller et al. (2008) as,
| (3) |
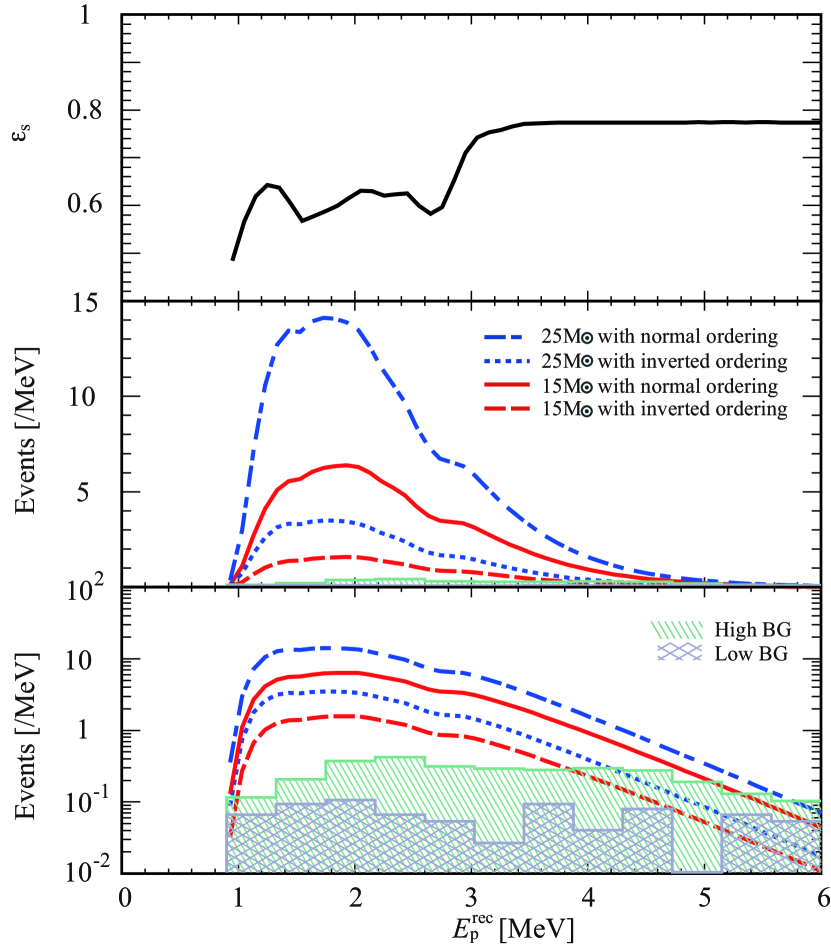
where and are the original spectra of and . With the assumption of based on and a ratio of 0.19 from Odrzywolek et al. (2004), and an adiabatic approximation for with and () from Capozzi et al. (2014), we have , where corresponding to the normal (inverted) neutrino mass order. The corrected spectrum for the neutrino oscillation is then given by multiplying the coefficient . With the integral over the last 48 hr preceding collapse, the event spectrum is shown with the oscillation effect and the full detector response in the middle and bottom panels of Figure 4 with KamLAND using the parameters describe in Sec. 3.
3 KamLAND detector and its background
KamLAND is located in the Kamioka Mine in Japan’s Gifu prefecture (N, E). Mt. Ikenoyama rises km above the detector reducing backgrounds due to cosmic rays by five orders of magnitude. The KamLAND detector consists of approximately 1 kt of liquid scintillator, a mixture of 20% psuedocume and 80% dodecane. It is contained in a 13-m-diameter spherical balloon made of a 135-m-thick transparent nylon ethylene vinyl alcohol copolymer (EVOH) composite film. An array of photomultiplier tubes (PMTs) is used to detect the scintillation light from events occurring within the balloon. This array consists of 1,325 fast PMTs masked to 17-inch diameter to achieve the desired timing performance and 554 older 20-inch diameter PMTs reused from the Kamiokande experiment. The PMTs are mounted on the inner surface of an 18 m-diameter stainless steel sphere. Non-scintillating mineral oil fills the space between the balloon and the inner surface of the sphere. Its density is matched to the liquid scintillator to support the balloon and also acts as a passive shielding against external backgrounds from the sphere, PMTs, and surrounding rocks. This inner detector is further shielded by a 3.2 kton water-Cherenkov veto detector. In 2011, a 3.08 m-diameters inner balloon containing 13 tons of Xe-loaded liquid scintillator (Xe-LS) was installed in the center of the main balloon as a part of the KamLAND Zero-Neutrino Double-Beta Decay (KamLAND-Zen) experiment (Gando et al., 2012).
The position and energy of an event within the balloon can be reconstructed using the timing and charge distribution obtained from the PMT array. The reconstruction is calibrated by a number of radioactive sources: 60Co, 68Ge, 203Hg, 65Zn, 241Am9Be, 137Cs, and 210Po13C (Berger et al., 2009; Banks et al., 2015). From these calibrations and naturally occurring radioactive sources, the energy resolution ()is determined to be 6.4 and the position reconstruction 12 cm.
Candidate events corresponding to the prompt positron annihilation and delayed neutron capture of the IBD interaction are selected with a series of cuts on the energy, position, time and space coincidence of the two events. The two events must occur with (s)1000 and within 2.0 m, where and are time and spatial differences. The reconstructed position of both events must be within a spherical fiducial volume m, which determines the fiducial number of target proton, . The reconstructed energy of the prompt event is required to be in the energy range . The delayed event has an energy characterized by the energy of the neutron capture gammas. Two energies are used: corresponding to capture on H and corresponding to capture on 12C. An energy and position dependent likelihood variable is constructed to differentiate from backgrounds due to accidental coincidences, which become more likely at lower energies and as events reconstruct closer to the balloon (Gando et al., 2011). Finally, an additional position cut on the delayed event is applied to eliminate backgrounds due to the KamLAND-Zen inner balloon and support structure. The cut eliminates a central sphere and cylinder: m and m for m where is the reconstructed position of the delayed capture event.
This series of cuts matches the standard KamLAND analysis (Gando et al., 2013). The minimum prompt energy is chosen to guarantee 100% detection efficiency for with a energy of 1.8 MeV. The total efficiency of these cuts, , is energy dependent due to the Likelihood selection as shown in Figure 4 (Top). The efficiency loss is dominated by the inner balloon cut. Without this cut, the efficiency is higher, 0.9 depending on the energy of the prompt event. Further cuts are used to remove backgrounds due to high energy muon events. The effect of these cuts is to reduce the effective livetime to even though KamLAND takes data continuously.
After these cuts are applied, the measured event spectrum in the preSN region () is mainly from reactor and geological produced in the Earth’s interior. These are the backgrounds to the preSN signal. Since the Great East Japan Earthquake, the reactors in Japan have been off. This is the low-reactor phase, and the reduced backgrounds increase our preSN sensitivity. The measured background spectra are shown in the middle and bottom panels in Figure 4 for the low-reactor phase and the high-reactor phase. In this figure, the background spectra are normalized to the 48 hr window.
4 Sensitivity
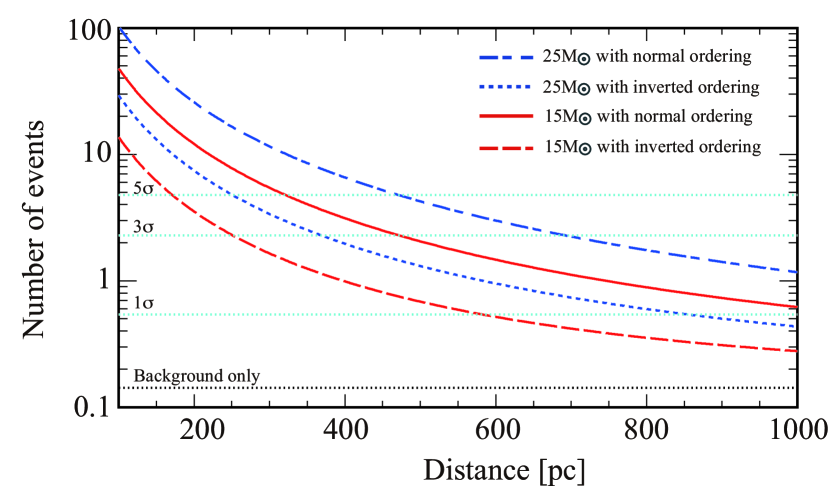
The middle and bottom panels in Figure 4 show measured background and expected preSN spectra, integrated over the 48 hr window immediately before the collapse. Different integration lengths were studied and this length was chosen to maximize the signal-to-background ratio. To study the sensitivity, we use the analysis range of to maximize the preSN signal to background ratio while retaining 90% of the preSN signal. The background rate is event/day in the low-reactor phase. If the reactors return to normal operations, the background rate rises to events/day. The average efficiency is in this range. For the number of events , where indicates the neutrino mass ordering ( for the normal/inverted order), we integrate Eq. (1) from 0.9 MeV to 3.5 MeV and over the 48 hr before the collapse. They are now , and , . The are shown as a function of in Figure 5.
Using with background 2 days (=low or high), the corresponding detection significance, expressed in sigma, is estimated. The results for a detection significance of , , and assuming are plotted in Figure 5. If a significance is required for preSN detection, KamLAND is sensitive to preSN from a 25 star at 690 pc assuming and the normal neutrino mass ordering. In the worst case, KamLAND is still sensitive to a 15 star at 250 pc. In this distance range, there are several red-supergiants which could lead to supernovae: Antares (150 pc), Betelgeuse (200 pc), Epsilon Pegasi (210 pc), Pi Puppis (250 pc), Sigma Canis Majoris (340 pc), NS Puppis (520 pc), CE Tauri (550 pc) and 3 Ceti (640 pc).
Betelgeuse has been studied extensively as a nearby pre-supernova star, see Townes et al. (2009); Haubois et al. (2009); Ohnaka et al. (2009), therefore we use it to determine KamLAND’s sensitivity as a function of time before collapse. Betelgeuse’s measured mass – and distance pc are highly correlated (Harper et al., 2008). We studied the two extreme cases: (, ) = (15 , pc) and (25 , pc). The expected time evolution of significance with the 48 hr integration window is shown in Figure 6, assuming the low-reactor background.
If Betelgeuse has (, ) =(15 , pc), KamLAND will easily detect its preSN. A 3 detection of preSN would be 89.6 (7.41) hr before collapse for the normal (inverted) mass ordering. If Betelgeuse has (25 , pc), the increased distance reduces the preSN flux and the number of hours before collapse which KamLAND could detect preSN. If the reactors in Japan are restarted, the number of hours is also reduced because of the larger backgrounds. Table 1 summarizes the results and shows for all of these cases that KamLAND can still detect preSN and has the ability to send a supernova alarm before collapse.
5 Discussion
We quantitatively evaluated KamLAND’s sensitivity to preSN. Using Betelgeuse as a likely progenitor, we find that a detection of preSN at 2–90 hr before the collapse is possible. This a great improvement over the warning time provided by the current SuperNova Early Warning System (SNEWS) described in Antonioli et al. (2004). The SNEWS alarm is not sufficient to bring gravitational wave and neutrino detectors back online from commissioning or calibration campaigns (Dooley, 2015) or redirect telescope time for shock breakout observations (Adams et al., 2013). In comparison, the 2 hour to days provided by KamLAND ’s detection of preSN would facilitate these measurements.
This is the motivation for the development of the preSN alert system. It provides two levels of alarms. A low-level alarm is produced using the semi-realtime preSN detection significance. This is calculated using a 48 hr integration window and the background level averaged over the past three months. A new window is opened every 15 min and has a latency of 25 min due to KamLAND’s online data processing time. This system requires users to sign up to receive the current significance of detection, see the KamLAND web site111http://www.awa.tohoku.ac.jp/kamland/SNmonitor/regist/index.html. A high-level alarm will report any 5 detections to the The Gamma-ray Coordinates Network (GCN) and/or the Astronomer’s Telegram (ATel). This alarm is only sent after that the collaboration rejects other possibilities such as DAQ problems, mine activity, and radon contamination. Unfortunately, the IBD reaction does not provide directional information so a definitive localization requires SNEWS alarms, direction detection in Super-Kamiokande, coherent network analysis of gravitational waves (Hayama et al., 2015) and/or electromagnetic observations. However, the limited number of known local progenitors limits the total number of targets that could create a preSN signal in KamLAND and therefore some localization is still possible.
In addition to the alarm, preSN could teach us about neutrino and supernova properties. The detection of preSN from Betelgeuse’s supernova and an improvement in the measurement of its mass and distance would allow the determination of the normal neutrino mass ordering at 3.6 (2.5) for the 25 (15 ) star. The detection of preSN could also distinguish between a supernova with an ONe core or an Fe core (Kato et al., 2015).
6 Summary
We evaluated the KamLAND’s sensitivity to preSN, neutrino-antineutrino pairs from massive stars that have entered the late burning phases. Detection of preSN could provide an early warning for the imminent occurrence of a supernova and provide an opportunity to study stellar evolution models in the last stages prior to collapse. This study quantitatively confirms that the detection of preSN is possible for stars with distances up to 690 pc under optimal conditions. The number of pre-supernova stars at this distance is limited but includes several promising candidates such as Betelgeuse. KamLAND presently provides the community with a preSN alarm based on the semi-realtime significance calculation and will send a report to GCN/ACTel for any 5 detection that have been verified by the KamLAND collaboration.
There are several other detectors under construction or proposed: SNO+ (Chen, 2008), RENO-50, HANOHANO (Learned et al., 2008), JUNO (Li, 2014), LENA (Wurm et al., 2012), ASDC (Alonso et al., 2014), and Gd-doped Super-Kamiokande (Beacom & Vagins, 2004). These detectors are expected to have similar or higher sensitivity to preSN and a coincident preSN search would significantly reduce false signals. A future combined alarm system could increase the detection range to a few kpc. This extended range would include several other pre-supernova stars including Eta-Carinae.
The preSN are an exciting tool for both the study of stellar evolution and the supernova observation. The current models of preSN production are fairly simple. KamLAND’s sensitivity to both the flux and energy of the preSN could be used to extract more information on the late stages of evolution if more detailed predictions become available.
References
- Adams et al. (2013) Adams, S. M., Kochanek, C., Beacom, J. F., Vagins, M. R., & Stanek, K. 2013, ApJ, 778, 164
- Agafonova et al. (2015) Agafonova, N., et al. 2015, ApJ, 802, 47
- Alekseev et al. (1987) Alekseev, E. N., Alekseeva, L. N., Volchenko, V. I., & Krivosheina, I. V. 1987, J. Exp. Theor. Phys. Lett., 45, 589
- Alonso et al. (2014) Alonso, J. R., Barros, N., Bergevin, M., et al. 2014, arXiv:1409.5864
- Antonioli et al. (2004) Antonioli, P., Fienberg, R. T., Fleurot, F., et al. 2004, New Journal of Physics, 6, 114
- Arceo-Díaz et al. (2015) Arceo-Díaz, S., Schröder, K.-P., Zuber, K., & Jack, D. 2015, Astroparticle Physics, 70, 1
- Banks et al. (2015) Banks, T., Freedman, S., Wallig, J., et al. 2015, Nucl. Instrum. Meth. A, 769, 88
- Beacom & Vagins (2004) Beacom, J. F., & Vagins, M. R. 2004, Phys. Rev. Lett., 93, 171101
- Berger et al. (2009) Berger, B. E., Busenitz, J., Classen, T., et al. 2009, JINST, 4, P04017
- Bionta et al. (1987) Bionta, R. M., Blewitt, G., Bratton, C. B., et al. 1987, Phys. Rev. Lett., 58, 1494
- Cadonati et al. (2002) Cadonati, L., Calaprice, F., & Chen, M. 2002, Astroparticle Physics, 16, 361
- Capozzi et al. (2014) Capozzi, F., Fogli, G. L., Lisi, E., et al. 2014, Phys. Rev. D, 89, 093018
- Chen (2008) Chen, M. C. 2008, arXiv:0810.3694
- Dolan et al. (2014) Dolan, M. M., Mathews, G. J., Lam, D. D., et al. 2014, arXiv:1406.3143
- Dooley (2015) Dooley, K. L. 2015, J. Phys. Conf. Ser., 610, 012015
- Gando et al. (2011) Gando, A., Gando, Y., Ichimura, K., et al. 2011, Phys. Rev. D, 83, 052002
- Gando et al. (2012) Gando, A., Gando, Y., Hanakago, H., et al. 2012, Phys. Rev. C, 85, 045504
- Gando et al. (2013) —. 2013, Phys. Rev. D, 88, 033001
- Harper et al. (2008) Harper, G. M., Brown, A., & Guinan, E. F. 2008, ApJ, 135, 1430
- Haubois et al. (2009) Haubois, X., Perrin, G., Lacour, S., et al. 2009, Astron. Astrophys., 508, 923
- Hayama et al. (2015) Hayama, K., Kuroda, T., Kotake, K., & Takiwaki, T. 2015, arXiv:1501.00966
- Heger et al. (2009) Heger, A., Friedland, A., Giannotti, M., & Cirigliano, V. 2009, ApJ, 696, 608
- Hirata et al. (1987) Hirata, K., Kajita, T., Koshiba, M., et al. 1987, Phys. Rev. Lett., 58, 1490
- Hirata et al. (1988) Hirata, K. S., Kajita, T., Koshiba, M., et al. 1988, Phys. Rev. D, 38, 448
- Itoh et al. (1996) Itoh, N., Hayashi, H., Nishikawa, A., & Kohyama, Y. 1996, ApJS, 1024, 411
- Kato et al. (2015) Kato, C., Azari, M. D., Yamada, S., et al. 2015, ApJ, 808, 168
- Kim (2014) Kim, S.-B. 2014, arXiv:1412.2199
- Kneller et al. (2008) Kneller, J. P., McLaughlin, G. C., & Brockman, J. 2008, Phys. Rev. D, 77, 045023
- Learned et al. (2008) Learned, J. G., Dye, S. T., & Pakvasa, S. 2008, arXiv:0810.4975
- Li (2014) Li, Y.-F. 2014, arXiv:1402.6143
- Nakazato et al. (2013) Nakazato, K., Sumiyoshi, K., Suzuki, H., et al. 2013, ApJS, 205, 2
- Novoseltseva et al. (2011) Novoseltseva, R., Boliev, M., Vereshkov, G., et al. 2011, Bull. Russ. Acad. Sci. Phys., 75, 419
- Odrzywolek & Heger (2010) Odrzywolek, A., & Heger, A. 2010, ACTA Physica Polonica B, 41, 1611
- Odrzywolek et al. (2004) Odrzywolek, A., Misiaszek, M., & Kutschera, M. 2004, Astropart. Phys., 21, 303
- Ohnaka et al. (2009) Ohnaka, K., Hofmann, K.-H., Benisty, M., et al. 2009, Astron. Astrophys., 503, 183
- Renshaw et al. (2014) Renshaw, A., Abe, K., Hayato, Y., et al. 2014, Phys. Rev. Lett., 112, 091805
- Scholberg (2012) Scholberg, K. 2012, Ann. Rev. Nucl. Part. Sci, 62, 81
- Strumia & Vissani (2003) Strumia, A., & Vissani, F. 2003, Physics Letters B, 564, 42
- Townes et al. (2009) Townes, C. H., Wishnow, E. H., Hale, D. D. S., & Walp, B. 2009, ApJ, 697, L127
- Vissani (2015) Vissani, F. 2015, J. Phys. G: Nucl. Part. Phys, 42, 013001
- Woosley & Heger (2015) Woosley, S. E., & Heger, A. 2015, arXiv:1505.06712
- Wurm et al. (2012) Wurm, M., Beacom, J. F., Bezrukov, L. B., et al. 2012, Astropart. Phys., 35, 685

| Mass [] | Distance [pc] | Mass ordering | Reactor status | Time before collapse [hr] |
|---|---|---|---|---|
| 15 | 150 | Normal | low | 89.6 |
| 15 | 150 | Inverted | low | 7.41 |
| 25 | 250 | Normal | low | 17.0 |
| 25 | 250 | Inverted | low | 4.54 |
| 15 | 150 | Normal | high | 46.0 |
| 15 | 150 | Inverted | high | 3.17 |
| 25 | 250 | Normal | high | 11.1 |
| 25 | 250 | Inverted | high | 1.93 |