VIMOS mosaic integral-field spectroscopy of the bulge and disk of the early-type galaxy NGC 4697
Abstract
We present an integral field study of the internal structure, kinematics and stellar population of the almost edge-on, intermediate luminosity () elliptical galaxy NGC 4697. We build extended 2-dimensional (2D) maps of the stellar kinematics and line-strengths of the galaxy up to effective radii () using a mosaic of 8 VIMOS (VIsible Multi-Objects Spectrograph on the VLT) integral-field unit pointings. We find clear evidence for a rotation-supported structure along the major axis from the 2D kinematical maps, confirming the previous classification of this system as a ‘fast-rotator’. We study the correlations between the third and fourth Gauss-Hermite moments of the line-of-sight velocity distribution (LOSVD) and with the rotation parameter (), and compare our findings to hydrodynamical simulations. We find remarkable similarities to predictions from gas-rich mergers. Based on photometry, we perform a bulge/disk decomposition and study the stellar population properties of the two components. The bulge and the disk show different stellar populations, with the stars in the bulge being older ( age Gyr, ageGyr) and more metal-poor ( , ). The evidence of a later-formed, more metal-rich disk embedded in an older, more metal-poor bulge, together with the LOSVD structure, supports a mass assembly scenario dominated by gas-rich minor mergers and possibly with a late gas-rich major merger that left a previously rapidly rotating system unchanged. The bulge and the disk do not show signs of different stellar Initial Mass Function slopes, and both match well with a Milky Way-like IMF.
keywords:
galaxies : formation – galaxies : evolution – galaxies : elliptical and lenticular1 Introduction
Integral Field Spectroscopy (IFS) makes it possible to derive spatially resolved and continuously sampled line-of-sight velocity distribution (LOSVD) 2-dimensional (2D) maps, providing a unique view of the internal structure of galaxies, as well as detailed morphological and dynamical information, which are essential to fully understand the physical mechanisms that regulate galaxy formation and evolution.
An increasing number of studies have recently derived the integrated and spatially resolved properties of a statistical sample of nearby galaxies using IFS (e.g. Bacon et al. 2001; Thatte et al. 2006; Rawle et al. 2008; Czoske et al. 2008; Scott et al. 2012; Fogarty et al. 2014; González Delgado et al. 2014; Sánchez-Blázquez et al. 2014; Walcher et al. 2014). Among the most successful, the ATLAS3D(Cappellari et al. 2011) data set provides a complete inventory of the baryon budget and a detailed 2D analysis of stellar and gaseous kinematics, together with resolved stellar populations of a complete and statistically significant sample of early-type galaxies (ETGs) in the local Universe.
One of the most interesting results of the ATLAS3D team is that it is possible to connect the 2D features of the line-of-sight-velocity distribution (LOSVD) to galaxy formation scenarios by comparing these to high-resolution simulations (e.g. Naab et al. 2014, hereafter N+14). For the majority of early-type galaxies (%), the formation processes result in disk-like objects that maintain the axisymmetric shape of the progenitors, while only a small fraction of systems (the most massive ones, %) rotate slowly with no indication of disks. Possible processes that can form embedded disk components include minor mergers, major merger with disk regrowth, gas accretion events and secular evolution (Krajnović et al. 2011).
It is possible, in principle, to discriminate between the different formation scenarios by accurately analyzing the higher moments of the LOSVD, the Gauss-Hermite coefficients and (representing skewness and kurtosis, respectively) and comparing these to high-resolution simulations. Gas has a strong impact on the non-Gaussian shapes of the line-of-sight velocity distributions (LOSVDs) of the merger remnants. In particular, when the values of and have opposite signs, the leading (pro-grade) wing is steeper than the trailing (retrograde) wing. This indicates the presence of an embedded disk (see e.g. Bender, Saglia & Gerhard 1994). When an anti-correlation between the and the values does not exist but the galaxy shows a fast rotation profile, the rotation could be have caused by a recent gas poor major merger that typically does not permit re-growth of a significant disk component (Barnes & Hernquist 1996; Naab, Khochfar & Burkert 2006; Hoffman et al. 2009, hereafter H+09). The sign of the coefficient distinguishes a peaked shape () from a flat-topped one (), where the peak is broad and the wings are narrow.
The age and metal content of galaxies can provide additional important information about the formation mechanism and its time-scale. To obtain an unbiased and detailed understanding of the star formation history of ETGs from their integrated light, it is necessary to study carefully their unresolved stellar populations, and to break the degeneracies existing between age, metallicity and element abundances (e.g. Worthey 1994). The best way to achieve this is to look at as many stellar features as possible (Spiniello et al. 2014, hereafter S+14). Clearly, in this context, the very narrow wavelength coverage of SAURON is not ideal, since stellar population studies would rely on only a few well known blue-optical absorption lines (H, Mg, Fe5015 and Fe5270).
The VIMOS IFU (VIsible Multi-Objects Spectrograph on the VLT) covers a wider wavelength range (5250-7400 Å using the blue grism and 6450-8600 Å using the red grism, in its high-resolution mode), with comparable spectral and spatial resolution, and is clearly a better choice. This point is particularly relevant after the recent finding that the low-mass end of the Initial Mass Function (IMF) is not universal and might become steeper with increasing stellar mass and stellar velocity dispersion (van Dokkum & Conroy 2010; Treu et al. 2010; Spiniello et al. 2012; Cappellari et al. 2012, 2013; Dutton et al. 2013a; Spiniello et al. 2014; La Barbera et al. 2013; Tortora, Romanowsky & Napolitano 2013; Tortora et al. 2014b, a, but see also Smith, Lucey & Conroy 2015) or with changes in other galaxy structural parameters (e.g. compactness, stellar density, size, see Spiniello et al. 2015b, submitted). Indeed, to constrain the low-mass end of the IMF, it is crucial to look at the red part of the optical spectra, where most of the gravity-sensitive absorption features are. Some of the most promising indices, like the optical TiO molecular lines (bTiO, aTiO, TiO1; S+14), can be captured with VIMOS but are outside the SAURON coverage. Moreover, the SWELLS survey (Treu et al. 2011) has shown that there could be one universal normalization of the IMF for disk-like stellar populations (presumably Chabrier-like) and a “heavier” (Salpeter-like) one for the older and possibly more metal rich stellar populations found in massive bulges and spheroids (Dutton et al. 2013b).
Furthermore, 2D integral-field spectroscopy is crucial for constraining the low-mass end of the IMF slope, given the very recent observational evidence that seems to indicate that the IMF normalization varies within individual galaxies (Martín-Navarro et al. 2015; Sarzi, Spiniello & Krajnovíc, 2015, in prep.) following the velocity dispersion profile (but see also Smith, Lucey & Conroy 2015; Spiniello et al. 2015). In this context, a strong observational limitation is the small field-of-view (FOV) of IFS instruments, typically of the order of tens of arcsec, preventing good coverage of the target galaxies on the sky and a proper spatially-resolved study of the IMF slope. Only very recently has a new class of integral-field spectrographs with larger field of view been built to achieve the challenging task of studying the internal structure of galaxies. Unfortunately most of them still cover a small range of wavelength and therefore are not suitable for constraining the low-mass end of the IMF normalization (e.g. VIRUS-P, 3600–6800 Å, Hill et al. 2008, or CALIFA, 3750–7000 Å, Sánchez et al. 2012 in its red configuration). The VLT Multi Unit Spectroscopic Explorer (MUSE) represents the perfect solution, combining a large field of view ( arcmin) and a wide wavelength range (4650–9300 Å). Finally, in the near future the MaNGA (Mapping Nearby Galaxies at APO, Law & MaNGA Team 2014) project will further improve the situation, covering the wavelength range 3600–10000 Å up to with a spatial resolution of arcsec (and a resolution of R). We refer to Table 1 of Brodie et al. (2014) for a detailed comparison between current and future integral-field surveys.
Thus, at the present day, VIMOS remains among the most competitive instruments for galaxy structure and stellar population studies, provided that the small FOV is compensated for by mosaic observations, i.e. contiguous IFU pointings astrometrized and stacked together to create a larger final FOV.
This is indeed the approach we decided to follow in order to attempt to systematically study the stellar population and the kinematics of the whole surface of nearby ETGs up to almost the effective radius over a large wavelength range and with medium-high spectral resolution. Given the challenges in the data reduction, calibration and visualization, with this paper we present the analysis of one of the galaxies observed in a pilot program focusing on the kinematics and the stellar population analysis of two flattened galaxies (NGC 821 and NGC 4697)111 Program IDs P079.B-0622A and P085.B-0949 (P.I. N.R. Napolitano).. In particular we focus on NGC 4697, for which we have 8 VIMOS pointings covering effective area, which allows us to investigate regions up to from the galaxy center, i.e. 0.7 ( from de Lorenzi et al. 2008).
1.1 Target selection and outline of the paper
NGC 4697 is an E6, almost edge-on galaxy located along the Virgo southern extension, with evidence of substructures (from HST ACS images, Lauer et al. 1995) and the presence of a strong streaming motion component (known since the pioneering work of Bertola & Capaccioli 1975). The galaxy is representative of the class of disky, fast-rotating elliptical galaxies (Bender, Saglia & Gerhard 1994), which are candidates for having less dark matter (Covone & Napolitano 2004; Napolitano et al. 2005; Cappellari et al. 2006) than the boxy, slow-rotators of comparable mass. As such, it is among the sample of elliptical galaxies whose planetary nebula (PN) kinematics show surprisingly little sign of a massive dark matter halo (Méndez et al. 2001; Romanowsky et al. 2003; Napolitano et al. 2005; Douglas et al. 2007; Méndez et al. 2009). Finally, the spheroidal part of NGC 4697 may well be a large bulge (Dejonghe et al. 1996) and therefore this system is an interesting candidate for testing the SWELLS (Treu et al. 2011) claim about the different normalization of the low-mass end of the IMF slope (universal, Milky Way-like IMF for the disks and more bottom-heavy IMF, possibly steepening with velocity dispersion for bulges, Dutton et al. 2013b).
Based on the combined information of the 2D kinematical characterization of the system, and stellar population analysis, we are able to fully characterize the stellar population of the disk and bulge components of NGC 4697. This is important per se in order to investigate the variation of the stellar populations and IMF slope in different structural components of the system and possibly to infer a formation scenario for it, but it will also allow us to correctly normalize the stellar mass of the galaxy in forthcoming dynamical analysis.
The paper is organized as follows: in Section 2 we outline the observations and data reduction, in Section 3 we introduce our kinematical technique and we show 2D kinematical maps as well as 1-dimensional (1D) kinematics profiles along the major axis of the galaxy. We compare the latter with kinematics profiles in literature. In particular, in this Section, we highlight correlations between the and parameters and and try to connect these to predictions from galaxy formation simulations. In Section 4, we focus on the stellar population analysis performed via line-index strengths measurements on the 1D spectra of the disk and of the bulge separately. We also attempt to constrain the IMF normalization of the two components. Finally, discussion and general findings are presented in Section 5 together with conclusions.
2 Observation and data reduction
The integral-field spectroscopic (IFS) observations have been carried out with VIMOS, the multi-mode wide-field optical instrument mounted on the ESO VLT, as part of a proposal carried on in two different runs : May 2007 and March 2010, respectively.
The Integral-field Unit (IFU) head of VIMOS consists of a square array of micro-lenses with a sampling of per spatial element (‘spaxel’) at the Nasmyth focus of the telescope. In its high-resolution mode only the central 1600 lenses are used, resulting in a field-of-view (FOV) of . The seeing was generally below during the observations, so that each fiber of the IFU gives a spectrum that is essentially independent of its neighbors. All data sets have been taken with the high-resolution blue grism, covering a wavelength range between Å with a dispersion of Å/pixel. The spectral resolution of the HR-Blue grism is , where is the full width at half-maximum (FWHM) of the instrument profile.
In order to cover the effective radius and to have a high S/N among the whole FOV, we use a mosaic approach. During the first observation run, we have obtained 6 different pointings, each made by six exposures of seconds, while for the second run we have obtained 2 pointings along the major axis of the system, with 4 exposures of seconds each. The Position Angle of all pointings has been fixed to . For accurate measurements of the stellar kinematics, one must properly evaluate the sky background contamination. Since VIMOS does not have sky-dedicated fibers, and the target galaxy covers the entire field-of-view, it has been necessary to make separate telescope pointings (of seconds) to measure the sky background for each observing night.
2.1 Data Reduction
Data reduction has been carried out using the VIMOS pipeline (version 2.1.1) by the ESO “Data Flow System Group222N. Devillard, Y. Jung, R. Palsa, C. Izzo, P. Ballester, C. Sabet, K. Banse, M. Kiesgen, L. Lundin, A. Modigliani, D. J. McKay, N. P. F. McKay, J. Moeller-Larsen, L. de Bilbao”, via the Gasgano data file organizer developed by ESO. A schematic representation of the data reduction processes performed within Gasgano is provided by Zanichelli et al. (2005). The reduction involves standard steps for fiber-based integral-field spectroscopy: (i) Subtraction of a master bias frame created by averaging all the bias frames (ii) Fiber identification (correct association of a fiber position on the IFU mask to a corresponding position on the CCD) and correction of the differences in the fiber-to-fiber transmission (iii) Wavelength calibration (iv) Scientific image combination.
We create a final data cube for each pointing by averaging over the final single-observing block (OB) flux-calibrated science cubes produced by the pipeline using the IFU tables, with the correspondence between each row (i.e. each spectrum) of the extracted spectra and the fiber’s position on the IFU head. The four IFU quadrants are treated independently up to the combination of all exposures into a single-pointing datacube.
We subtract the median sky spectrum (extracted directly from the ‘sky frame’) from the ‘science frame’. Median combining was needed to ensure that any residual contamination from faint objects was removed. We are confident that this sky-subtraction procedure is accurate enough but, if prominent sky emission lines are still present in the spectra after sky subtraction, we mask them out during the the stellar kinematics recovery process. We also investigate possible effects of the differential atmospheric refraction by checking whether or not the photometric center of the galaxy changes its position as a function of wavelength in the datacube. We find that the position does not change by more than 2 pixels ( arcsec) between 4000 and 6200 Å. Each single-pointing datacube is astrometrically calibrated independently by matching the position of the photometric center or of a star (when the center is not visible in that particular pointing) to an HST ACS image of the central region of NGC 4697. Subsequently, the different pointings are linearly interpolated onto a common 3D grid uniformly sampled, after normalizing them for exposure times, using a simple grid interpolation 333We interpolate, shift and rotate each single-pointing datacube by matching the position of the center and the rotational angle into this datacube-container. to obtain the final mosaic datacube. As a further check of the robustness of this mosaic reconstruction, we re-check the WCS astrometry on our final combined image, using as reference the same HST/ACS image.
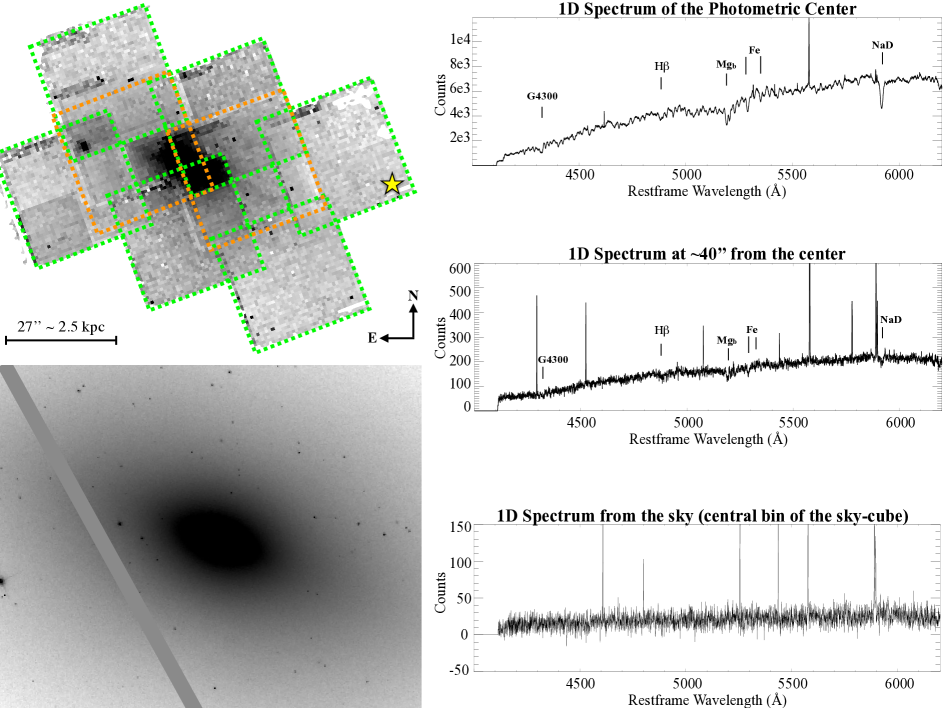
The results of this comparison are visible in Figure 1 which shows the final reconstructed mosaic image, obtained by averaging the datacube along the wavelength direction, as well as the ACS image. Twenty blue isophotes, derived from the HST image, are shown on both images to check the accuracy of our astrometrical calibration. Although most of the point sources visible in the HST image are too faint to be detected in our VIMOS observations, the positions of the center and of a star (ENE) coincide between the two instruments. On the right side of Figure 1 we also plot a 1D spectrum extracted at the photometric center of the galaxy and another 1D spectrum extracted at , in a position which is highlighted in the reconstructed FOV by a small yellow star.
3 Kinematics Measurements
To recover the line-of-sight velocity distribution (LOSVD) first, we apply a spatial binning method in order to increase the signal-to-noise ratio (S/N) over the single-fiber spatially resolved spectra of the final datacube (Section 3.1). Then we measure the LOSVD for the galaxy using a maximum penalized likelihood approach (Section 3.2). In this way, we obtain spatially resolved 2D profiles of rotation velocity, V, and velocity dispersion, , as well as the higher order Gauss-Hermite moments and , which quantify the asymmetric and symmetric departures of the LOSVD from a pure Gaussian (related to the skewness and kurtosis respectively). In the following sections we describe in more detail the spatial binning procedure and the LOSVD recovery.
3.1 Voronoi 2D spatial binning
We re-bin the data with a fixed final S/N by locally averaging neighboring fibers (using the Voronoi Adaptive technique IDL code of Cappellari & Copin 2003). We use an adaptive binning scheme where the size of the bin is adapted to the local S/N. Bigger spatial bins are created in the low-S/N regions, with higher resolution and smaller bins retained in the high-S/N regions (towards the galaxy center)444Spaxels are arranged in a regular grid, so the size is a well defined quantity..
We tested several values for the final Voronoi fixed S/N, choosing a final threshold of . In this way we are able to obtain a high resolution spectrum for each spaxel, which is fundamental for performing a proper stellar population analysis based on line-index measurements, while also preserving spatial information that is crucial for recovering detailed spatially resolved kinematics information up to effective radius ().
3.2 Line-Of-Sight Velocity Distribution (LOSVD) fitting
We measure rotation velocity, velocity dispersion and higher-order moments (V, , , ) for each Voronoi-rebinned spaxel spectrum using the pPXF code of Cappellari & Emsellem (2004). This software, working in pixel space, finds the combination of stellar templates which, convolved with an appropriate line-of-sight-velocity distribution, best reproduces the galaxy spectrum. The best-fitting parameters of the LOSVD are determined by minimizing , which measures the agreement between the model and the observed galaxy spectrum, over the set of N good pixels. We use the MILES Library of Stellar Spectra (Sánchez-Blázquez et al. 2006; Falcón-Barroso et al. 2011): 985 well-calibrated stars covering the region from 3525-7500 Å at a spectral resolution of 2.54 Å (FWHM), at the central wavelength, obtained at the 2.5m Isaac Newton Telescope (INT). The pPXF code also allows the user to mask out noisy regions of the galaxy spectrum. We mask out sky emission lines, focusing on absorption lines from Å (including in this way H, O lines, Mg doublet and Fe). Uncertainties on individual points are obtained via a Monte Carlo simulation.
We follow the approach described in Cappellari & Emsellem (2004), to recover rotation, velocity dispersion and the higher-order terms of the Gauss-Hermite series simultaneously. The method makes use of a penalization factor to the solution, which biases the results to suppress the noise. Obviously, one would like the penalty to leave the LOSVD virtually unaffected. Thus, we first perform the kinematics fit without including any penalty (i.e. setting the keyword BIAS=0 in the pPXF code) to make sure that our results have not been biased and also to properly estimate the uncertainties on the velocity distribution. This produces a noisy solution (especially for ) but allows us to set a range of values for and which can be used to estimate the right value for the penalization factor.
In particular, this has been done with the ‘ppxf simulation’ procedure (included in the publicly available code). The routine performs a Monte Carlo simulation of the spectra, which repeats the full fitting process for a large number of different realizations of the data obtained by randomly adding noise to the original spectra with a resulting S/N equal to the chosen threshold value (S/N = 70 in our case), and using as input for [ , ] the maximum representative values measured in the non-penalized pPXF fit of the previous step ([]). At this point, we repeat the fitting procedure while using as penalty the largest value such that the mean difference between the output and the input [ , ] is well within the rms scatter of the simulated values (BIAS=1.5).
Finally, we inspect by eye zones of the FOV where we expect to have contamination (e.g. near the brighter stars) and spectra for which the reduced of the fit was larger than 3. In particular, we identify “problematic” Voronoi cells, for which we go back to the single fiber spectra and re-create the Voronoi cell while excluding contaminated or noisy spectra. Then we re-run the pPXF procedure, in some cases also setting by hand the pixel regions where the fit is performed.
We take into account all the main systematic uncertainties, mostly caused by template mismatch, and wavelength coverage. In order to minimize template-mismatch errors, we fit a broad set of stellar templates together with the kinematics, after convolving both to a common resolution. We also test the robustness of the kinematic results by changing the spectral region of the fit and we find results always consistent within (not including systematics). The uncertainties on the final inferred kinematics are estimated by adding in quadrature the formal uncertainty given by the Monte Carlo simulation and the scatter in the results for different templates and spectral regions. Typically, we find uncertainties of the order of 5% for rotation and velocity dispersion and at most of the order of 10% for the higher-order LOSVD moments. For the central bin, we obtain a velocity dispersion of perfectly consistent with previously published results (i.e. Binney, Davies & Illingworth 1990; de Lorenzi et al. 2008).
3.3 Two dimensional kinematics maps
The reconstructed mosaic ( effective area), is among the largest 2D maps ever measured for an elliptical galaxy and provides a powerful tool to full characterize the internal kinematics of the system and the spatially-resolved properties of its underlying stellar population, which are necessary ingredients to understand the dynamics and its connection with formation mechanisms. Here below, we characterize the 2D behavior of all the relevant kinematical quantities, while in the next sections we discuss the properties of the stellar populations and try to establish their connection with the kinematical structure. The full dynamical analysis as well as the derivation of the mass and orbital profile of the galaxy will be presented in a forthcoming paper.
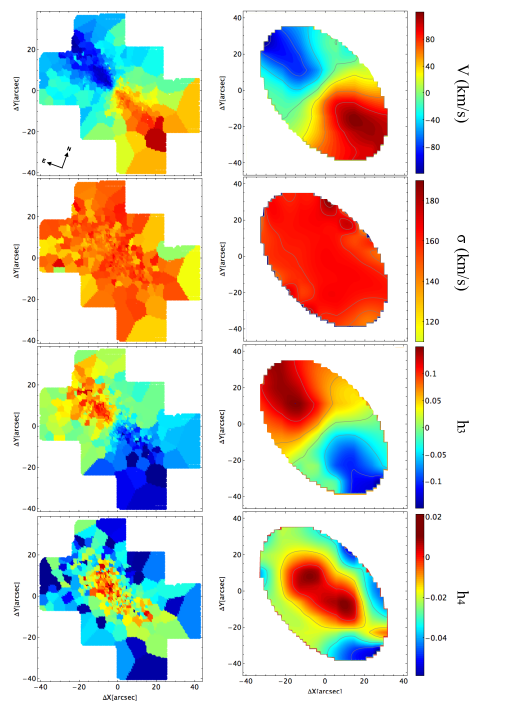
Figure 2 shows 2D maps of rotation velocity, velocity dispersion and the Gauss-Hermite moments and of the LOSVD. On the left column, these quantities are shown as derived from the Voronoi-binning technique discussed in Section 3.1. Here the small scale features are visible, mainly in the center, while the large scale structure at larger radii looks noisy. In order to make more evident the large scale pattern of the kinematical quantities, we show on the right column the 2D quantities smoothed by averaging the Voronoi values over a grid of 1515 macro bins and then interpolated. The final average maps have been masked with an ellipse mimicking the orientation and the axis ratio of the outermost isophote enclosing the VIMOS mosaic.
The galaxy shows a rotation velocity (upper panel) and (third panel from above) patterns typical of a rotation-supported structure along the major axis of the system. In particular, the indicates the presence of a disk-like structure elongated along the major axis.
The velocity dispersion map (second panel), on the other hand, is rather flat over the full area covered by our observations, with minimal, statistically insignificant fluctuations.
Finally the parameter map (bottom panel) shows a clear elongated area along the line of nodes with positive values (), which tend to become negative in the regions off the plane. which are not common for disk-like structure. The presence of negative off the main rotation axis in the regions where the rotation field is almost zero indicates tangential orbits, possibly belonging to the bulge component that starts to dominate outward (see Sec 4.1). The presence of two components along the line of sight might be responsible for the positive parameter aligned along the galaxy major axis by producing a overall peaked distribution due to the superposition of a cold disk and hot bulge.
IFS provides a complete and high resolution 2D map of the LOSVD, allowing the definition and estimation of a number of important parameters that can be used to better understand the detailed internal structure of the galaxy, a crucial ingredient for investigating possible formation scenarios. An interesting quantity that is possible to derive in 2D is the ratio of the ordered and random motion in a galaxy ().
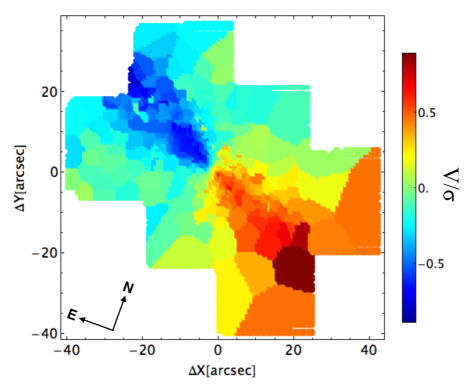
In Figure 3 we present the first 2D map of NGC 4697, up to ,which gives a more quantitative view of the dynamical state of the galaxy and further confirms the presence of the galaxy sub-components. One expects that the regions which are bulge-dominated have smaller values, while the rotation-supported regions where the disk is dominant have larger values. This is indeed what we observe in the 2D map and it is further confirmed in the next Section, where we compare our – and – correlations with those inferred from hydrodynamical simulations.
We note that none of the previous 3D measurements of galaxies have performed the same kinematical diagnostic as the one above. However, more standard rotation and dispersion 2D maps of the LOSVD of NGC 4697, like the ones derived from the ATLAS3D survey, are fully consistent with the ones presented here, although with a lower spatial resolution and over a smaller FOV (ATLAS3D covers arcsec, Krajnović et al. 2011). We do not directly compare our 2D maps to those obtained by ATLAS3D because of the different spatial and spectral resolution but in Section 3.5 we extract 1D profiles along the major axis and compare our kinematics profiles against the ATLAS3Dones.
Finally, extended 2D kinematical maps up to of this galaxy were recently presented as part of the SLUGGS Survey (Arnold et al. 2014). Overall there is a fair agreement on the features observed in the data, both in the velocity field and in the higher-order moments of the LOSVD. In fact, based on their more spatially-extended kinematic map, the SLUGGS team concluded that the fast rotation is due to an embedded disk with a rotation amplitude clearly declining with radius. The presence of a disk is also found from our detailed analysis of the and – diagrams.
3.4 Comparison with simulations
– and – correlations have also been predicted in simulations of disk merging (Naab, Jesseit & Burkert 2006, H+09 and N+14). For instance, N+14 linked the present day central kinematic properties of galaxies to their individual cosmological formation histories and showed that galaxy mergers (major and minor) have a significant influence on the rotation properties, resulting in both a spin-down and a spin-up of the merger remnants, and in a clear anti-correlation between and .
N+14 have defined six classes (named with letters from A to F) with different evolutionary paths and histories of mass assembly that can be directly linked to their 2D kinematic maps and the present day shapes. The galaxies groupings are based on the 2D kinematic maps and on the so-called ‘spin’ parameter (), a proxy for the projected angular momentum per unit mass (Emsellem et al. 2007, 2011).
The parameter has been used to show that, within the effective radius, a dichotomy exists between ‘fast-’ () and ‘slow-’ () rotators (Emsellem et al. 2007). The second class of galaxies shows little or no rotation, significant misalignment between the photometric and the kinematic axes, and contains kinematically decoupled components, whereas the first class exhibits regular stellar velocity fields, consistent with disk-like rotation and sometimes bars. This version of the ‘spin’ parameter takes the form:
| (1) |
where , , and are the flux, circular radius, velocity and velocity dispersion of the i-th spatial bin, with the sum running over the bins.
A revised and more accurate separation of these two classes of galaxies has been proposed by Emsellem et al. (2011) to include the associated apparent ellipticity: a higher value of the specific stellar angular momentum is expected for galaxies which are more flattened or closer to edge-on if these are all intrinsically fast rotators555A galaxy with a relatively low value of , e.g., of 0.2, may be consistent with a simple spheroidal axisymmetric system viewed at a high inclination (near face-on), but this is true only if its ellipticity is correspondingly low (e.g., ). A large ellipticity would instead imply a more extreme object (in terms of orbital structure or anisotropy)..
The threshold for was fixed to be proportional to square-root of with a scaling parameter that depends on the aperture (see Appendix B in Emsellem et al. 2011 for further details). For instance, at
| (2) |
Following this classification, NGC 4697 was previously classified as “fast-rotator”. This means that, given an ellipticity of (Peletier et al. 1990), one expects for this parameter a value of (for ). We find , confirming the classification of this galaxy as a ‘fast-rotator’ and in perfect agreement with the ATLAS3Dresult (, Emsellem et al. 2011).
Fast-rotators belong to class A, B and D in the N+14 classifications. However only the first two groups of galaxies will result in and distributions similar to that we observe in NGC 4697. Both groups (A and B) of galaxies are rotationally supported, had a significant amount of central in-situ, dissipative, star formation but, while class A have late assembly histories dominated by minor mergers, class B galaxies have gone through a late gas-rich major merger. These two formation scenarios will produce the same – anti-correlation that we observe in our maps.
One way to distinguish between the two classes is to look at the profiles: class A galaxies show peaked profiles within the effective radius, originating from the fast rotating central stellar disk, whereas class B galaxies have profiles constantly rising beyond the effective radius.
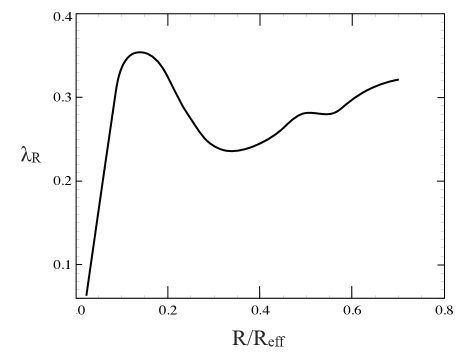
In Figure 4 we plot the profile as a function of radius calculated from circular apertures. The profile has a strong peak around and then it rises until , which suggests that the mass assembly of NGC 4697 has involved significant in-situ star formation, that NGC 4697 has experienced several gas-rich minor mergers (like simulated galaxies of class A) and possibly a late gas-rich major merger leaving a previously rapidly rotating system unchanged (like simulated galaxies of class B). However given the poor resolution of the simulations this interpretation should be taken with caution (Fig.5 in N+15 shows the profiles of the simulated galaxies in the six classes and only one galaxy of class A shows a peak, which is at . On the other hand we observe that in Fig.5 of Emsellem et al. 2011, showing for the full ATLAS3D sample, several fast-rotators show a profile similar to what we derive for NGC 4697). Moreover, Coccato et al. (2009) derived the profile for NGC 4697 out to based on planetary nebulae (PNe) and showed that it flattens out at which supports the idea that NGC 4697 should be compared with simulated galaxies of class A. We also note that Arnold et al. (2014) concluded that galaxies like NGC 4697 formed through rapid, dissipative processes, which formed the central regions, followed by a prolonged period of dry minor mergers. We cannot exclude the scenario of gas-rich late major mergers, but independent lines of evidence point toward a scenario where the mass assembly of NGC 4697 is dominated by minor mergers and gradual dissipation.

In Figure 5 we show the – and – correlations derived from the 2D kinematic maps (left panels), and we compare them to luminosity contours derived by H+09 for a 1:1 disk–disk merger with 30% gas fraction (middle panels) and from the cosmological hydrodynamical simulations of N+14 (class A and class B, right panels). A good agreement, at least on a qualitative level, is found between data and simulations, although we caution that H+09 only considered the case of equal-mass mergers.
VIMOS data-points are color coded in accord with their value of , calculated with respect to the galaxy minor kinematical axis. We find a clear correlation between the values and the regions where the disk component is elongated. Points oriented near the major axis (i.e., ) have also higher absolute values of and therefore are associated with the rotation-supported structure. Similarly, points with higher values of have lower and roughly correspond to the bulge region. The does not show a similar (anti-)correlation with .
The – anti-correlation generically tracse cold disks. It is a feature that naturally emerges in disk-disk gas-rich mergers, and tends to produce large asymmetric deviations from Gaussianity because of the presence of sub-components that retain a memory of the disk-star streaming, and because of gas that settles down through dissipation to form a thin embedded disk. This – correlation is generally negative when the dominant orbit population tends to stream (e.g. z-tube orbits, see also Röttgers, Naab & Oser 2014), and positive when the rotation is caused by sub-dominant streaming population (e.g. x-tube orbits) superimposed on the tail of the dominant streaming orbits (e.g z-tubes which still contribute some rotation along the minor axis; see also the discussion in H+09). The same features are not found in second generations of major (re-)mergers (mergers at lower redshift, where less cold gas is present and with elliptical-morphology progenitors), in which case the features are more mixed and look more concentrated around the center of the diagram.
The – correlation of NGC 4697 in Figure 5 shows a V-shaped distribution
with a double peak at .
This distribution is very similar to the predictions from simulations of N+14 (right, bottom panel)
and it also agree with H+09 (middle, bottom panel), although there is a significant
offset between the data and the H+09 predictions.
The peaked population could correspond to a late-formed disk stars (note the correspondence to the extreme
values and indicating the alignment along the major axis) which tend to produce a positive
in superposition with the more isotropic component (differences in ages of the two components
are discussed in Sec. 4).
In the simulations of H+09 the re-mergers would look more concentrated around the origin and would
tend to have LOSVDs with positive , similarly to expectations from violent relaxation,
which generally results in a radially-biased distribution function (Binney & Tremaine 2008).
To conclude, the high-order moments of the LOSVD provide kinematical evidence
for a two-component system:
the largest absolute values of and
indicate an area of the galaxy with the dominance of x-tube over z-tube orbits, which are produced in
collisionless mergers and trace the presence of a (later) streaming structure,
these are also the regions around (minor axis).
Values with and indicate instead the presence of a non rotating subsystem
that dominates in the regions where the values of are higher.
The – and the peaked profile suggest that gas-rich minor mergers
dominate the mass assembly of NGC 4697, although we cannot completely exclude the possibility of a
major merger event that happened at redshift .
We make use of this evidence in Section 4.1 where, based on the photometry of NGC 4697, we separate the disk from the bulge and study the ages and metal abundances of the stellar populations of these two components.
The details of the gas accretion leading to the formation of the central disk may be somewhat different than the one investigated in the simulation of disk merging and it might be useful to have LOSVD predictions from simulations of cold accretions as an alternative high dissipative process forming the disk. It seems evident, though, from H+09 and N+14 that dry mergers is not able to produce the kinematical substructures we see in the – – diagrams. In fact, in a merger without a dissipative gas component, the remnant galaxies are axisymmetric and do not show a population of stars with high angular momentum tube orbits nor the re-growth of a significant disk component (e.g. class D in N+14).
3.5 One dimensional spatially resolved kinematics profiles
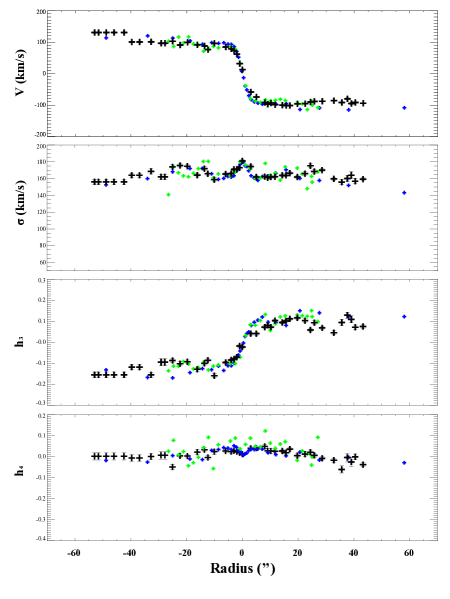
To compare our results against published results based on long-slit data and IFS with different FOV and resolution, we extract from the 2D kinematics maps the information along the major axis. Specifically, we extract and sum all the spectra positioned in a rectangle with width of (2 pixels) oriented along the major axis of the galaxy and centered on our kinematic center (to be as close as possible to the configuration of slit-based studies). We perform the same extraction for the IFU ATLAS3Dobservations (publicly available on the Survey Webpage) in order to perform a simple comparison of the two sets of data with different spatial and spectral sampling. In Figure 6 we compare our profiles (black points) with the ATLAS3Dones (green points) and with the ones published in de Lorenzi et al. (2008, hereafter DL08), derived from high S/N integrated absorption line spectra obtained by Méndez et al. (2005) with FORS2 at the VLT, a slit width of 1 arcsec and seeing 1 – 1.5 arcsec (blue points). For the major axis inclination, we assume the value PA = 63 degrees from Binney, Davies & Illingworth (1990), slightly different from the one assumed by DL08 but providing the best symmetry and maximum rotation for our extracted 1D profiles. We do not worry about this small PA discrepancy that could be caused by the fact that the slit in DL08 was not exactly on-center or could be related to the offset we found between kinematic and photometric center, most probably caused by a small effect of atmospheric refraction. For the ATLAS3D data we use the same inclination of PA = 63 degrees and extract the major axis profiles with the same procedure applied to our VIMOS data. We found an overall good agreement between the three 1D kinematical profiles which nicely demonstrates the robustness of our mosaic approach and the validity of our results.
4 2D Stellar Population Analysis
In this section we study the stellar population of the disk and of the bulge of NGC 4697 separately, to put constraints on the age, , metallicity and IMF normalization of the stellar population of the different morphological components of the galaxy.
To constrain the stellar population parameters, we focus on line-index measurements rather than full spectral fitting, which avoids issues with spectral calibration when comparing to observations that might have been poorly calibrated and we assume a simple stellar population (SSP), rather than an extended star formation history, which is still a strong assumption and will be properly addressed in future work.
We measure equivalent widths (EWs) of several stellar absorption features in each of the Voronoi-rebinned 1D spectra, after convolving them to a common resolution of to correct for kinematic broadening666This final resolution has been chosen for practical reasons: the version of the simple stellar population models used in this paper was created and used in S+14 with a resolution of . To save computer power, we did not perform again the EW measurements and simply smoothed our data to the resolution of the models. We are confident that this did not cause any loss of information, and we check (by eye-inspection) that contamination from sky line residuals do not affect the spectral features.. We compared these EWs to those measured from an extended version of the SSP models of Conroy & van Dokkum (2012a, hereafter CvD12) with the same common resolution, obtained in Spiniello, Trager & Koopmans (2014b).
CvD12 optimized models over the wavelength interval at a resolving power of R , specifically for the purpose of studying old, metal-rich stellar populations. The models are built combining two empirical stellar libraries (MILES, Sánchez-Blázquez et al. 2006; and IRTF, Cushing, Rayner & Vacca 2005) and three sets of isochrones to measure the IMF slope down to . The CvD12 models explore variations in age in the range 3–13.5 Gyr, enhancement of 0–0.4 dex, and four different single-slope IMFs: a bottom-light single-slope power law with (where is the IMF slope, using ) that produces a stellar mass-to-light ratio comparable to the one obtained from a standard Chabrier IMF (Chabrier 2003), a Salpeter (1955) IMF with a slope of , and two bottom-heavy (dwarf-rich) IMFs with slopes of and .
The CvD12 models also allow for variations in the Fe] ratio as well as variations in the abundance pattern of 11 different single elements. This is enough to decouple IMF variations from abundance variations. However, all of the CvD12 models use solar metallicity isochrones, even when synthesizing with different abundance patterns or different Fe]. The abundance variations of single elements are implemented at fixed [Fe/H], which implies that the total metallicity cannot be easily controlled. This is restrictive, if one aims to disentangle elemental enhancements, metallicity changes and IMF variations, especially in the case of massive ETGs, which have star formation histories different from the solar neighborhood (e.g., Peterson 1976; Peletier 1989; Worthey 1992; Trager et al. 2000b; Arrigoni et al. 2010).
To resolve this issue, we follow the approach presented in Spiniello, Trager & Koopmans (2015), hereafter S+15 of extending the parameter space of the SSP models using response functions. We construct a metallicity-response function for each given age and IMF slope taking the ratio between two spectra of the MIUSCAT SSP models (Vazdekis et al. 2012)777The MIUSCAT SSP has instead a fixed total metallicity and covers six metallicity bins and , where represents the solar value. with the same age and IMF slope but different total . We then multiply this response function with the spectrum of a CvD12 model with fixed age and IMF to build a new model (SSP) that extrapolates the latter model to a new part of parameter space (i.e. covering super-solar ). These modified SSP models combine the flexibility of both the MIUSCAT and CvD12 models to predict spectra in a part of parameter space that neither of them reaches separately (MIUSCAT models use different total metallicities but do not allow one to change the abundances which are fixed to solar). As pointed out in S+14 and S+15, selecting IMF-dependent features that are age- and metallicity-independent and combining them with indices that depend mainly on age or mainly on element abundance is important for breaking the age-metallicity-IMF degeneracy when using SSP models to infer the stellar populations from unresolved galaxies spectra.
We measure some of the classical blue Lick indices (e.g. H, Mg, Fe5270, Fe5335, [MgFe]: González 1993; Worthey 1994; Trager et al. 2000a) that have been extensively and successfully used in the literature to constrain the age and metallicity of galaxies, together with some of the bluer IMF-sensitive features defined and used in S+14 and S+15. Unfortunately this paper makes use of data taken with the HR-blue grism, and therefore only covers the bluer IMF-features of S+14 (specifically bTiO, aTiO, TiO1) while in the future we plan to obtain new data using the HR-red grism which will cover also TiO2, CaH1, TiO3 and TiO4, allowing a more detailed analysis and a more secure inference on the low-mass end of the IMF slope.
Before measuring EWs, we convolved galaxy and model spectra to an effective velocity dispersion of to correct for kinematic broadening. Indices in both the galaxy and the model spectra have been measured with the same definitions and methods888We use the code SPINDEX from Trager, Faber & Dressler (2008).. We do not place our indices on the zero-point system of the Lick indices and quote them as index strengths in units of angstrom (if atomic) or magnitudes (if molecular, like the TiO lines).
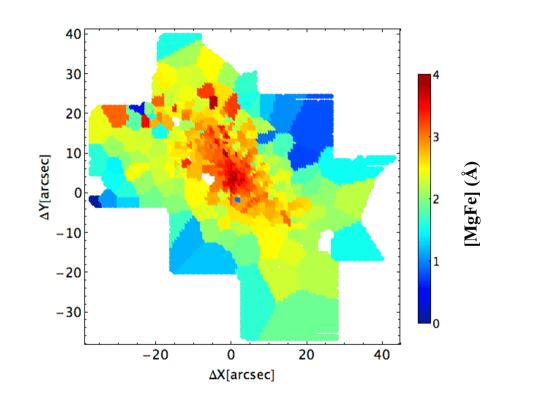
The great advantage of integral field spectroscopy is the simultaneous availability of spatial and spectral information. This allows us to generate 2D spatial maps of spectral features of interest, like the one in Figure 7, showing the [MgFe]999[MgFe] = , (González 1993) index that has been widely used to constrain the metallicity. The 2D map suggests different stellar populations in the bulge and in the disk: specifically, the [MgFe] EWs are systematically higher in the Voronoi cells within the disk. Therefore, the 2D element maps indicate that the stars in the disk are more metal-rich than the stars in the bulge. However, we caution the reader that it is not possible to directly infer the total metallicity by looking at a single-element map, because of the degeneracies present between the stellar population parameters. For instance, in this case the [MgFe] values could be higher due to an increase of age and/or could increase of total metallicity. This is an example of the so-called age-metallicity degeneracy which can be broken by using more than one indicator. This motivates us to decompose the bulge and disk components and to extract a 1D spectrum of each of them in order to study their stellar populations separately through a more quantitative, proper SSP analysis.
4.1 Disk-Bulge decomposition
We perform a two-component fit to the HST V-band image of NGC 4697 obtained by Tal et al. (2009), driven by the correlations in the and parameters versus that clearly indicate the presence of a disk. We use the latest version of GALFIT (Peng et al. 2010) to fit two ellipsoid models (‘sersic’ for the bulge and ‘expdisk’ for the disk) to the light profiles of the galaxy image. We obtain a similar position angle (PA deg, confirming previous findings) but very different axis-ratios for the two components: , . We use those to spectroscopically separate the bulge from the disk. We note that a more rigorous spectroscopic separation, following the approach of Coccato et al. (2011) and Coccato, Iodice & Arnaboldi (2014), will be performed in future studies to fully separate these two components.
First, we extract and sum together all the spectra in the datacube with . In this central region we expect bulge and disk to both contribute substantially. Second, we select and sum the spectra belonging to an elliptical anulus centered on the kinematics center with the axis-ratio and PA found by GALFIT for the disk: , deg and with (to exclude the central region). Finally, we sum up the remaining spectra where the contribution of the bulge is dominant. The resulting 1D spectra have very high S/N ( for center, disk and bulge respectively).
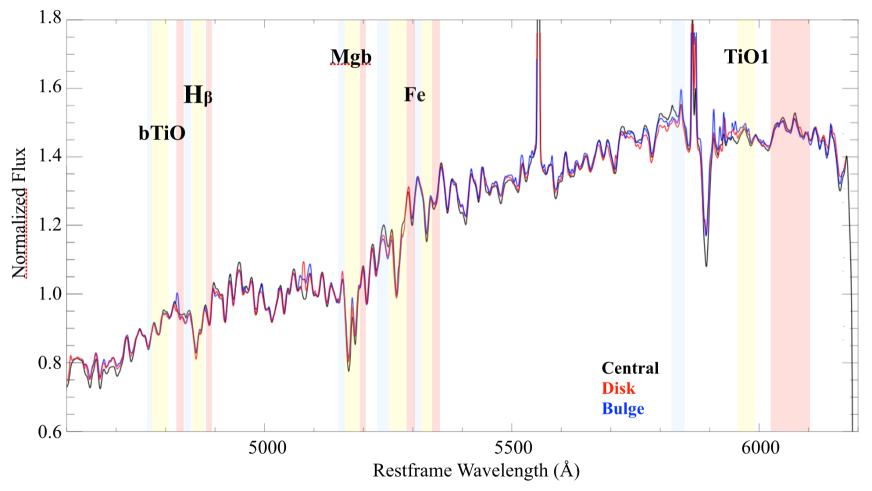
In Figure 8 we show the extracted 1D spectra of the disk and bulge, as well as of the mixed (diskbulge) population of the central region of NGC 4697 for comparison. Shaded yellow bands show some of the line indices used in this work, along with continuum side-bands (blue and red colored bands). Some small differences are visible already from the spectra: the disk spectrum shows stronger Mg and Fe lines, which confirms what have already seen from the [MgFe] 2D map and gives hints of a more metal-rich population. The NaD absorption line, the narrow strong line around 5900 Åis stronger in the bulge than in the disk, consistent with the hypothesis that bulges could be Na-enhanced (e.g. in the bulge of the Milky Way, on average [Na/Fe] , Fulbright, McWilliam & Rich 2007). However, we do not use this particular line in the following analysis because its blue band is heavily contaminated from emission sky-lines and because of the recent finding presented in S+15 showing that the NaD lines are model dependent and therefore must be interpreted with caution. The aTiO index has also been excluded from the analysis because it is contaminated from emission sky-lines.
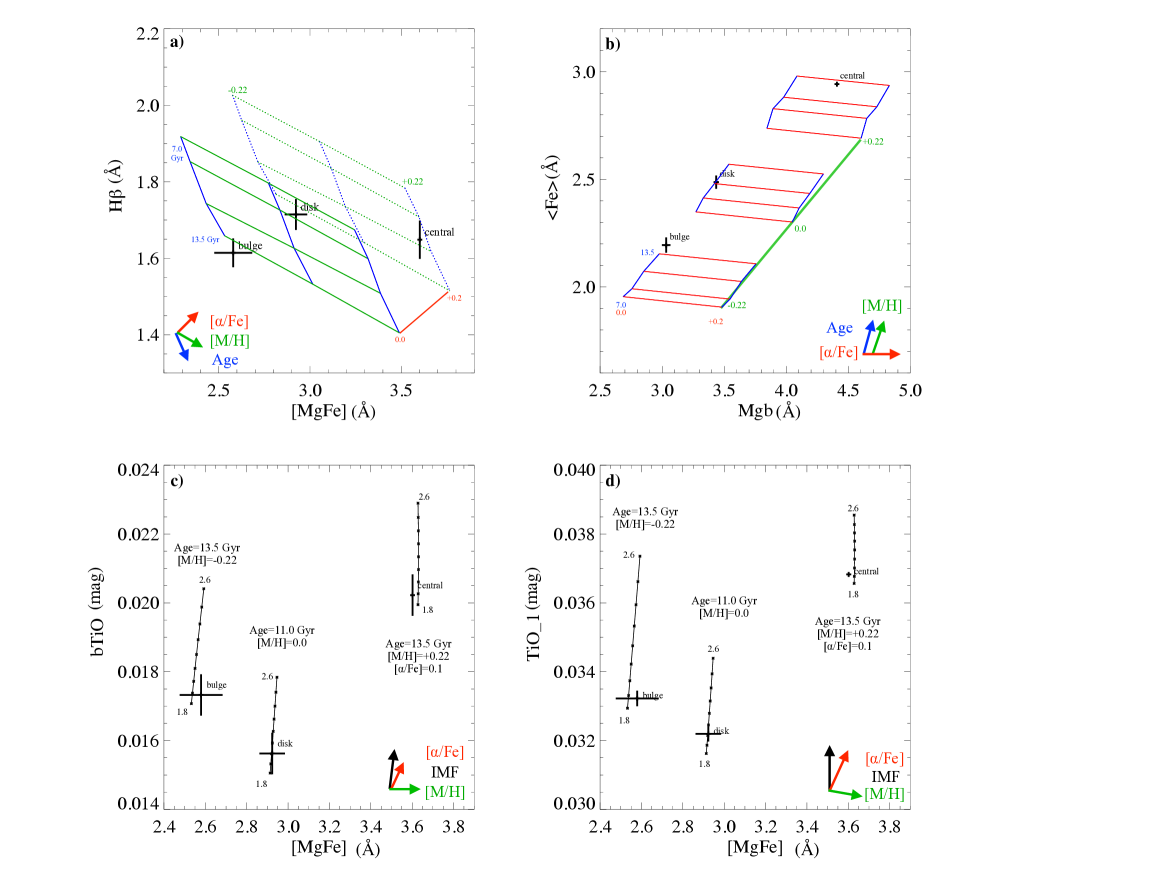
In Figure 9 we show index-index plots of the selected optical indicators to provide qualitative constraints on the stellar population parameters. In panels a) and b) the IMF dependence is minimal and the age and abundances of the galaxy can be inferred. The IMF normalization of the galaxy can be instead inferred from panels c) and d), using SSP models with the metallicity and age previously determined.
4.2 Age and metallicity of the stellar population
In the upper panel of Figure 9 we show index-index diagrams of some of the classical Lick-indices. These diagrams are widely used to constrain age and metallicity of integrated stellar populations. The average indices extracted from the different regions are plotted on top of grids of CvD12 SSP models with varying ages (blue lines, [7,9,11,13.5] Gyr), (red lines, [0.0, 0.2, 0.4] dex) and total metallicity (green lines, [-0.22, 0.0, +0.22]). All plotted models have a Chabrier-like IMF, but for these indicators (H, Mg, Fe5270, Fe5335) the dependency on IMF is minimal.
Panel a) of Figure 9 shows the H–[MgFe] diagram. The H index is one of the most used age-indicators in the optical, and allows one to break the age-metallicity degeneracy, when combined with the commonly-used [MgFe] index. However, this diagram alone does not allow one to also break degeneracies with . This is clear for instance in the case of the disk component. From panel a) it is inferred that the bulge has an old population with solar and slightly sub-solar metallicity. The central region is also old but has super-solar abundances. For the disk the interpretation is somewhat more difficult. In fact, the disk spectrum matches a model with age Gyr, slightly super-solar metallicity and solar but also a model with older age, lower metallicity and -enhanced. To discriminate between these two possibilities, the reader should refer to the results plotted in panel b). Panel b) shows versus , which is the mean of Fe5270 and Fe5335. Here the disk matches only with a model with age Gyr, solar metallicity and solar .
Index-index plots are a useful tool to give qualitative inference on the stellar population parameters, but it is sometimes hard to break degeneracies and quantitatively constrain age, metal abundance and IMF slope at the same time. Therefore, in order to give more quantitative constraints on the stellar population parameters of the three components, we perform a minimization comparing the 1D spectrum of each component with grids of linearly interpolated SSPs spanning a range of ages (between 7 and 13.5 Gyr with steps of 1 Gyr,), (between −0.2 and +0.4 dex, with a step of 0.1 dex), and total metallicity ([M/H]=[-0.22,0.0,+0.22]) for a Chabrier IMF (we note that a moderate change in the IMF slope has only a negligible effect on these blue features). We find that the disk is slightly younger and more metal-rich than the bulge, consistent with a SSP model of Gyr, solar total metallicity ([M/H]=) and solar (). The bulge fits better with a Gyr model with sub-solar metallicity ([M/H]) and solar (). The central region shows stellar population properties in between those of the disk and those of the bulge, as expected. It is as old as the bulge ( Gyr), shows a solar or slightly super solar () and it is even more metal enriched ([M/H]=). These SSP results nicely confirm the qualitative picture obtained via index-index plots in the upper row of Figure 9, and are summarized in Tab. 1. However, we note that since the 1D spectra of bulge and disk are composite spectra where the contributions of the two components are not perfectly disentangled, the true stellar population differences are likely to be even greater.
| Component | Age (Gyr) | [M/H] | [/Fe] |
|---|---|---|---|
| Central | |||
| Bulge | |||
| Disk |
Finally we consider NGC 4697 as whole and calculate gradients in its stellar populations. Following the approach of Tortora et al. (2010a), we define the stellar population gradient as the dimensionless coefficient of the relation
| (3) |
where X represents the age or the total metallicity expressed in terms of [M/H]. We find a non negligible but very small age gradient and a negative metallicity gradient in the sense that NGC 4697 is more metal-rich and older in the center. These gradients are consistent with the measured gradients in old early-type galaxies (Kuntschner et al. 2010; Tortora et al. 2010a) and with remnants of gas-rich major mergers from simulations (e.g. Hopkins et al. 2009, H+09).
4.3 The IMF normalization
Using the metallicity and age constraints obtained from the Lick blue indices via the minimization, we focus now on two of the IMF-sensitive optical indicators that fall in the VIMOS wavelength range, the bTiO and the TiO1. We plot them against the [Mg/Fe] index in the lower panels of Figure 9. The combination of the latter indicator with IMF-sensitive features breaks the degeneracies between the , total metallicity and IMF slope variations.
For each component, we use SSP models with varying IMF slope (x between 1.8 and 2.5) and , and with the other stellar population parameters as close as possible to the ones derived from the fit to the blue indices. For the bulge, we use SSP models with 13.5 Gyr and [M/H] = -0.22, for the disk we use a SSP models with 11.0 Gyr and [M/H] = 0.0 (solar). Finally, for the mixed, central population we use SSP models with 13.5 Gyr and [M/H] =+0.22 (super-solar).
In Figure 9 black lines show models with different IMF slopes and red lines show models with varying . No detectable variation in the IMF normalization between bulge and disk is visible from the two panels. Both components of NGC 4697, as well as the central region, are consistent with a normalization of , slightly dwarf richer than a Chabrier IMF (x=1.8, still consistent within 1-sigma) but shallower than a Salpeter (x=2.35), which is perfectly consistent with the slope predicted from the IMF– relation (e.g., La Barbera et al. 2013; Tortora, Romanowsky & Napolitano 2013; S+14) for an ETG with . IMF normalization does not change with radius for this galaxy is consistent with the results found in Martín-Navarro et al. (2015). The lack of IMF spatial gradient is also consistent with the results on the low-mass system in Martín-Navarro et al. (2015) that shows an IMF normalization constant with radius and consistent with a Kroupa-like profile.
4.4 Linking kinematics and stellar populations
The main conclusion from the stellar population analysis is that the inner region (typically ) looks coeval (or a bit older) and more metal-rich than the regions farther out, which suggests that this central region has been formed early via rapid collapse. However, from the stellar population analysis alone, we cannot exclude minor or major merging of late-type disk galaxies, which have destroyed spiral arm features and left a younger disk component. It is therefore necessary to connect and correlate the stellar population results with those on the spatially resolved kinematics.
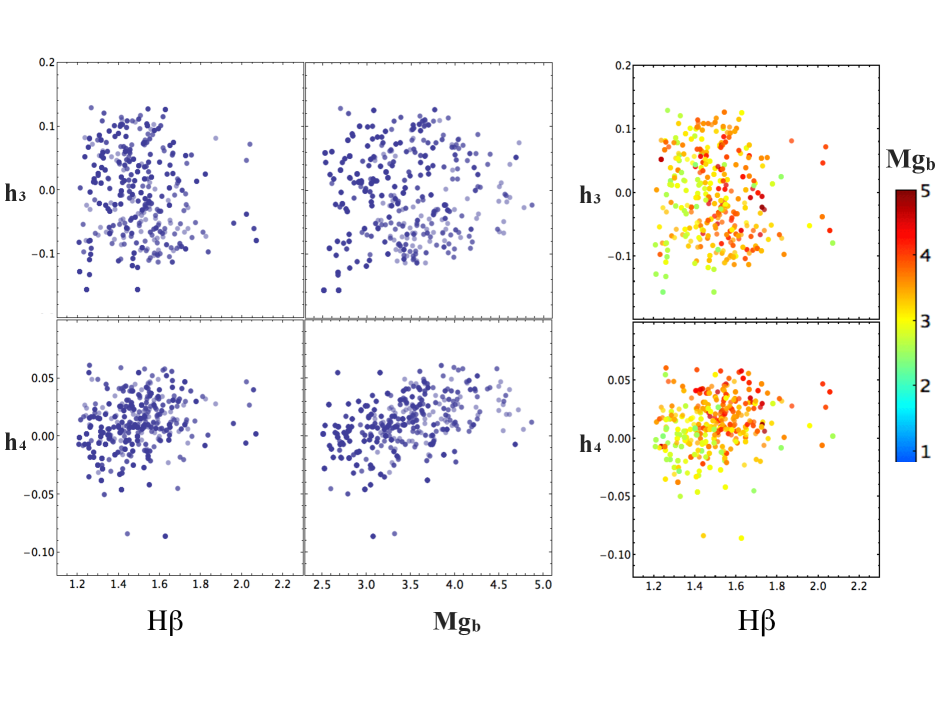
The SAURON team (Kuntschner et al. 2006; Krajnović et al. 2008) have found that the fast-rotating component almost always features a higher metallicity compared to the galaxy as a whole. They have attributed this to the presence of a later-forming stellar population in a rotating structure with disk-like kinematics (Kuntschner et al. 2010). From the NGC 4697 2D maps as well as from the stellar population analysis presented in this study, we infer the same scenario. This is demonstrated inFigure 10, which shows the correlation between the (top panels) and the (bottom panels) parameters and the H (left) and Mg (middle) values obtained from the smoothed 2D maps. We run a Spearman test on these relations to better quantify the statistical dependence between the high-order moments of the LOSVD and H and Mg respectively. The resulting Spearman rank correlation coefficients are () and () for () and H and Mg respectively. Given the big sample size (more than 100 points), these values of all exceed the critical value () and therefore the relations are statistically significant, although not strong.
The right panels of Figure 10 shows the H – (top panel) and – (bottom panel) diagrams with the points color-coded according to the Mg values. Although the discussion must be kept on a qualitative level because of the well-known age-metallicity degeneracy (Worthey 1994), we can simplify the situation and say that larger H values indicate younger ages and larger Mg values indicate higher total metallicity. Thus we can conclude that points with , tracing the later-formed disk, are slightly younger and more metal rich, while points with , roughly tracing the bulge component because they are along the minor axis of NGC 4697, all have generally older age and lower metallicity. The same holds also for points with larger , although in this case the relations are less robust.
Remarkably, the spatially resolved stellar population results perfectly agree (on a qualitative level at least) with the spatially resolved kinematics results. Unfortunately none of the hydrodynamical simulations derive 2D detailed stellar population properties. In the future, it might be extremely useful to have predictions from simulations on the ages and metal abundances of the remnant of different mergers scenarios.
In the SAURON ETGs of low to intermediate mass (– ), the region of increased metallicity is connected to a mild decrease of the , whereas in more massive galaxies ( ) the disk formation and increased metallicity is typically constrained to a central location involving only a minor fraction of the total mass of the galaxy and only in about 25 per cent of the cases also a central depression in can be seen.
In the case of NGC 4697, we find that the central region is slightly enhanced with respect to the bulge, whereas the disk shows roughly the same [/Fe] as the bulge. A larger metallicity associated with the fast rotating component, seems to point toward a formation scenario where fast rotator galaxies have undergone one or multiple periods of secondary star-formation at a later stage and over longer timescales and therefore resulted in an increased metallicity and a decrease of the abundance ratio in a disk-like structure (Kuntschner et al. 2010).
A younger and more metal-rich disk is also well consistent with the scenario suggested by the gas-rich merger (e.g. H+09), as the younger disk would arise when the gas, retaining its angular momentum during the merger, is fueled in the center of the remnant and eventually turns into stars. In Section 3.3 we have demonstrated that this same scenario is also perfectly able to explain the kinematical substructures.
We note here that the disk merging scenario does not necessarily imply major merging, as also merging with lower mass fraction can produce similar kinematical features. In fact, simulations in N+14 have shown that correlations similar to the ones we observe in the and parameters of NGC 4697 can originate from two galaxy formation scenarios: a late gas-rich major merger or in situ star formation plus minor merging.
In conclusion, the combination of the kinematical features and the stellar population properties seem to point to the scenario where some fast rotating and disky ellipticals can have formed from dissipative (wet) mergers of disk galaxies.
5 Discussion and conclusions
In this paper, we have presented high S/N integral field kinematics and stellar population combined analysis of the elliptical galaxy NGC 4697, an almost edge-on, intermediate luminosity () isolated elliptical galaxy. We used a mosaic approach, the first of its kind with VIMOS IFU data, obtaining 2D maps of stellar kinematics and absorption lines up to 0.7. The final effective field-of-view of allowed up to obtain one among the largest 2D kinematical maps ever measured for a single early-type galaxy (in terms of arcsec) providing a unique view on the internal structure of the system, as well as crucial morphological and dynamical information.
Our main scientific findings are the following:
-
i)
We have measured the 2D velocity moments of the galaxy’s stellar population finding clear evidence for a rotation-supported structure along the major axis from the rotation velocity and the third Gauss-Hermite coefficient (representing the skewness). We have measured the “spin-parameter” () confirming the classification of this system as ‘fast-rotator’.
-
ii)
We have analyzed the correlations between the and parameters with (Fig. 3), together with the spatial profile, demonstrating how these characterize the different kinematical components (bulge and disk) of the galaxy.
-
iii)
We have directly compared these correlations with those predicted by hydrodynamical simulations of Hoffman et al. (2009) from gas-rich disk-disk major mergers with a 30% gas fraction and of Naab et al. (2014) for gas-rich minor and major mergers (class A and B). The correlations we presented closely resemble the theoretical predictions and indicate that the mass assembly of NGC 4697 is dominated by gas-rich minor mergers, gradual dissipation plus possibly a late gas-rich major merger.
-
iv)
A direct comparison with 1D long-slit spectroscopy (de Lorenzi et al. 2008) shows an overall good agreement between the different kinematics results along the major axis.
-
v)
We extracted 1D spectra of the disk and the bulge of NGC 4697, using a two-components fit to a deep V-band image.
-
vi)
We studied the stellar populations of these two components using SSP models. We find indications that the stars in the disk are Gyr younger and more metal rich that the stars in the bulge.
-
vii)
We linked the stellar population analysis and the internal kinematics of the system by correlating age and metallicity of the stellar populations of the two components with the and the kinematic parameters, finding further evidence for a significant in-situ formation of stars since with additional gas-rich minor mergers (although we do not exclude the possibility of a late major-merger that left a previously rapidly rotating system unchanged).
-
viii)
From the two bluer IMF-sensitive optical indicators of S+14, which fall in the VIMOS wavelength range, we do not detect any difference in the IMF slope between the bulge and the disk. Both components are consistent with an IMF with a single power slope of =2.0, consistent with a Kroupa IMF and slightly lighter than a Salpeter-like IMF. The inferred IMF slope is perfectly consistent with the one predicted from the IMF– relation for an ETG with , such as NGC 4697 (Conroy & van Dokkum 2012; La Barbera et al. 2013; Treu et al. 2010; Tortora, Romanowsky & Napolitano 2013; Tortora et al. 2014b, S+14).
The absolute novelty of this work resides: i) on the depth and width of the data acquired as we have very high spectra over a an effective area of the sky of (e.g. larger than MUSE FOV); ii) on the presentation of a detailed spatially resolved kinematical and population 2D analysis within the central effective radius, which has allowed us to cross-correlate LOSVD information (i.e. and ) with relevant line indices (e.g. vs. H and Mg in Figure 10), showing that points with , associate mainly to the later-formed disk, are younger and more metal rich, while points with , roughly tracing the bulge component because aligned with the minor axis of NGC 4697, all have generally a smaller H and smaller [M/H].
The emerging picture is that a later formed disk has been built from pre-enriched gas that formed stars after having dissipatively sunk into the center. This is well consistent with the scenario suggested by gas-rich disk merging simulations (e.g. H+09), as the younger disk would arise when the gas, retaining its angular momentum during the merger, is fueled in the center of the remnant and eventually turns into stars. It is remarkable that within this scenario, photometry, stellar population features and kinematical features like the - and - correlations are all qualitatively correctly predicted. We stress again that H+09 only considers 1:1 disk-disk merger but that also merging with lower mass fraction (minor mergers) can produce similar kinematical features (e.g. N+14). Furthermore other mechanisms involving a rapid dissipative collapse of enriched gas (clumpy disks, violent relaxation, cold accretion), might have produced a similar galaxy component.
This paper is intended as a pilot program for a large project that aims at the study of internal structure, mass distribution and stellar population of a sample of nearby ETGs. With medium-high signal-to-noise spatially resolved spectra, we will perform a detailed 2D study of the stellar population via line-index measurements and try to further test possible variation in the IMF normalization. We will attempt to characterize the low-mass end of Initial Mass Function normalization in the bulge and in the disk components by measuring EWs of the IMF-sensitive features defined in S+14. In order to achieve this result we plan to change the configuration of VIMOS in the new observations, choosing a redder filter (HR-red) to cover the proper wavelength range101010We are aware that moving to the red filter will cause the loss of some of the blue indices covered in this paper, making age determination more complex. We therefore plan to select ETGs where measurements of age and metallicity are available from the literature and mainly focus on measuring gravity-sensitive features to study the possible spatially variation of the IMF slope, with particular regard on bulge versus disk dominated zones.. In addition to a direct measurement of the stellar mass-to-light ratios (M⋆/L), thanks to the 2D IF coverage, we will be able to study age and metallicity radial gradients for our systems. Moreover, where spatial gradients in the stellar population parameters are present, the assumption of a spatially-constant (M⋆/L) clearly does not work. Consequently, the 2D coverage, allowing a more accurate measure of the (M⋆/L), also permits a more accurate and complete dynamical analysis (e.g., Tortora et al. 2010b, 2011).
A quantitative dynamical model to fit the whole 2D maps for the rotation and the velocity dispersion, is out of the purpose of this paper but will be performed in future work. Only with a complete 2D kinematical map of a galaxy (up to at least ) as well as a robust dynamical model it will be possible to measure the DM fraction, trace its radial distribution as a function of the mass of the halo, and test plausible environment dependencies. In future work we therefore plan to perform a detailed study of the stellar content of ETGs to combine spatially resolved stellar information on the central region with planetary nebula data on the outskirts (up to ) with the final purpose of obtaining the complete rotation curve and distribution of dark matter (e.g. Napolitano et al. 2009, 2011).
Moreover, thanks to a complete and detailed dynamical analysis, we will have a completely independent measurement of the IMF slope that we will compare to the one obtained by stellar population modeling. If both methods agree on the resulting IMF, this will be a strong test of the absence of hidden systematics.
Acknowledgments
The use of the Penalized Pixel Fitting developed by Cappellari & Emsellem is gratefully acknowledged. Data were reduced using EsoRex and XSH pipeline by ESO Data Flow System Group. C.S. thanks S.C. Trager for the use of the code SPINDEX2 and C. Conroy for the precious help in understanding and using his stellar population models. C.T. has received funding from the European Union Seventh Framework Programme (FP7/2007-2013) under grant agreement n. 267251. We thank the referee for very constructive comments.
References
- Arnold et al. (2014) Arnold J. A. et al., 2014, ApJ, 791, 80
- Arrigoni et al. (2010) Arrigoni M., Trager S. C., Somerville R. S., Gibson B. K., 2010, MNRAS, 402, 173
- Bacon et al. (2001) Bacon R. et al., 2001, MNRAS, 326, 23
- Barnes & Hernquist (1996) Barnes J. E., Hernquist L., 1996, ApJ, 471, 115
- Bender, Saglia & Gerhard (1994) Bender R., Saglia R. P., Gerhard O. E., 1994, MNRAS, 269, 785
- Bertola & Capaccioli (1975) Bertola F., Capaccioli M., 1975, ApJ, 200, 439
- Binney & Tremaine (2008) Binney J., Tremaine S., 2008, Galactic Dynamics: Second Edition. Princeton University Press
- Binney, Davies & Illingworth (1990) Binney J. J., Davies R. L., Illingworth G. D., 1990, ApJ, 361, 78
- Brodie et al. (2014) Brodie J. P. et al., 2014, ApJ, 796, 52
- Cappellari et al. (2006) Cappellari M. et al., 2006, MNRAS, 366, 1126
- Cappellari & Copin (2003) Cappellari M., Copin Y., 2003, MNRAS, 342, 345
- Cappellari & Emsellem (2004) Cappellari M., Emsellem E., 2004, PASP, 116, 138
- Cappellari et al. (2011) Cappellari M. et al., 2011, MNRAS, 413, 813
- Cappellari et al. (2012) —, 2012, Nature, 484, 485
- Cappellari et al. (2013) —, 2013, MNRAS, 432, 1862
- Chabrier (2003) Chabrier G., 2003, PASP, 115, 763
- Coccato et al. (2009) Coccato L. et al., 2009, MNRAS, 394, 1249
- Coccato, Iodice & Arnaboldi (2014) Coccato L., Iodice E., Arnaboldi M., 2014, A&A, 569, A83
- Coccato et al. (2011) Coccato L., Morelli L., Corsini E. M., Buson L., Pizzella A., Vergani D., Bertola F., 2011, MNRAS, 412, L113
- Conroy & van Dokkum (2012) Conroy C., van Dokkum P. G., 2012, ApJ, 760, 71
- Covone & Napolitano (2004) Covone G., Napolitano N. R., 2004, Astronomische Nachrichten, 325, 104
- Cushing, Rayner & Vacca (2005) Cushing M. C., Rayner J. T., Vacca W. D., 2005, ApJ, 623, 1115
- Czoske et al. (2008) Czoske O., Barnabè M., Koopmans L. V. E., Treu T., Bolton A. S., 2008, MNRAS, 384, 987
- de Lorenzi et al. (2008) de Lorenzi F., Gerhard O., Saglia R. P., Sambhus N., Debattista V. P., Pannella M., Méndez R. H., 2008, MNRAS, 385, 1729
- Dejonghe et al. (1996) Dejonghe H., de Bruyne V., Vauterin P., Zeilinger W. W., 1996, A&A, 306, 363
- Douglas et al. (2007) Douglas N. G. et al., 2007, ApJ, 664, 257
- Dutton et al. (2013a) Dutton A. A. et al., 2013a, MNRAS, 428, 3183
- Dutton et al. (2013b) —, 2013b, MNRAS, 428, 3183
- Emsellem et al. (2011) Emsellem E. et al., 2011, MNRAS, 414, 888
- Emsellem et al. (2007) —, 2007, MNRAS, 379, 401
- Falcón-Barroso et al. (2011) Falcón-Barroso J., Sánchez-Blázquez P., Vazdekis A., Ricciardelli E., Cardiel N., Cenarro A. J., Gorgas J., Peletier R. F., 2011, A&A, 532, A95
- Fogarty et al. (2014) Fogarty L. M. R. et al., 2014, MNRAS, 443, 485
- Fulbright, McWilliam & Rich (2007) Fulbright J. P., McWilliam A., Rich R. M., 2007, ApJ, 661, 1152
- González (1993) González J. J., 1993, PhD thesis, University of California, Santa Cruz
- González Delgado et al. (2014) González Delgado R. M. et al., 2014, A&A, 562, A47
- Hill et al. (2008) Hill G. J. et al., 2008, in Society of Photo-Optical Instrumentation Engineers (SPIE) Conference Series, Vol. 7014, Society of Photo-Optical Instrumentation Engineers (SPIE) Conference Series
- Hoffman et al. (2009) Hoffman L., Cox T. J., Dutta S., Hernquist L., 2009, ApJ, 705, 920
- Hopkins et al. (2009) Hopkins P. F., Hernquist L., Cox T. J., Keres D., Wuyts S., 2009, ApJ, 691, 1424
- Krajnović et al. (2008) Krajnović D. et al., 2008, MNRAS, 390, 93
- Krajnović et al. (2011) —, 2011, MNRAS, 414, 2923
- Kuntschner et al. (2006) Kuntschner H. et al., 2006, MNRAS, 369, 497
- Kuntschner et al. (2010) —, 2010, MNRAS, 408, 97
- La Barbera et al. (2013) La Barbera F., Ferreras I., Vazdekis A., de la Rosa I. G., de Carvalho R. R., Trevisan M., Falcón-Barroso J., Ricciardelli E., 2013, MNRAS, 433, 3017
- Lauer et al. (1995) Lauer T. R. et al., 1995, AJ, 110, 2622
- Law & MaNGA Team (2014) Law D. R., MaNGA Team, 2014, in American Astronomical Society Meeting Abstracts, Vol. 223, American Astronomical Society Meeting Abstracts #223, p. 254.31
- Martín-Navarro et al. (2015) Martín-Navarro I., Barbera F. L., Vazdekis A., Falcón-Barroso J., Ferreras I., 2015, MNRAS, 447, 1033
- Méndez et al. (2001) Méndez R. H., Riffeser A., Kudritzki R.-P., Matthias M., Freeman K. C., Arnaboldi M., Capaccioli M., Gerhard O. E., 2001, ApJ, 563, 135
- Méndez et al. (2009) Méndez R. H., Teodorescu A. M., Kudritzki R.-P., Burkert A., 2009, ApJ, 691, 228
- Méndez et al. (2005) Méndez R. H., Thomas D., Saglia R. P., Maraston C., Kudritzki R. P., Bender R., 2005, ApJ, 627, 767
- Milgrom (1983a) Milgrom M., 1983a, ApJ, 270, 371
- Milgrom (1983b) —, 1983b, ApJ, 270, 365
- Naab, Jesseit & Burkert (2006) Naab T., Jesseit R., Burkert A., 2006, MNRAS, 372, 839
- Naab, Khochfar & Burkert (2006) Naab T., Khochfar S., Burkert A., 2006, ApJ, 636, L81
- Naab et al. (2014) Naab T. et al., 2014, MNRAS, 444, 3357
- Napolitano et al. (2005) Napolitano N. R. et al., 2005, MNRAS, 357, 691
- Napolitano et al. (2011) —, 2011, MNRAS, 411, 2035
- Napolitano et al. (2009) —, 2009, MNRAS, 393, 329
- Peletier (1989) Peletier R. F., 1989, PhD thesis, University of Groningen, The Netherlands, (1989)
- Peletier et al. (1990) Peletier R. F., Davies R. L., Illingworth G. D., Davis L. E., Cawson M., 1990, AJ, 100, 1091
- Peng et al. (2010) Peng C. Y., Ho L. C., Impey C. D., Rix H.-W., 2010, AJ, 139, 2097
- Peterson (1976) Peterson R. C., 1976, ApJ, 210, L123
- Rawle et al. (2008) Rawle T. D., Smith R. J., Lucey J. R., Swinbank A. M., 2008, MNRAS, 389, 1891
- Romanowsky et al. (2003) Romanowsky A. J., Douglas N. G., Arnaboldi M., Kuijken K., Merrifield M. R., Napolitano N. R., Capaccioli M., Freeman K. C., 2003, Science, 301, 1696
- Röttgers, Naab & Oser (2014) Röttgers B., Naab T., Oser L., 2014, ArXiv e-prints
- Sánchez et al. (2012) Sánchez S. F. et al., 2012, A&A, 538, A8
- Sánchez-Blázquez et al. (2006) Sánchez-Blázquez P. et al., 2006, MNRAS, 371, 703
- Sánchez-Blázquez et al. (2014) —, 2014, A&A, 570, A6
- Scott et al. (2012) Scott N., Houghton R., Davies R. L., Cappellari M., Thatte N., Clarke F., Tecza M., 2012, MNRAS, 425, 1521
- Smith, Lucey & Conroy (2015) Smith R. J., Lucey J. R., Conroy C., 2015, MNRAS, 449, 3441
- Spiniello et al. (2015) Spiniello C., Barnabè M., Koopmans L. V. E., Trager S. C., 2015, ArXiv e-prints
- Spiniello et al. (2014) Spiniello C., Trager S., Koopmans L. V. E., Conroy C., 2014, MNRAS, 438, 1483
- Spiniello, Trager & Koopmans (2015) Spiniello C., Trager S. C., Koopmans L. V. E., 2015, ApJ, 803, 87
- Spiniello et al. (2012) Spiniello C., Trager S. C., Koopmans L. V. E., Chen Y. P., 2012, ApJ, 753, L32
- Tal et al. (2009) Tal T., van Dokkum P. G., Nelan J., Bezanson R., 2009, AJ, 138, 1417
- Thatte et al. (2006) Thatte N., Tecza M., Clarke F., Goodsall T., Lynn J., Freeman D., Davies R. L., 2006, in Society of Photo-Optical Instrumentation Engineers (SPIE) Conference Series, Vol. 6269, Society of Photo-Optical Instrumentation Engineers (SPIE) Conference Series
- Tortora et al. (2014a) Tortora C., La Barbera F., Napolitano N. R., Romanowsky A. J., Ferreras I., de Carvalho R. R., 2014a, MNRAS, 445, 115
- Tortora et al. (2010a) Tortora C., Napolitano N. R., Cardone V. F., Capaccioli M., Jetzer P., Molinaro R., 2010a, MNRAS, 407, 144
- Tortora et al. (2010b) Tortora C., Napolitano N. R., Romanowsky A. J., Jetzer P., 2010b, ApJ, 721, L1
- Tortora et al. (2011) Tortora C., Napolitano N. R., Romanowsky A. J., Jetzer P., Cardone V. F., Capaccioli M., 2011, MNRAS, 418, 1557
- Tortora et al. (2014b) Tortora C., Romanowsky A. J., Cardone V. F., Napolitano N. R., Jetzer P., 2014b, MNRAS, 438, L46
- Tortora, Romanowsky & Napolitano (2013) Tortora C., Romanowsky A. J., Napolitano N. R., 2013, ApJ, 765, 8
- Trager, Faber & Dressler (2008) Trager S. C., Faber S. M., Dressler A., 2008, MNRAS, 386, 715
- Trager et al. (2000a) Trager S. C., Faber S. M., Worthey G., González J. J., 2000a, AJ, 120, 165
- Trager et al. (2000b) —, 2000b, AJ, 119, 1645
- Treu et al. (2010) Treu T., Auger M. W., Koopmans L. V. E., Gavazzi R., Marshall P. J., Bolton A. S., 2010, ApJ, 709, 1195
- Treu et al. (2011) Treu T., Dutton A. A., Auger M. W., Marshall P. J., Bolton A. S., Brewer B. J., Koo D. C., Koopmans L. V. E., 2011, MNRAS, 417, 1601
- van Dokkum & Conroy (2010) van Dokkum P. G., Conroy C., 2010, Nature, 468, 940
- Vazdekis et al. (2012) Vazdekis A., Ricciardelli E., Cenarro A. J., Rivero-González J. G., Díaz-García L. A., Falcón-Barroso J., 2012, MNRAS, 424, 157
- Walcher et al. (2014) Walcher C. J. et al., 2014, A&A, 569, A1
- Worthey (1992) Worthey G., 1992, in IAU Symposium, Vol. 149, The Stellar Populations of Galaxies, Barbuy B., Renzini A., eds., p. 507
- Worthey (1994) —, 1994, ApJS, 95, 107
- Zanichelli et al. (2005) Zanichelli A. et al., 2005, PASP, 117, 1271