Enhancement of the 6.4 keV line in the inner Galactic ridge:
Proton-induced fluorescence?
Abstract
A common idea for the origin of the Galactic diffuse X-ray emission, particularly that of the iron lines from neutral and highly ionized atoms, is a superposition of many cataclysmic variables and coronally active binaries. In this scenario, the flux should symmetrically distribute between the east and west on the plane with respect to Sagittarius A∗ because the stellar mass distribution determined by infrared observations is nearly symmetric. This symmetry is confirmed for the highly ionized iron line as well as the continuum emission. However, a clear excess of the neutral iron line in the near east of the Galactic center compared to the near-west side is found. The flux distribution of the excess emission well correlates with molecular column density. The X-ray spectrum of the excess emission is described by a power-law continuum plus a 6.4 keV line with the large equivalent width of keV, which is hardly explained by the low-energy electron bombardment scenario. The longitudinal and latitudinal distribution of the excess emission disfavors the X-ray irradiation, neither by Sagittarius A∗ nor by nearby X-ray binaries. Then the low-energy proton bombardment is the most probable origin although the high energy density eV cm-3 in 0.1–1000 MeV is required and there is no conventional proton source in the vicinity.
1 Introduction
K-shell iron lines are one of the most remarkable features in the Galactic diffuse X-ray emission (Galactic center X-ray emission: GCXE and the Galactic ridge X-ray emission: GRXE). The spatial distribution of the iron lines largely extends out to ° along the plane. A deep observation of the GRXE near the Galactic center (, ) has resolved almost all the GRXE flux into point sources (Revnivtsev et al., 2009). This fact demonstrates that the origin of the iron lines is due to a superposition of many point sources such as cataclysmic variables (CVs) and coronally active binaries (ABs) (Revnivtsev et al., 2006; Yuasa et al., 2012; Warwick et al., 2014). The spectroscopic studies with ASCA, XMM-Newton, Chandra, and Suzaku revealed that the K-shell iron lines are separated into three lines at 6.4 (neutral iron), 6.7 (He-like iron), and 7.0 keV (H-like iron; Koyama et al., 1996; Predehl et al., 2003; Muno et al., 2004; Uchiyama et al., 2013). The X-ray spectra of the GRXE and GCXE, however, are not the same, which indicates different origins (Uchiyama et al., 2013). Even in the point-source scenario, the spectra and the mixing ratio of CVs and ABs should be different between the GRXE and GCXE. Furthermore, the flux distribution of the 6.4 keV line in the GCXE is clumpy, while those of the 6.7 and 7.0 keV lines show a roughly smooth and east-west symmetric distribution with respect to Sagittarius (Sgr) A∗ in the Galactic center (Uchiyama et al., 2011).
The 6.4 keV clumps in the GCXE have a large equivalent width (EW keV) and are time variable (e.g., Inui et al., 2009; Ponti et al., 2010; Nobukawa et al., 2011), and hence their origin is believed to be X-ray reflection and fluorescence by external X-rays of past big flares of Sgr A* (X-ray reflection nebulae; Koyama et al., 1996). In addition to the clumps, a more uniformly distributed 6.4 keV line emission is found (Uchiyama et al., 2011), and its origin is under debate. This Letter reports the first evidence for a clear east-west asymmetry of the 6.4 keV line emission at 1°.5–3°.5 on the Galactic disk: the east shows an excess over the west. Based on the spatial and spectral analysis, we discuss the origin of this excess. Errors quoted in this paper are at 90% confidence levels unless otherwise specified. The distance to the Galactic center is assumed to be 8 kpc.
2 Observations and data reduction
We performed campaign observations of the inner Galactic disk near the Galactic center at (west side) and (east side) using the Suzaku X-ray observatory (Mitsuda et al., 2007). The observation log is listed in table 1. The X-ray charge coupled device camera, the XIS (Koyama et al., 2007), onboard Suzaku covers the energy range of 0.2–12 keV, and has the field of view of . We excluded events during the South Atlantic Anomaly passages, at elevation angles below from the night Earth rim, and at elevation angles below from the sunlit Earth rim. We further excluded the data of ks during background flares detected on 17 March 2013. We reprocessed the data by using xispi in the analysis software package, HEAsoft 6.15.1, and the Suzaku calibration database (CALDB) released in May 2014. After the screening, we obtained the total exposure times of 597 ks and 1187 ks for the west and east data sets, respectively.
A bright X-ray binary, GX 31, is located at , which is – apart from each pointing in the east observations. Since some regions of the XIS fields of view are contaminated by the stray light from GX 31, we used data in the other clean regions. We excluded circular regions with radii at the positions of point-like sources with fluxes higher than erg s-1 cm-2 in 2–10 keV. We, furthermore, detected two compact diffuse sources in the east and west regions. While the west source is identified as G357.70.1 (Tornado nebula: Sawada et al. 2011), no counterpart is found for the east source, which is located at . These two sources are also excluded from the data.
| Obs. ID | Pointing direction | Obs. start | Exposure timeaaEffective exposure time after the screening (see text). | |
| (UT) | (ks) | |||
| Western side | ||||
| 501052010 | -1.5004 | -0.0034 | 2006-10-10 06:45:09 | 21.0 |
| 501053010 | -1.8335 | -0.0030 | 2006-10-10 21:18:59 | 23.4 |
| 503014010 | -2.0995 | -0.0522 | 2008-09-18 04:46:49 | 59.7 |
| 504036010 | -2.2943 | -0.1163 | 2009-08-29 12:05:20 | 136.5 |
| 503015010 | -2.3502 | -0.0527 | 2008-09-19 07:33:05 | 61.4 |
| 503016010 | -2.6012 | -0.0525 | 2008-09-22 06:47:49 | 57.4 |
| 503017010 | -2.8503 | -0.0525 | 2008-09-23 08:08:10 | 56.5 |
| 503018010 | -3.1015 | -0.0517 | 2008-09-24 09:27:54 | 31.9 |
| 503018020 | -3.1004 | -0.0514 | 2008-10-03 18:05:13 | 13.3 |
| 503018030 | -3.1006 | -0.0470 | 2009-02-19 07:32:01 | 12.9 |
| 503019010 | -3.3496 | -0.0477 | 2009-02-19 16:37:49 | 56.8 |
| 503020010 | -3.6001 | -0.0473 | 2009-02-21 01:15:55 | 66.2 |
| Eastern side | ||||
| 501060010 | 1.5016 | 0.0027 | 2007-03-17 05:07:04 | 68.1 |
| 508075010 | 1.7513 | -0.0431 | 2014-03-10 01:33:32 | 109.3 |
| 502009010 | 1.8336 | -0.0035 | 2007-10-12 21:52:24 | 22.9 |
| 507069010 | 2.0003 | -0.0439 | 2013-03-15 09:48:19 | 110.3 |
| 507070010 | 2.2511 | -0.0437 | 2013-03-17 18:39:56 | 111.8 |
| 507071010 | 2.5011 | -0.0438 | 2013-03-20 02:41:04 | 112.3 |
| 507072010 | 2.7509 | -0.0439 | 2013-03-22 07:20:36 | 110.7 |
| 507073010 | 3.0011 | -0.0434 | 2013-03-24 08:46:03 | 108.9 |
| 507074010 | 3.1514 | 0.1563 | 2013-04-03 21:33:46 | 104.1 |
| 507075010 | 3.2512 | 0.4070 | 2013-03-11 09:06:19 | 109.6 |
| 508076010 | 3.2514 | -0.0427 | 2014-02-28 12:46:16 | 109.8 |
| 508077010 | 3.5043 | -0.0380 | 2014-03-02 17:00:51 | 109.4 |
3 Results and discussion
3.1 Galactic longitude profile
We make spectra from each pointing and subtract the non X-ray background (NXB) estimated with xisnxbgen (Tawa et al., 2008). The NXB-subtracted spectra in the 4–10 keV band are fitted with a phenomenological model which consists of four Gaussian lines and an absorbed bremsstrahlung as well as the cosmic X-ray background (CXB) model (Kushino et al., 2002). The line energies of the Gaussians are fixed to 6.4 (neutral iron K), 6.7 (He-like iron K), 7.0 (H-like iron Ly), and 7.06 keV (neutral iron K; Smith et al., 2001; Kaastra and Mewe, 1993). The intensity of the neutral iron K line is fixed to 0.125 times that of the neutral iron K line (Kaastra and Mewe, 1993), while those of the other lines are free parameters. The interstellar absorption column densities for the east and the west are fixed to cm-2 (Uchiyama et al., 2013). The normalization and temperature of the bremsstrahlung component are allowed to vary. We then obtain the intensities of the 6.4 keV and 6.7 keV lines and the continuum in the 4–10 keV band (where the 6–7 keV band was excluded).
The flux of the GRXE depends on the Galactic latitude (Kaneda et al., 1997; Uchiyama et al., 2013). The geometric centers of the fields of view are not exactly on the Galactic plane (), and hence we correct the best-fit intensities to those on the Galactic plane. We use the scale-height of for the GRXE (Kaneda et al., 1997). Then the relation between the best-fit intensity at and the corrected intensity is:
| (1) |
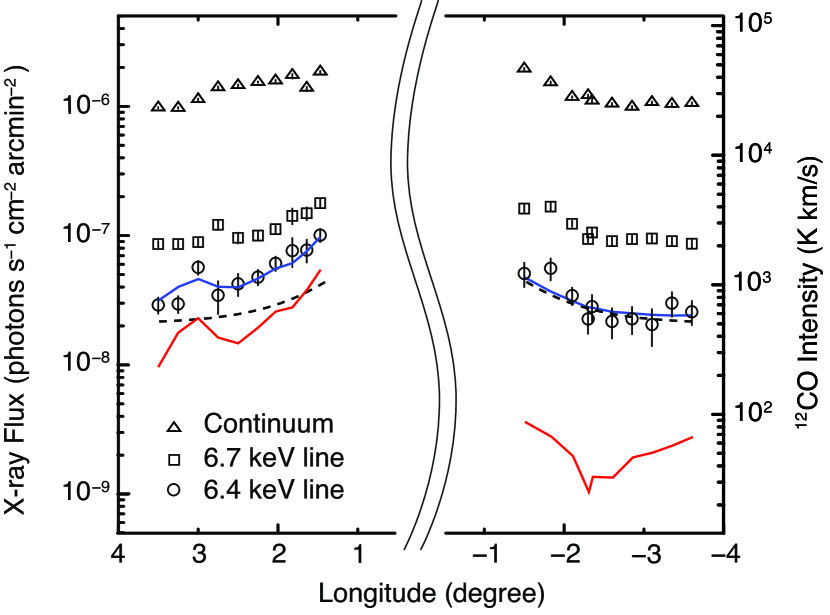
The longitudinal profile of the intensity of the 6.4 keV and 6.7 keV lines and the continuum are shown in figure 1. Previous studies revealed that a major fraction of the GRXE is due to unresolved point sources, mostly CVs and ABs (Revnivtsev et al., 2006, 2009; Yuasa et al., 2012; Warwick et al., 2014). The stellar distribution has been constructed from infrared observations, and has an east-west symmetry (Nishiyama et al., 2013; Launhardt et al., 2002; Revnivtsev et al., 2006). The profile is given by the dashed lines in figure 1. All the X-ray flux distributions, except that of the 6.4 keV line in the east, are consistent with the stellar distribution curve. A remarkable structure is an excess of the 6.4 keV line flux in the east compared to the west, and hence the excess should have a different origin from the symmetrical components due to point sources.
We plot in figure 1 the 12CO line intensity taken by NANTEN integrated over the velocity range from km s-1 to km s-1 (Torii et al., 2010). Here, the local components uniformly distributed around km s-1 to km s-1 and the near-side 3 kpc arm having a velocity gradient from km s-1 at ° to km s-1 at ° (Dame and Thaddeus, 2008) are excluded. The 12CO profile is similar to the excess distribution of the 6.4 keV line in the east, which suggests that its origin is due to molecular gas. The excess at coincides with the intersection point of the Galactic plane and the giant molecular cloud, Bania’s Clump 2, which extends towards the north (Bania, 1977).
3.2 Spectrum of the excess of the 6.4 keV line in the east
| Emission lines | Continuum | ||||
| 6.4 keV | 6.7 keV | 7.0 keV | photon index | normalization | |
| Unit | ()bbAbsorption-corrected line flux in the units of photons s-1 cm-2 arcmin-2. | ()bbAbsorption-corrected line flux in the units of photons s-1 cm-2 arcmin-2. | ()bbAbsorption-corrected line flux in the units of photons s-1 cm-2 arcmin-2. | ()ccNormalization at 6.4 keV in the units of photons s-1 keV-1 cm-2 arcmin-2. | |
| EAST | 5.10.4 | 10.30.5 | 2.50.4 | 2.30.1 | 22.90.1 |
| WEST | 2.50.4 | 10.30.5 | 2.80.4 | 2.20.1 | 21.70.1 |
| excess | 2.50.6 | – | – | 31 | 1.90.3 |
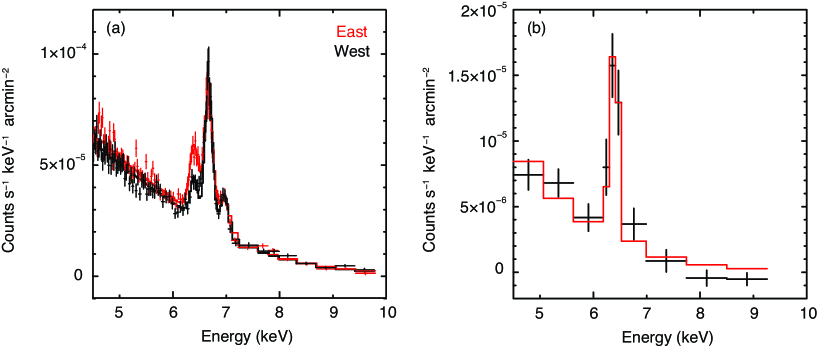
Figure 2a shows integrated X-ray spectra from the east and west sides. The CXB is subtracted from both the spectra according to Kushino et al. (2002). Each spectrum is fitted with an absorbed power law plus four Gaussian lines at 6.4, 6.7, 7.0, and 7.06 keV. The interstellar absorption column density is fixed to cm-2. The intensity of 7.06 keV (the neutral iron K) line is fixed to 0.125 times that of 6.4 keV (the neutral iron K) line. The best-fit parameters are summarized in table 2.
We subtract the west spectrum from the east one to make the X-ray spectrum of the east excess as is shown in figure 2b. The excess spectrum is fitted with a power law plus a Gaussian line at 6.4 keV. The best-fit continuum and the line fluxes are photons s-1 keV-1 cm-2 arcmin-2 and photons s-1 cm-2 arcmin-2, respectively, as shown in table 2. Since the 6.7 keV line and its relevant continuum fluxes have a possible asymmetry between the east and west by %, we take this error into account as the uncertainty of the symmetry. Then the EW is estimated to be keV, where the second and third terms are the statistical and systematical errors, respectively.
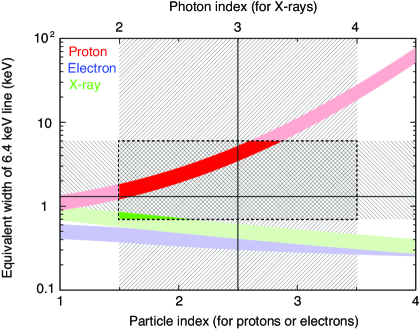
In the case of cosmic-ray bombardment, the 6.4 keV line is produced via inner-shell ionization by protons in the MeV band (Dogiel et al., 2011) or by electrons in the keV band (Valinia et al., 2000; Yusef-Zadeh et al., 2002), while the continuum is due to inverse bremsstrahlung (for protons) or bremsstrahlung (for electrons). The photon index of the observed X-ray spectrum () translates into the particle index . As for the X-ray irradiation, the 6.4 keV line is produced via photoionization by X-rays with energy higher than 7.1 keV (K-edge) while the continuum is due to Thomson scattering. The photon index of the observed X-ray spectrum is the same as that of the irradiating X-rays. We show the EW of the 6.4 keV line as a function of particle or photon index in figure 3. In both the scenarios, the EW depends on the iron abundance (Tsujimoto et al., 2007; Dogiel et al., 2011). The metal abundances were determined in the Galactic center region by X-ray observations of the high temperature plasma to be solar for sulfur, argon, calcium but 1.2 solar for iron (Nobukawa et al., 2010; Uchiyama et al., 2013). Muno et al. (2004) reported a similar result. The iron abundance of 1–1.5 solar was also measured in the X-ray reflection nebulae in Sgr B with the absorption of the Fe-K edge (Nobukawa et al., 2011). The same result was obtained by mid-infrared observations; Giveon et al. (2002) obtained 2 solar for heavy elements of neon, sulfur, and argon (not of iron), and Cunha et al. (2007) and Martin et al. (2015) measured the iron abundance to be 1–1.5 solar. Therefore, we adopt the iron abundance of 1–1.5 solar in figure 3. The EW in the X-ray scenario also depends on the angle between the line of sight and the incident photon direction (Tsujimoto et al., 2007). Figure 3 shows the result of the reflection angle , which gives the maximum EW.
The black horizontal line in figure 3 indicates the best-fit EW, while the horizontal hatched region shows the range of the statistical and systematic errors. The allowed parameter region completely excludes the electron origin. Then, we discuss the others, the X-ray and proton scenarios in the following subsections.
3.3 X-ray irradiation scenario
In the X-ray irradiation scenario, the 6.4 keV line flux depends on the irradiating source flux, the hydrogen column density (), and the distance () between the irradiating source and the target. The hydrogen column density (2–6) cm-2 is obtained by multiplying the 12CO line intensity in figure 1 by the conversion factor (called -factor) of cm-2 (Kkm s-1)-1 (Torii et al., 2010).
A possible irradiating source is the supermassive black hole Sgr A∗, as for the X-ray reflection nebula model invoked for the GC region (Sunyaev et al., 1993; Koyama et al., 1996; Ponti et al., 2010). In this case, the source luminosity should be erg s-1 about years ago, where is the distance of the 6.4 keV line emitting region from Sgr A∗. For the X-ray reflection nebulae in Sgr B, the luminosity of Sgr A∗ was erg s-1 about 300 years ago (Murakami et al., 2000; Revnivtsev et al., 2004). Brighter flares of erg s-1 in the far past (105–107 years ago) have been proposed to explain the Fermi bubbles and the recombining plasma in the south region of the Galactic center (Su et al., 2010; Nakashima et al., 2013). Thus, many big flares in the interval period between these two epochs (700–1500 years ago) may be conceivable. However, this scenario has two difficulties.
The first difficulty comes from the longitudinal distribution of the excess flux of the 6.4 keV line. The observed excess flux is proportional to the 12CO intensity, which means that the X-ray intensity from Sgr A∗ is almost constant, and does not decrease as the square of the Galactic longitude, or the distance from Sgr A∗; the past Sgr A∗ flares should have smoothly increasing flux with the square of the look-back time. A monotonous smooth decrease of flux should continue during 700–1500 years ago, which is artificial, although not completely rejected.
The second difficulty comes from the flux ratio of the 6.4 keV line to the 12CO intensity (here, ) in the molecular cloud Clump 2. Clump 2 extends toward the north from the Galactic plane and has an elliptical shape with major and minor axes of and , respectively. We estimate the excess 6.4 keV line flux from the on-plane (; Obs. ID=507073010) and off-plane (–0°.40; Obs.ID=507074010 and 507075010) parts of Clump 2 by subtracting the symmetrical component from the observed flux, and obtained of and for the on- and off-plane parts, respectively (unit is photons s-1 cm-2 arcmin-2 (Kkm s-1)-1). Since the flux from Sgr A∗ would be equal in the small separation angle between on- and off-plane parts, should be also equal, which is in conflict with the observed values. From these two difficulties, we regard that the X-ray irradiation by Sgr A∗ is unlikely.
The other possibility is that irradiation of many X-ray binaries in the east is responsible for the 6.4 keV line. This idea is essentially the same as Molaro et al. (2014). Assuming that a mean spectrum of the relevant X-ray binaries is a power law with the photon index of , and is surrounded by cold material with – cm-2, a fraction of 0.03–0.1% of the total 2–10 keV flux is converted to 6.4 keV X-rays. We estimate the excess 6.4 keV luminosity in total to be erg s-1 in the relevant area of . Then, a total luminosity of – erg s-1 is required to the sources inside the area. This flux exceeds the total luminosity of the GRXE in this region ( erg s-1 ) by one or two order of magnitude. No source brighter than erg s-1 is found in this area. Therefore, more than one or two order of magnitude brighter flares within the relevant regions and duration of the past years are required. In addition, the reflection angle should be distributed randomly. Then the EW integrated over the reflection angle is times lower than the green belt in figure 3 (reflection angle ), and hence is out of the allowed range. Thus this scenario is also unlikely.
3.4 Energy density of low-energy protons
In the proton model, the excess flux of the 6.4 keV line is given by
| (2) |
where , , , and are the cross section to produce the 6.4 keV line by protons, the velocity, the number density at 1 MeV and the energy of protons, and the line-of-sight hydrogen column density, respectively. The spectral index of is adopted from the best-fit result (see figure 3). Using the -factor of cm-2 (Kkm s-1)-1 (Torii et al., 2010), the 6.4 keV line flux is expressed as the 12CO line intensity multiplied by the conversion factor , which is measured to be photons s-1 cm-2 arcmin-2 (Kkm s-1)-1 in figure 1. The cross section has a peak at 10 MeV and rapidly decreases below 1 MeV and above 50 MeV (Paul and Sacher, 1989). We set the integration range to be 1–50 MeV, and then obtained the normalization protons cm-3 and the energy density of 20 eV cm-3. When the integration range is expanded to be 0.1–1000 MeV, the energy density becomes 80 eV cm-3. This is about one or two orders of magnitude higher than the canonical value eV cm-3 that is determined by observing high-energy cosmic rays (Neronov et al., 2012).
Tatischeff et al. (2012) calculated an energy conversion rate from protons to the 6.4 keV line to be or less. Since the total luminosity of the 6.4 keV line emission is erg s-1, the proton power of erg s-1 is estimated. This is not far from the energy erg s-1 that protons input to the Galactic center (Dogiel et al., 2013).
The diffusion length of low-energy (MeV) protons is only a few tens of parsecs (Dogiel et al., 2011), and therefore the MeV protons should be produced in situ, possibly by a supernova remnant or a pulsar wind nebula. However, no candidate source is found in the vicinity. Amano et al. (2011) indicated that cosmic-ray particles are possibly generated with stochastic acceleration by Alfvénic turbulence in the central molecular zone with large velocity dispersion of km s-1. Since Clump 2 exhibits large velocity dispersion of km s-1 (Bania, 1977; Torii et al., 2010), another possibility to produce the MeV protons is the stochastic acceleration. Our results demonstrate that the 6.4 keV line can be a unique probe to investigate low-energy cosmic-ray protons.
References
- Amano et al. (2011) Amano, T., Torii, K., Hayakawa, T., & Fukui, Y. 2011, PASJ, 63, L63
- Bania (1977) Bania, T. M. 1977, ApJ, 216, 381
- Cunha et al. (2007) Cunha, K., Sellgren, K., Smith, V. V., et al. 2007, ApJ, 669, 1011
- Dame and Thaddeus (2008) Dame, T. M. & Thaddeus, P. 2008, ApJL, 683, L143
- Dogiel et al. (2011) Dogiel, V., Chernyshov, D., Koyama, K., Nobukawa, M., & Cheng, K. 2011, PASJ, 63, 535
- Dogiel et al. (2013) Dogiel, V. A., Chernyshov, D. O., Tatischeff, V., Cheng, K.-S., & Terrier, R. 2013, ApJL, 771, 43
- Giveon et al. (2002) Giveon, U., Sternberg, A., Lutz, D., Feuchtgruber, H., & Pauldrach, A. W. A. 2002, ApJ, 566, 880
- Inui et al. (2009) Inui, T., Koyama, K., Matsumoto, H., & Tsuru, T. G. 2009, PASJ, 61, S241
- Kaastra and Mewe (1993) Kaastra, J. S. & Mewe, R. 1993, A&A, 97, 443
- Kaneda et al. (1997) Kaneda, H., Makishima, K., Yamauchi, S., et al. 1997, ApJ, 491, 638
- Koyama et al. (1996) Koyama, K., Maeda, Y., Sonobe, T., et al. 1996, PASJ, 48, 249
- Koyama et al. (2007) Koyama, K., Tsunemi, H., Dotani, T., et al. 2007, PASJ, 59, S23
- Kushino et al. (2002) Kushino, A., Ishisaki, Y., Morita, U., et al. 2002, PASJ, 54, 327
- Launhardt et al. (2002) Launhardt, R., Zylka, R., & Mezger, P. G. 2002, A&A, 384, 112
- Martin et al. (2015) Martin, R. P., Andrievsky, S. M., Kovtyukh, V. V., et al. 2015, MNRAS, 449, 4071
- Mitsuda et al. (2007) Mitsuda, K., Bautz, M., Inoue, H., et al. 2007, PASJ, 59, S1
- Molaro et al. (2014) Molaro, M., Khatri, R., & Sunyaev, R. A. 2014, A&A, 561, 107
- Muno et al. (2004) Muno, M. P., Baganoff, F. K., Bautz, M. W., et al. 2004, ApJ, 613, 326
- Murakami et al. (2000) Murakami, H., Koyama, K., Sakano, M., Tsujmoto, M., & Maeda, Y. 2000, ApJ, 534, 283
- Nakashima et al. (2013) Nakashima, S., Nobukawa, M., Uchida, H. et al. 2013, ApJ, 773, article id. 20
- Neronov et al. (2012) Neronov, A., Semikoz, D. V., & Taylor, A. M. 2012, Phys. Rev. Lett. 108, 051105
- Nishiyama et al. (2013) Nishiyama, S., Yasui, K., Nagata, T., et al. 2013, ApJL, 769, L28
- Nobukawa et al. (2010) Nobukawa, M., Koyama, K., Tsuru, T. G., Ryu, S. G., & Tatischef, V. 2010, PASJ, 62, 423
- Nobukawa et al. (2011) Nobukawa, M., Ryu, S. G., Tsuru, T. G., & Koyama, K. 2011, ApJL, 739, L52
- Paul and Sacher (1989) Paul, H., & Sacher, J. 1989, Atomic Data and Nuclear Data Tables, 42, 105
- Predehl et al. (2003) Predehl, P., Constantini, E., Hasinger, G., & Tanaka, Y. 2003, Astron. Nachr, 324, 73
- Ponti et al. (2010) Ponti, G., Terrier, R., Goldwurm, A., Belanger, G., & Trap, G. 2010, ApJ, 714, 732
- Revnivtsev et al. (2004) Revnivtsev, M., Churazov, E., Sazonov, M., et al. 2004, A&A, 425, L49
- Revnivtsev et al. (2006) Revnivtsev, M., Sazonov, S., Gilfanov, M., Churazov, E., & Sunyaev, R. 2006, A&A, 452, 169
- Revnivtsev et al. (2009) Revnivtsev, M., Sazonov, S., Churazov, E., et al. 2009, Natur, 458, 1142
- Sawada et al. (2011) Sawada, M., Tsuru, T. G., Koyama, K., & Oka, T. 2011, PASJ, 63, S849
- Smith et al. (2001) Smith, R. K., Brickhouse, N. S., Liedahl, D. A., & Raymond, L. C. 2001, ApJ, 556, L91
- Su et al. (2010) Su, M., Slatyer, T., & Finkbeiner, D. 2010, ApJ, 724, 1044
- Sunyaev et al. (1993) Sunyaev, R., Markevitch, M., & Pavlinsky, M. 1993, ApJ, 407, 606
- Tawa et al. (2008) Tawa, N., Hayashida, K., Nagai, M., et al. 2008, PASJ, 60, S11
- Tatischeff et al. (2012) Tatischeff, V., Decourchelle, A., & Maurin, G. 2012, A&A, 546, A88
- Torii et al. (2010) Torii, K., Kudo, N., Fujishita, M., et al. 2010, PASJ, 62, 1307
- Tsujimoto et al. (2007) Tsujimoto, M., Hyodo, Y., & Koyama, K. 2007, PASJ, 59, S229
- Uchiyama et al. (2011) Uchiyama, H., Nobukawa, M., Tsuru, T. G., Koyama, K., & Matsumoto, H. 2011, PASJ, 63, S903
- Uchiyama et al. (2013) Uchiyama, H., Nobukawa, M., Tsuru, T. G., & Koyama, K. 2013, PASJ, 65, 19
- Valinia et al. (2000) Valinia, A., Tatischeff, V., Arnaud, K., Ebisawa, K., & Ramaty, R. 2000, ApJ, 543, 733
- Warwick et al. (2014) Warwick, R. S., Byckling, K., & Pérez-Ramírez, D. 2014, MNRAS, 438, 2967
- Yuasa et al. (2012) Yuasa, T., Makishima, K., & Nakazawa, K. 2012, ApJ, 753, 129
- Yusef-Zadeh et al. (2002) Yusef-Zadeh, F., Law, C., & Wardle, M. 2002, ApJL, 568, L121