School of Physics and Material Science, Anhui University, Hefei, 230039, China
Hefei National Laboratory for Physical Sciences at Microscales & Department of Chemical Physics, University of Science and Technology of China, Hefei, 230026, China
Networks and genealogical trees Nucleation Lattice theory and statistics (Ising, Potts, etc.)
Heterogeneous nucleation on complex networks with mobile impurities
Abstract
We study the heterogeneous nucleation of Ising model on complex networks under a non-equilibrium situation where the impurities perform degree-biased motion controlled by a parameter . Through the forward flux sampling and detailed analysis on the nucleating clusters, we find that the nucleation rate shows a nonmonotonic dependence on for small number of impurities, in which a maximal nucleation rate occurs at corresponding to the degree-uncorrelated random motion. Furthermore, we demonstrate the distinct features of the nucleating clusters along the pathway for different preference of impurities motion, which may be used to understand the resonance-like dependence of nucleation rate on the motion bias of impurities. Our theoretical analysis shows that the nonequilibrium diffusion of impurities can always induce a positive energy flux that can facilitate the barrier-crossing nucleation process. The nonmonotonic feature of the average value of the energy flux with may be the origin of our simulation results.
pacs:
89.75.Hcpacs:
64.60.Q-pacs:
05.50.+q1 Introduction
Nucleation is an activated process which initiates the decay of a metastable state into a more stable one [1] driven by fluctuation. Many important dynamical processes on real-world scenarios, such as crystallization[2, 3], fractures[4, 5], glass formation[6], and protein folding[7], to list just a few, are concerned with nucleation. For many decades, our understanding of nucleation has been dominated by the classical nucleation theory (CNT), and it has been applied not only to the liquid-gas and liquid-solid systems, but also to regular lattices in Euclidean space. For instance, in two-dimensional lattices, Allen et al discovered that shear can enhance the nucleation rate and the rate peaks at an intermediate shear rate [8]. Sear found that a single impurity may considerably enhance the nucleation rate [9]. Page and Sear reported that the existence of a pore may lead to two-stage nucleation, and the overall nucleation rate can reach a maximum level at an intermediate pore size [10]. In three-dimensional lattices, the nucleation pathway of the Ising model has also been studied by Sear and Pan [11, 12]. In addition, the validity of CNT has been tested in other Euclidean space [13, 14, 15, 16, 17, 18, 19].
Since many real systems can be properly modeled by network-organized structure [20, 21, 22], it is thus an interesting topic to explore nucleation process in complex networks. Recently, we have studied nucleation dynamics of the Ising model on scale-free (SF) networks [23], Erdös-Rényi (ER) networks[24] and modular networks [25]. We found that, for homogeneous nucleation on SF networks, many small isolated nucleating clusters emerge at the early stage of the nucleation process, until suddenly they form the critical nucleus through a sharp merging process, and the nucleation rate decays exponentially with network size. For homogeneous nucleation on ER networks, there always exists a dominant nucleating cluster to which relatively small clusters are attached gradually to form the critical nucleus. For modular networks, as the network modularity worsens the nucleation undergoes a transition from a two-step to one-step process and the nucleation rate shows a nonmonotonic dependence on the modularity. For heterogeneous nucleation, target impurities are shown to be much more efficient to enhance the nucleation rate than random ones. However, in our previous work, impurities are considered to be fixed in some nodes with the new phase. As we know, mobility is a ubiquitous feature of real systems [26, 27, 28, 29, 30], including the mobility of impurities, and may drastically influence the dynamical evolution. For example, it has been reported that mobility promotes synchronization [31, 32], enhances signal response [33], affects contagion processes[34], and tunes biodiversity [35]. In addition, impurities may be caused by the vacancy defects with no interaction, not with new phase. How the impurity motion would influence the nucleation rate and pathway is still an open question. Motivated by this, we will study the different roles of the motion in the formation of nucleating clusters, which can reveal the nucleation pathways of the Ising model in the underlying networks.
In the present work, we adopt the recently proposed forward flux sampling (FFS) [36] approach, which is efficient and easy to implement to study rare events, and employ SF networked Ising model. Ising model is a paradigm for many phenomena in statistical physics and widely used to study the nucleation process. By introducing degree-biased random walks for impurities on the network, we find that for small number of impurities the nucleation rate shows a nonmonotonic dependence on the bias parameter of the motion of impurities, in which a maximal nucleation rate occurs at the situation where the impurities perform random motions. Furthermore, we show that there are different properties of the nucleating clusters along the pathway corresponding to different impurities bias motions.
2 Model and method
2.1 Model
We consider the non-equilibrium Ising model with mobile impurities on complex networks consisting of normal nodes and defect nodes called impurities. Each normal node is endowed with a spin variable that can be (up), or (down), and each defect node is endowed with spin (impurity). The Hamiltonian of the system is given by
| (1) |
where is the coupling constant and is the external magnetic field. For convenience, we set in the following discussions. The elements of the adjacency matrix of the network take if nodes and are connected and otherwise. The degree, that is the number of neighboring nodes, of node is defined as Notice that, without defect nodes, there exist a number of simulations and analytical results for the Ising model in ER and SF networks [37, 38, 39, 40, 41].
The dynamical evolution of our model has two ingredients: Spin-flip and Impurity diffusion. In each time step, we attempt to perform the following two types of dynamics. 1) Spin-flip: we randomly chose a normal node and attempt to flip its spin according to the Metropolis acceptance probability [42], where with the Boltzmann constant and the temperature , and is the energy change due to the flipping process; 2) Impurity diffusion: After a spin of a normal node has been attempted to be flipped, we then randomly choose a defect node(impurity node) and exchange the spin with that of one of the nearest neighboring normal nodes according to the probability
| (2) |
Here is the diffusion constant, the sum is taken over all the nearest neighboring normal nodes of , and is a tunable parameter which biases the impurities’ motion either towards low-degree nodes () or towards hubs (). For , we recover the standard (unbiased) random walk.
In general, with the increment of the system undergoes a second-order phase transition from an ordered state to a disordered one at the critical temperature . Below the system prefers to be in a state with all spins up or down. Given a small external field, one of these two states will become metastable, and if initiated predominantly in this metastable state, the system will remain for a significantly long time before it undergoes a nucleation transition to the thermodynamically stable state. We are interested in the rate and pathways for this transition.
2.2 FFS method
The FFS method has been successfully used to calculate rate constants and transition paths for rare events in equilibrium and non-equilibrium systems [8, 9, 10, 36, 43, 44]. This method uses a series of interfaces in phase space between the initial and final states to force the system from the initial state to the final state in a ratchetlike manner. First, we define an order parameter , where represents the phase-space coordinates, such that the system is in state if and state if , while a series of nonintersecting interfaces () lie between states and , such that any path from to must cross each interface without reaching before . The transition rate from to is calculated as
| (3) |
where is the average flux of trajectories crossing in the direction to . is the probability that a trajectory crossing in the direction to will eventually reach before returning to , and is the probability that a trajectory which reaches , having come from , will reach before returning to . For more detailed descriptions of FFS method, please see Ref. [45].
In this work, we perform Monte Carlo simulation and use FFS to study nucleation rate and pathways of the non-equilibrium phase from the metastable spin phase. Specifically, we set , and start from an initial state with for most of the spins. We define the order parameter as the total number of up spins in the network. The spacing between adjacent interfaces is fixed at up spins. We perform trials per interface for each FFS sampling, from which at least configurations are saved in order to investigate the statistical properties along the nucleation pathway. The results are obtained by averaging over independent FFS samplings and different network realizations.
3 Results and Discussion
3.1 Nucleation rate
In what follows, we employ a Barabási-Albert (BA) SF network, whose degree distribution follows a power law with the scaling exponent [46].
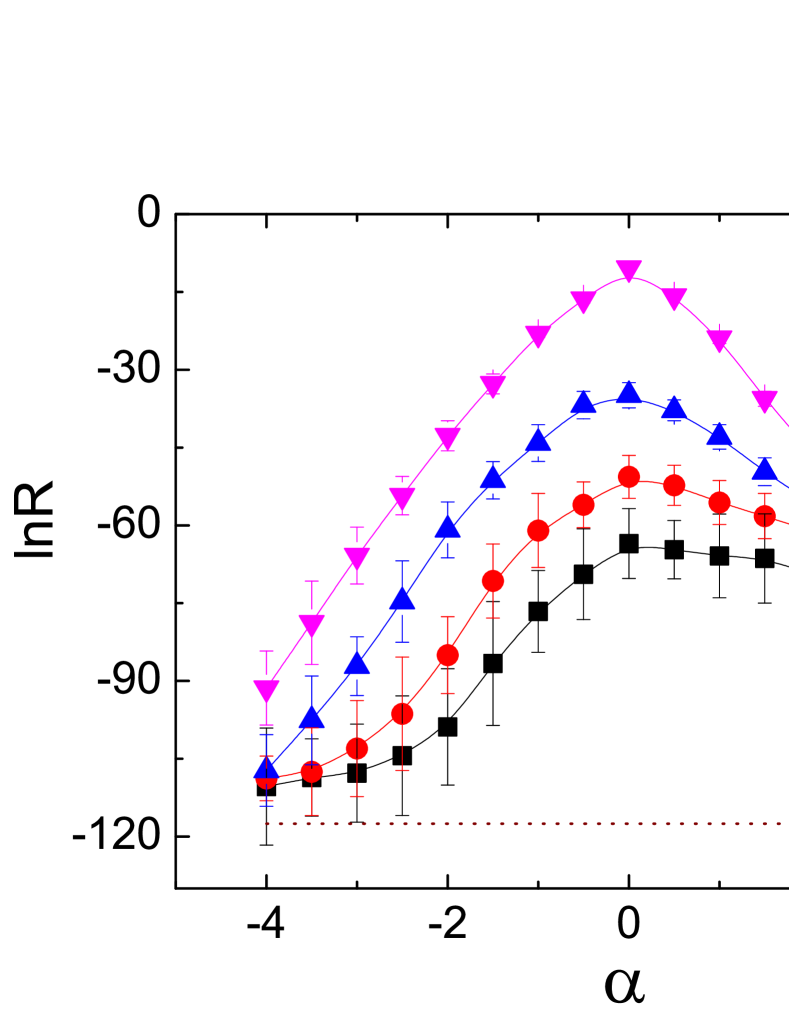
To begin, we fix the small number of impurities and vary the diffusion constant to investigate how the nucleation rate (in unit of ) evolves with controlling parameter . Figure 1 shows the dependence of the logarithm of the nucleation rate on for different values of . One can observe that exhibits a resonance-like behavior with the increment of . That is, there exists an optimal value of at , corresponding to the maximum . Interestingly, this phenomenon is robust against the diffusion constant . This result indicates that random motions of impurities corresponding to is more favorable to nucleation than degree-biased motions. In addition, for any given values of we find that increases monotonously with , indicating that impurities mobility is always in favor of nucleation. That is, the larger the mobility rate is, the larger becomes. The dotted line indicates the result without impurities, i.e., . Obviously, for any given value of impurities may considerably enhance the nucleation rate, which is consistent with [9].
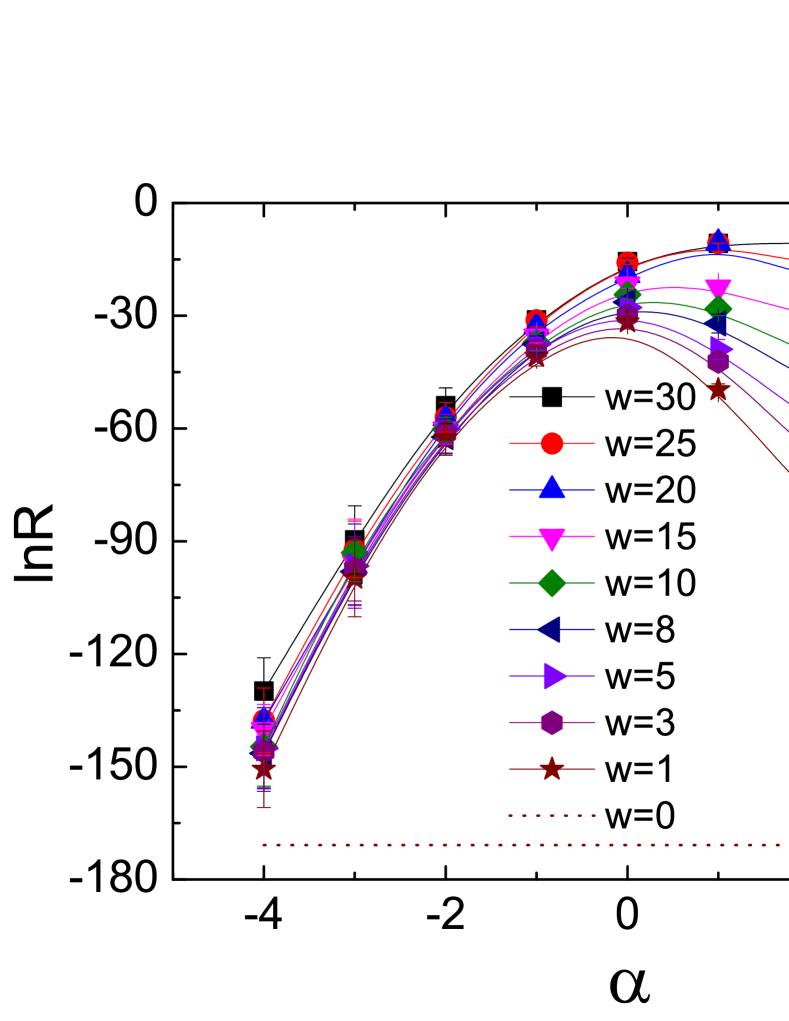
It is worthy noting that this nontrivial dependence is unobservable if the number of impurities becomes relatively large. Figure 2 shows the dependence of on for different values of . Clearly, for small number of impurities, say , one can always observe an interesting mobility induced resonance-like behavior in accordance with Fig.1. While for big , say , increases monotonously with for and then approaches a constant value for . Other values of have also been investigated; the qualitative results are the same and not shown here. But for indicated by the dotted line, i.e.,without impurities, is considerably less than that of impurities.
3.2 Nucleation pathway
To elucidate the detailed characteristics along the nucleation pathway for different bias motions, we save lots of configurations generated by FFS and perform detailed analysis on the nucleating clusters, including the relative size of the largest and the second largest cluster, average degree of the cluster nodes and the number of clusters. According to CNT, there exists a critical nucleus size of the new phase, above which the system grows rapidly to the new phase. Herein, we mainly focus on the nucleation stage where . In our simulation, we determine by computation of the committor probability , which is the probability of reaching the thermodynamic stable state before returning to the metastable state. As commonly reported in the literature [12, 18], the critical nucleus appears at . Since are different for different bias parameters, we thus introduce as the control parameter.
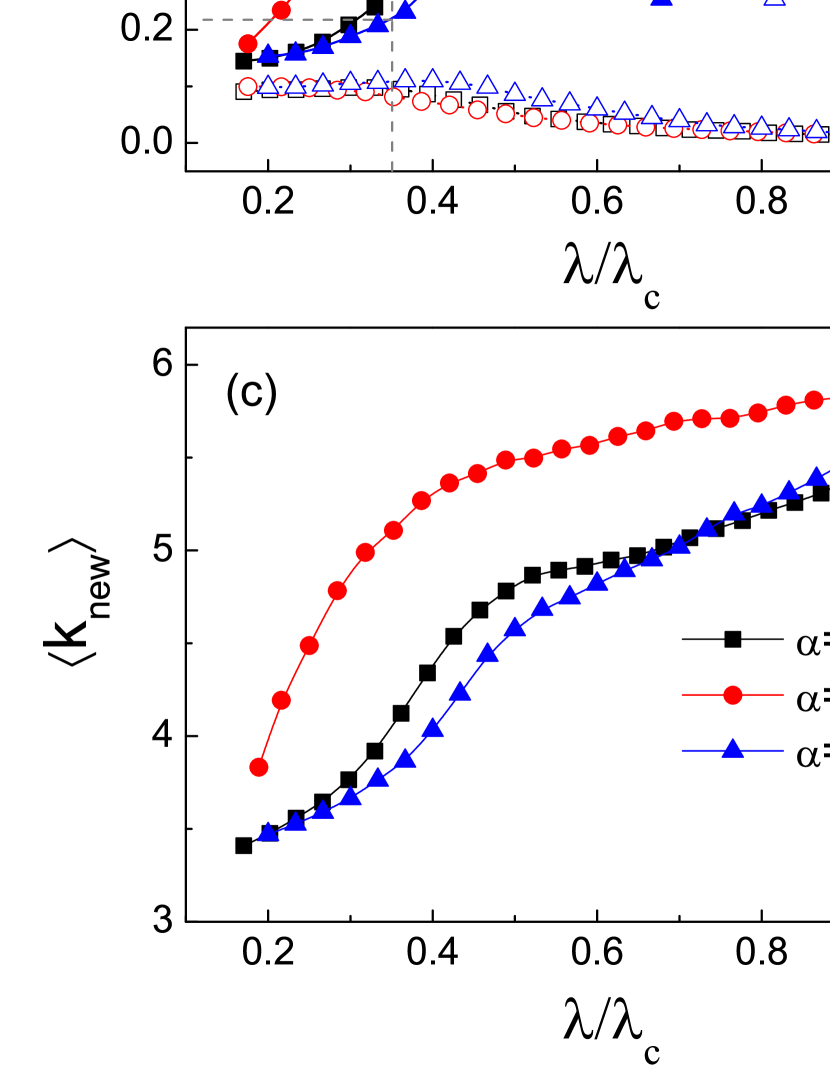
Following the previous study [24], we introduce the relative size , of the largest and the second largest nucleating cluster, which are defined as the ratios of the number of up spins within the largest and the second largest cluster to the total number of up spins respectively. and (averaged over the ensemble at each interface) as a function of are plotted in figure 3 (a). Clearly, one can see that for (solid red circles) is always larger than those for (solid black squares) and (solid blue triangles). Specifically, at , grows already more than for , while it is less than for and about for , as shown by the dashed gray lines in figure 3(a). But when they almost tend to together. This difference means that for unbiased random motion grows fast at the very beginning following by a relatively slow increasing, while for biased motion, increases slowly at first and then rapidly when approaching the critical nucleus. From figure 3 (a) one can also observe that the relative size (denoted by the empty symbols) is greatly less than , indicating that the nucleation is dominated by the largest nucleating cluster.
We also plot and , defined as the average degrees of the nodes within the largest and the second largest nucleating cluster respectively, as a function of in figure 3 (b). Clearly, for indicated by the solid red circles, is always larger than those for and indicated by the solid black squares and solid blue triangles respectively. Strikingly, at the early nucleating stage, grows sharply for the former, while it grows gradually for the latter. Furthermore, it is found that is greatly less than , which suggests again that the largest nucleating cluster dominates the nucleation.
In addition, we also investigate the average degree of the nodes inside the new phase and the number of nucleating clusters, and plot and as a function of in figure 3 (c) and (d) respectively. As shown, increases monotonically with for different , which means the new phase tends to grow from those nodes with smaller degrees. Nevertheless, for different preference of impurities motion it shows the distinct features along the nucleation pathway. For , grows fast at the very beginning following by a relatively slow increasing. For and , increases slowly at first and then grows fast until approaching the critical nucleus. Such a scenario is consistent with figures 3 (a) and (b). From figure 3 (d) one can observe that shows non-monotonically dependence on for different . Especially, the number of clusters for is always less than that for . On the other hand, approaches the same magnitude near the formation of critical nucleus for three different , which suggests that it is easier for the critical nucleus comes into being for unbiased random motion than that for others. This result is also consistent with the picture shown in figures 3 (a) to (c).
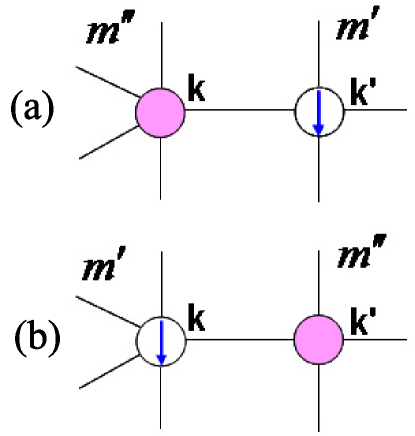
To further understand the nontrivial effect of the nonequilibrium diffusion on nucleation, we will evaluate the average energy change due to the diffusion process between an impurity and a spin. To begin, let us consider such a process on a link connecting a -degree node and a -degree node. As shown in Fig.4(a), an impurity occupied -degree node will exchange its present position with a spin of -degree node. The reverse process is shown in Fig.4(b). Let and denote the probability of a -degree node occupied by an impurity and the average magnetization of a -degree node occupied by a spin, respectively. For a spin node on degree uncorrelated networks, the average magnetization of a randomly chosen neighboring node is written as,
| (4) |
While for an impurity node, the average magnetization of a randomly chosen neighboring node is written as
| (5) |
where the subscript other than is based on the consideration that there is no any interaction between an impurity node and its neighbors. For the case of Fig.4(a), the energy change is written as
| (6) |
Analogously, for the case of Fig.4(b)
| (7) |
The energy change due to a diffusing exchange taking placing on a link can be expressed as
| (8) |
where is the diffusion rate of an impurity from -degree node to -degree node. According to our model, it can be expressed as
| (9) |
Assuming the diffusion is quasi-static process that satisfies the detailed balance conditions,
| (10) |
The requirement can lead to the expression of ,
| (11) |
Averaging over all possible links on networks, one arrives at the average energy change due to a nonequilibrium diffusion process,
| (12) |
where is the probability that a randomly chosen link to connect a pair of nodes with degree and .
Next we will calculate the average magnetization using heterogeneous mean-field theory. Following Ref.[47], one has
| (13) |
Substituting Eq.(13) with Eqs.(4-5), we arrive at the self-consistent formulations of and that can be numerically calculated.
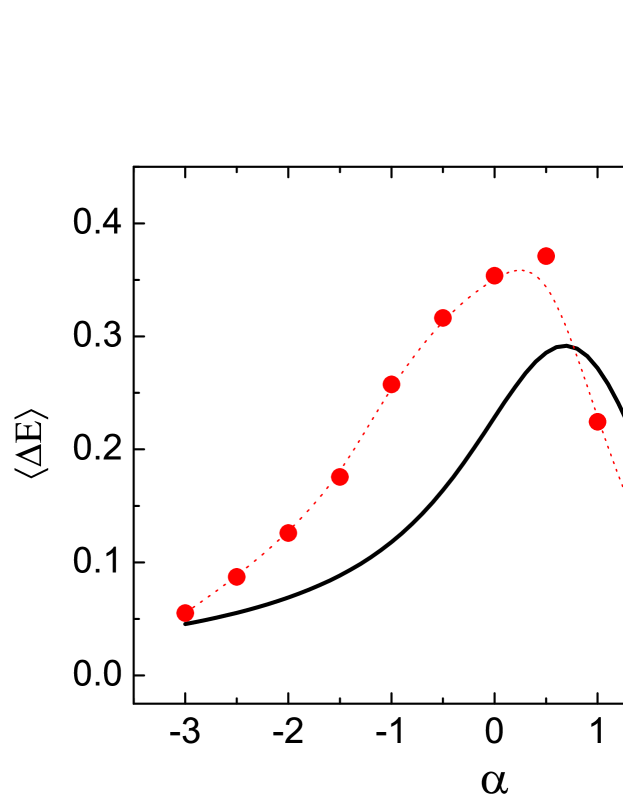
Figure 5 shows the results of as a function of , where the solid line denotes the result obtained from Eq.(12), and the symbols that of MC simulations. Clearly, the theory can reproduce qualitatively well the main characteristic: there exists an optimal motion bias where the average energy change reaches the maximum. Furthermore, it is found that are always larger than zero for any motion bias , which indicates that the impurity’s mobility can always facilitate the barrier-crossing nucleation process, akin to the drag effect of nonequilibrium thermodynamic forces conjugated to the exchange of impurities and spins.
4 Conclusions
In summary, we have studied the heterogeneous nucleation of a non-equilibrium Ising model with mobile impurities on complex networks. By introduced a tunable parameter , the impurities can perform three different bias motions: means that the impurities prefer to visit the high-degree nodes, the low-degree nodes, and recovers to completely random motion. Interestingly, it is found that the nucleation rate is not a monotonic function of for small number of impurities, i.e., there exists an optimal value of , leading to the fastest nucleation rate. Especially, the optimal value of the controlled parameter does not change with the variation of the diffusion rate. To qualitatively understand the underlying mechanism of such a phenomenon, we have performed heterogeneous mean-field analysis. Furthermore, we have used the FFS method and analyzed the nucleating clusters, and found that for different preferences of impurities motion, the nucleating clusters show the distinct features along the pathways. On the one hand, for random motion, the largest nucleating cluster dominates the nucleation, and the average degree of the nodes inside nucleating clusters grows rapidly at first, while for motion to the high-degree nodes or to the low-degree nodes, they grow slowly at the very beginning following by a relatively fast increasing. On the other hand, the number of nucleating clusters for the former is less than that of the latter, especially they decreases to the same magnitude at the formation of the critical nucleus. These distinct features may mean different microscopic mechanisms driving the system towards nucleation. Since heterogeneous nucleation is essential for many dynamical processes on real-world scenarios, and mobility is a ubiquitous feature of real systems, our study may provide a valuable understanding for many non-equilibrium phase transitions taking place in networked systems and for effective controlling strategy to the rate of such processes.
Acknowledgements.
This work was supported by the National Basic Research Program of China (2013CB834606) and by the National Natural Science Foundation of China (Grants No. 21125313, 11205002, 21473165 and No. 11475003). C.S.S. was also supported by Anhui Provincial Natural Science Foundation (Grant No.1408085MA09).References
- [1] \NameKashchiev D. \BookNucleation: Basic Theory with Applications (Butterworths-Heinemann, Oxford) 2000.
- [2] \NameGránásy L. Iglói F. \REVIEWJ. Chem. Phys.10719973634.
- [3] \NameAsanithi P., Saridakis E., Govada L., Jurewicz I., Brunner E. W., Ponnusamy R., Cleaver J. A. S., Dalton A. B., Chayen N. E. Sear R. P. \REVIEWACS Appl. Mater. Interfaces120091203.
- [4] \NameLockner D. A., Byerlee J. D., Kuksenko V., Ponomarev A. Sidorin A. \REVIEWNature (London)350199139.
- [5] \NameGarchimartin A., Guarino A., Bellon L. Ciliberto S. \REVIEWPhy. Rev. Lett.7919973202.
- [6] \NameJohnson G., Melćuk A. I., Gould H., Klein W. Mountain R. D. \REVIEWPhy. Rev. E5719985707.
- [7] \NameFersht A. R. \REVIEWProc. Natl. Acad. Sci. USA92199510869.
- [8] \NameAllen R. J., Valeriani C., Tanase-Nicola S., ten Wolde P. R. Frenke D. \REVIEWJ. Chem. Phys.1292008134704.
- [9] \NameSear R. P. \REVIEWJ. Phys. Chem. B11020064985.
- [10] \NamePage A. J. Sear R. P. \REVIEWPhys. Rev. Lett.972006065701.
- [11] \NameSear R. P. \REVIEWJ. Chem. Phys.1292008164510.
- [12] \NamePan A. C. Chandler D. \REVIEWJ. Phys. Chem. B108200419681.
- [13] \NameAcharyya M. Stauffer D. \REVIEWEur. Phys. J. B51998571.
- [14] \NameShneidman V. A., Jackson K. A. Beatty K. M. \REVIEWJ. Chem. Phys.11119996932.
- [15] \NameWonczak S., Strey R. Stauffer D. \REVIEWJ. Chem. Phys.11320001976.
- [16] \NameBrendel K., Barkema G. T. van Beijeren H. \REVIEWPhys. Rev. E712005031601.
- [17] \NameWinter D., Virnau P. Binder K. \REVIEWPhys. Rev. Lett.1032009225703.
- [18] \NameRyu S. Cai W. \REVIEWPhys. Rev. E812010030601(R).
- [19] \NameRyu S. Cai W. \REVIEWPhys. Rev. E822010011603.
- [20] \NameAlbert R. Barabási A.-L. \REVIEWRev. Mod. Phys.74200247.
- [21] \NameDorogovtsev S. N. Mendes J. F. F. \REVIEWAdv. Phys.5120021079.
- [22] \NameNewman M. E. J. \REVIEWSIAM Review452003167.
- [23] \NameChen H., Shen C., Hou Z. Xin H. \REVIEWPhys. Rev. E832011031110.
- [24] \NameShen C., Chen H., Ye M. Hou Z. \REVIEWChaos232013013112.
- [25] \NameChen H. Hou Z. \REVIEWPhys. Rev. E832011046124.
- [26] \NameColizza V., Pastor-Satorras R. Vespignani A. \REVIEWNat. Phys.32007276.
- [27] \NameColizza V. Vespignani A. \REVIEWPhys. Rev. Lett.992007148701.
- [28] \NameFrasca M., Buscarino A., Rizzo A., Fortuna L. Boccaletti S. \REVIEWPhys. Rev. Lett.1002008044102.
- [29] \NameFujiwara N., Kurths J. Díaz-Guilera A. \REVIEWPhys. Rev. E832011025101(R).
- [30] \NameGómez-Gardeñes J., Nicosia V., Sinatra R. Latora V. \REVIEWPhys. Rev. E872013032814.
- [31] \NameUriua K., Morishita Y. Iwasa Y. \REVIEWProc. Natl. Acad. Sci. USA10720104979 C4984.
- [32] \NamePrignano L., Sagarra O. Díaz-Guilera A. \REVIEWPhys. Rev. Lett.1102013114101.
- [33] \NameShen C., Chen H. Hou Z. \REVIEWEurophys. Lett.102201338004.
- [34] \NameBalcan D. Vespignani A. \REVIEWNat. Phys.72011581.
- [35] \NameReichenbach T., Mobilia M. Frey E. \REVIEWNature44820071046.
- [36] \NameAllen R. J., Warren P. B. ten Wolde P. R. \REVIEWPhy. Rev. Lett.942005018104.
- [37] \NameDorogovtsev S. N., Goltsev A. V. Mendes J. F. F. \REVIEWPhys. Rev. E662002016104.
- [38] \NameHerrero C. P. \REVIEWPhys. Rev. E692004067109.
- [39] \NameGiuraniuc C. V., Hatchett J. P. L., Indekeu J. O., Leone M., Castillo I. P., Schaeybroeck B. V. Vanderzande C. \REVIEWPhys. Rev. E742006036108.
- [40] \NameLee S. H., Ha M., Jeong H., Noh J. D. Park H. \REVIEWPhys. Rev. E802009051127.
- [41] \NameHooyberghs H., Schaeybroeck B. V., Moreira A. A., José S. Andrade J., Herrmann H. J. Indekeu J. O. \REVIEWPhys. Rev. E812010011102.
- [42] \NameLandau D. P. Binder K. \BookA Guide to Monte Carlo Simulations in Statistcal Physics (Cambridge University Press, Cambridge) 2000.
- [43] \NameValeriani C., Allen R. J., Morelli M. J., Frenkel D. ten Wolde P. R. \REVIEWJ. Chem. Phys.1272007114109.
- [44] \NameAllen R. J., Frenkel D. ten Wolde P. R. \REVIEWJ. Chem. Phys.1242006024102.
- [45] \NameAllen R. J., Valeriani C. ten Wolde P. R. \REVIEWJ. Phys.: Condens. Matter212009463102.
- [46] \NameBarabási A.-L. Albert R. \REVIEWScience2861999509.
- [47] \NameBianconi G. \REVIEWPhys. Lett. A3032002166.