Discovery of New X-ray Sources near the Unidentified Gamma-ray Source HESS J1841-055
Abstract
HESS J1841055 is a diffuse unidentified gamma-ray source with the size of . No conclusive counterpart in other wavelengths has so far detected. To search for X-rays responsible for the TeV emission, the Suzaku observations were conducted, which covered a half region of the HESS source. In the soft band (0.5–2.0 keV), we discovered a diffuse emission, Suzaku J1840.20552, with the size of . Since its spectrum was fitted by an optically thin thermal plasma model, Suzaku J1840.20552 is likely to be a supernova remnant. We also discovered an extended source, Suzaku J1840.20544, in the hard band (2.0–8.0 keV) with an emission line at 6.1 keV. From the spectral feature and large interstellar absorption, this source is likely to be a cluster of galaxies behind the Galactic plane at the red-shift of 0.09. The other diffuse source spatially overlaps with the SNR candidate G26.60.2, which shows a non-thermal dominant spectrum. Since no other candidate is found in the hard X-ray band, we infer that these largely extended sources could be possible counterparts of HESS J1841055.
keywords:
X-ray , Interstellar medium , HESS J18410551 Introduction
HESS J1841055 is a largely extended TeV gamma-ray source with the size of discovered by H.E.S.S. in the Galactic plane survey (Aharonian et al., 2008). With the ARGO-YBJ experiment, Bartoli et al. (2013) also detected a TeV gamma-ray emission from the position which is coincident with HESS J1841055. Fermi-LAT detected GeV gamma-rays from the HESS J1841-055 region (Neronov et al., 2010; Acero et al., 2013).
Aharonian et al. (2008) suggested that two sources are possible counterparts, at least partly, of HESS J1841055. One is G 26.60.1, which was detected by ASCA (Bamba et al., 2003). Bamba et al. (2003) assumed that G 26.60.1 is a non-thermal supernova remnant (SNR) due to the hard X-ray spectrum (the photon index of ). The other is AX J1841.00536, a supergiant fast X-ray transient (SFXT; Negueruera et al. 2006; Sguera et al. 2005). AX J1841.00536 exhibits many flares with time-scales from a few hundred seconds to a few hours with the large flux range of – erg s-1 cm-2 (Romano et al., 2009; Bozzo et al., 2011; Nobukawa et al., 2012). Sguera et al. (2009) also suggested that AX J1841.00536 could be responsible for at least a fraction of the entire gamma-ray emission. However, no conclusive fact to support the origin for the full emission from HESS J1841055 in any other wavelengths has been found.
In order to search for counterparts of HESS J1841055 in X-ray, we investigated the region around HESS J1841055 with Suzaku. Although Suzaku covered only the southern half region of HESS J1841055, we found three diffuse sources. One is a soft and largely diffuse source with a thermal spectrum. Another is small but has an extended hard X-ray emission with the emission line at 6.1 keV. The other is a largely extended source with a non-thermal spectrum. In this paper, we mainly report these new sources and discuss the possible relation to the gamma-ray emission.
2 Observation and Data reduction
We performed observations in the HESS J1841055 region with the X-ray Imaging Spectrometer (XIS; Koyama et al. 2007) onboard the Suzaku satellite (Mitsuda et al., 2007) in March 2011 (ObsIDs=505088010, 505089010, and 505090010). We also used the archive data of ObsID504052010 (PI, N. Kawai). The observation information is listed in table 1.
The XIS consists of four X-ray CCD cameras which cover the energy range of 0.2–12 keV. Three of the cameras (XIS 0, 2, and 3) have front-illuminated devices and the remaining one (XIS 1) contains a back-illuminated device. All of the cameras are placed on the focal planes of the X-Ray Telescopes (XRTs; Serlemitsos et al. 2007). The whole region of XIS 2 and one-fourth of XIS 0 have been out of function since 2006 November and 2009 June, respectively, and hence the data from the remaining devices were used. The XIS was working with the normal clocking mode without window option during all observations.
We used the software packages HEAsoft v6.15.1 and XSPEC v12.8 for the data reduction and analysis. The XIS event files were converted to pulse-invariant channels using the xispi software and the calibration database (CALDB) version 2013-12-31. We excluded events during the South Atlantic Anomaly passages, at elevation angles below 5∘ from the night Earth rim, and at elevation angles below 20∘ from the sunlit Earth rim. Response file (arf) and redistribution file (rmf) for spectral fittings were produced by xissimarfgen (Ishisaki et al., 2007) and xisrmfgen, respectively. The non-X-ray background (NXB) for the XIS was generated by xisnxbgen (Tawa et al., 2008) and was subtracted from the data before analyses in the following sections.
Errors in this paper are quoted at a 90% confidence level unless otherwise specified.
| Obs. ID | Obs. Date | (R.A., Dec.)J2000 | Exposure time |
|---|---|---|---|
| 504052010 | 2009-Apr-13 | (, ) | 41.1 ks |
| 505088010 | 2011-Mar-25 | (, ) | 49.7 ks |
| 505089010 | 2011-Mar-26 | (, ) | 50.0 ks |
| 505090010 | 2011-Mar-27 | (, ) | 49.6 ks |
3 Result & Discussion
3.1 X-ray image
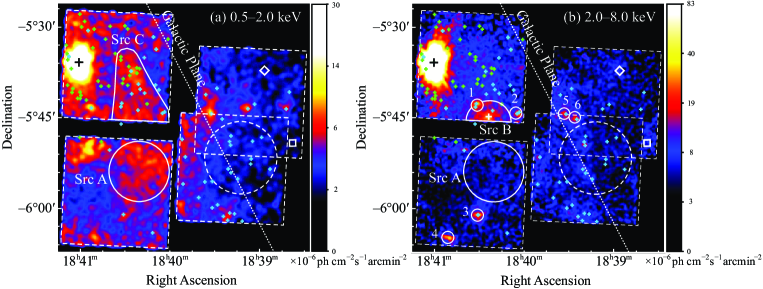
In figure 1, we show the X-ray images in the soft (0.5–2.0 keV) and hard (2.0–8.0 keV) bands. Vignetting of the XRTs and the difference of exposure times among the four observations are taken into account. The brightest source marked with the black cross in both of the images is the SFXT AX J1841.00536 (Nobukawa et al., 2012). The light blue crosses indicate point sources which were detected by previous observations with Chandra (Evans et al., 2010) while the light green crosses are for XMM-Newton111http://xmmssc-www.star.le.ac.uk/Catalogue/.
Although we find a largely-extended emission in the soft X-ray band, it is not clear only from figure 1a whether this extended emission is one simple diffuse source or a mix of diffuse emissions. In fact, the extended emission in the northeast field may be contaminated by many point sources as are observed by Chandra and XMM-Newton. The southeast field is relatively free from point sources within the detection limit of Chandra. We, therefore, separately investigated a diffuse emission in the southeast field, Src A (section 3.3) and that in the northeast field, Src C (section 3.5).
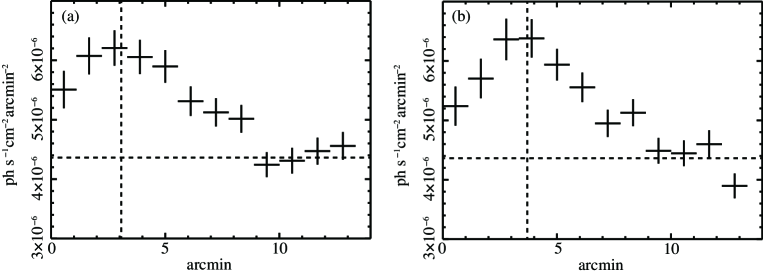
To see the spatial structure of Src A, we show the projected profile in figure 2. We see a real extended structure by . The center position is , and hence Src A is referred to as Suzaku J1840.20552 (the solid circle in figure 1a). Whether Src A is more extended to the northeast field (Src C) or not is unclear due to contamination of many point sources in Src C (see section 3.5)
No largely extended emission is found in the hard band (figure 1b). Instead, the source marked with the solid semi-ellipse in figure 1b (Src B) seems to be slightly extended compared to the nearby point-like source numbered 1. The center position of the ellipse is , and hence Src B is referred to as Suzaku J1840.20544. This source is discussed in section 3.4.
3.2 The Galactic ridge background
In the following spectral analysis for the largely diffuse sources, we used the background spectrum taken from the dashed-circle in figure 1, because no excess X-ray is found from this region. The background region is located on the Galactic plane at and is dominated by the Galactic ridge X-ray emission (GRXE; Worral et al. 1982; Koyama et al. 1986). Uchiyama et al. (2013) reported that the GRXE spectrum is represented by two optically-thin thermal plasma models with different temperatures (1.3 keV and 6.6 keV) and a power-law () plus a neutral Fe K line at 6.4 keV from cold interstellar clouds or mediums in addition to the cosmic X-ray background (CXB) and the foreground thermal emission.
Using the GRXE model with the same parameters as those in Uchiyama et al. (2013) except for the absorption column density and the normalization of each component, we successfully made the spectral fitting for the background (d.o.f.). We obtained the absorption column density of cm-2. This is consistent with those in other regions at –20∘; – cm-2 at (Yasumi et al., 2014) and – cm-2 at (Takata et al., 2015).
3.3 Diffuse Soft X-ray source: Src A
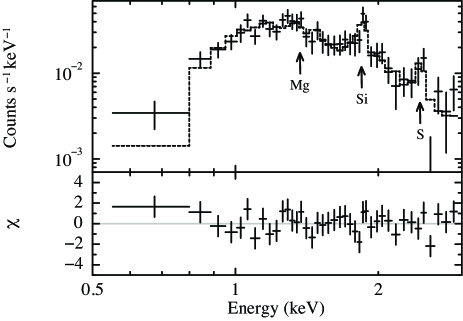
The X-ray spectrum of Src A was made from the solid circle in figure 1a. Figure 3 shows the background-subtracted spectrum. Since K lines of Mg, Si, and S are detected, the spectrum may be mainly dominated by an optically thin thermal plasma. We examined the spectrum with a model of absorbed collisional ionization equilibrium (CIE) plasma (vapecphabs in XSPEC), and obtained an acceptable fit (/d.o.f=35/35). The best-fit spectrum model is given by the dotted histogram in figure 3 while the best-fit parameters are summarized in table LABEL:src2fit.
| Component | Parameter | Value | |
| Model: vapec phabs | |||
| Absorption† | Column density () | ( cm-2 | |
| CIE plasma | Temperature () | keV | |
| Abundance (solar) | Mg | ||
| Si | |||
| S | |||
| Emission measure‡ | ( cm-5 | ||
| Flux (0.5–2.0 keV) | erg s-1 cm-2 | ||
| d.o.f. | 35/35 | ||
∗Errors are at the 90% confidence level.
†Photoelectric absorption.
‡Volume emission measure , where
, , , and are
the source distance, electron and atomic hydrogen densities, and the plasma volume, respectively.
We extracted the X-ray spectrum from the purely diffuse soft X-ray region (Src A) and ignored a possible extension to the northeast field (Src C), because the soft X-ray in Src C may be contaminated by many faint point sources of Chandra and XMM-Newton. Therefore, the obtained flux of Src A should be regarded as a lower-limit for a soft X-ray source.
The flux of the Src A region (raw flux) in 0.5–2.0 keV is erg s-1 cm-2 while that of the background region is erg s-1 cm-2. The diffuse excess of Src A is far larger than possible fluctuations of the GRXE. Moreover, the best-fit absorption column density () is different between Src A and the GRXE ( cm-2 and cm-2). Thus Src A is a real diffuse source with the significance level of 24 .
On the other hand, we found no significant difference in the hard band flux (2.0–10 keV): the raw fluxes of the source and background regions are erg s-1 cm-2 and erg s-1 cm-2, respectively.
Since the absorption column density is less than that in the background spectrum of the GRXE, Src A may be located at the near-side of the Galactic ridge. Using the ratio of , we estimate the source distance to be 3–4 kpc. Then the electron density and thermal energy are 0.2 cm-3 and erg (as a lower-limit), respectively.
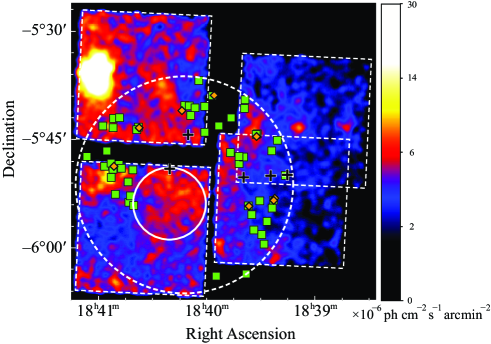
From the thermal spectrum, Src A is likely either an SNR, an H II region, or a star cluster. Using the SIMBAD database222http://simbad.u-strasbg.fr/simbad, we found many radio sources and H II regions in the radius circle around Src A as shown in figure 4. However, no H II region coincides with the position and size of Src A. No stellar cluster has been reported.
The X-ray plasma seems to be surrounded by the H II regions and the radio sources. Since five B-type stars exist in Src A and its 15′ surrounding, it is presumed that several massive stars were produced in the past star formation at the cite. Src A is therefore most likely an SNR that was produced by the explosion of a massive star. The thermal energy is also consistent with an SNR. Although no radio shell indicating the forward shock at the SNR surface has been reported so far, many radio sources may be confused with a shell structure, if any.
3.4 Hard X-ray Source: Src B
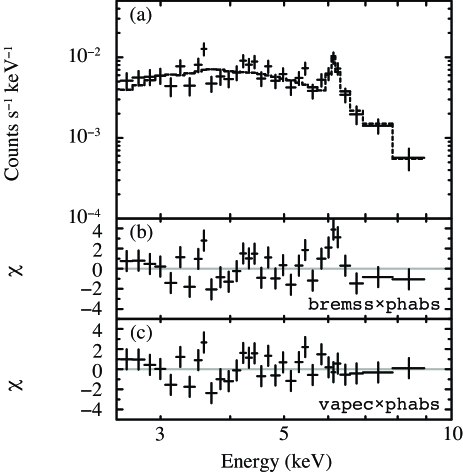
The X-ray spectrum of Src B was made from a semi-ellipse with a major axis of and a minor axis of . A nearby point source region (referred to as number 1 in figure 1b) was excluded. We made a background spectrum from the same region as Src A (the dashed circle in figure 1b). Figure 5a shows the background-subtracted spectrum for Src B.
Neither a simple bremsstrahlung nor a power-law model with an interstellar absorption (bremsphabs or powerlawphabs) gives a good fit with the reduced chi-squared values of 74/29 and 75/29, respectively. The large residual is a line-like structure at keV (figure 5b). We, therefore, added a narrow Gaussian line and obtained a better fit with /d.o.f.. The source and background fluxes in 2.0–10 keV are ( erg s-1 cm-2 and ( erg s-1 cm-2, respectively. Thus the significance is 9 . The center energy and equivalent width of the Gaussian are keV and eV, respectively. The line detection is at the significance level of 5.7 .
No atomic line at this energy in the rest-frame is found. Since the most intense emission line in the 5–7 keV band is a K line of Fe, a possible origin would be a red-shifted Fe-K line. For a neutral Fe K line at 6.4 keV, the redshift is 0.04 while for a He-like Fe K line at 6.7 keV, is 0.09.
We finally fitted the spectrum with an absorbed CIE plasma (vapecphabs) with a free parameter of a redshift (see figure 5c). The redshift is found to be . The best-fit parameters are summarized in table 3.
| Component | Parameter | Value |
|---|---|---|
| Model: vapec phabs | ||
| Absorption† | Column density () | cm-2 |
| CIE plasma | Temperature () | keV |
| Fe Abundance (solar) | ||
| Red-shift () | ||
| Flux (2.0–10 keV) | erg s-1 cm-2 | |
| d.o.f. | 45/27 | |
∗Errors are at the 90% confidence level.
†Photoelectric absorption.
The obtained absorption column density of cm-2 is twice as large as that of the GRXE of (3.30.5) cm-2. Thus together with the redshifted Fe-K line, Src B is likely an extragalactic source; either a cluster of galaxies (CG) or an active galactic nucleus (AGN).
In order to distinguish these two possibilities, we investigate whether Src B is extended or not. We made an intensity profile around Src B along the right ascension in figure 1b, and fitted the profile with a Gaussian plus constant. The best-fit width of the Gaussian is (at 1 error), which is significantly larger (by confidence level) than the PSF size of obtained from the nearby point source (numbered 1 in figure 1b). Thus we conclude that Src B is extended with the Gaussian size of in error (after subtracting the PSF).
We also checked the XMM-Newton catalog and found an extended source as a counterpart of Src B, 3XMM J184023.9054445, whose position is indicated by a white cross mark at the center of Src B (figure 1b). Its extension size is in the beta model, which supports our result. Thus Src B is likely a CG rather than an AGN.
In addition, the observed equivalent width of eV is far larger than the typical value of AGNs (50–200 eV; Ricci et al. 2014) but is equal to that of CGs with the Fe abundance of 0.5 solar (Fukazawa et al., 2000; Matsushita et al., 2011).
A CG behind the Galactic plane with high dense gas cannot be observed in optical. Only two CGs on the Galactic plane (, ) have been reported so far (Nevalainen et al. 2001; Yamauchi et al. 2011). Since a CG does not absorb X-rays by itself, the measured absorption column density provides that of the whole of our Galaxy.
We summarize the positions and absorption column density values of the three sources including this work in table 4. Although we have only three samples, we find that the closer to the Galactic center, the absorption column density increases. Since more than ten thousand CGs have been discovered in the whole sky, more than one hundred CGs would exist behind the Galactic plane. If the number of such samples increases, we will be able to measure the amount of matter through the whole of our Galaxy.
3.5 Complex diffuse source Src C and Point Sources
In addition to Src A, the soft X-ray excess is found from the half region of the northeast field (Src C: the triangle-like region in figure 1a). This position is almost overlapped with the hard X-ray source G26.60.1. Bamba et al. (2003) reported that the 0.7–10 keV flux of G26.60.1 is erg s-1 cm-2.
We made the X-ray spectra from Src C and 6 point sources in the hard X-ray band (number 1–6 in figure 1b). The spectrum from Src C includes the three discrete sources: Src B, point source 1 and 2. The background spectrum is the same as that of Src A and Src B. After subtracting the background spectrum, we fitted the spectra with an absorbed power-law and estimated the observed fluxes in the 0.5–2.0 keV and 0.5–10 keV bands. The results are listed in table 5. We also summarize in table 5 the fluxes of Src A and Src B, and the integrated flux of point sources in the Src C region detected by Chandra and XMM-Newton.
| Region | 0.5–2.0 keV | 0.5–10 keV |
|---|---|---|
| Diffuse sources observed by Suzaku | ||
| Src A | ||
| Src B | ||
| Src C | ||
| Integrated flux of point sources in Src C † | ||
| Point sources detected by Suzaku‡ | ||
| point source 1 | ||
| point source 2 | ||
| point source 3 | ||
| point source 4 | ||
| point source 5 | ||
| point source 6 | ||
∗ The units are erg s-1 cm-2. The interstellar absorption is not corrected.
† Point sources with Chandra and XMM-Newton.
‡ See figure 1b for numbering.
In the soft X-ray band of 0.5–2.0 keV, the excess emission in Src C is erg cm-2 s-1. The summed flux of the resolved point sources in this region detected by Chandra and XMM-Newton is erg cm-2 s-1. Thus no large contribution would be due to the integrated point sources, and a significant fraction of Src C would be due to Src A; Src A may be elongated to the Src C region as we noted in section 3.3.
3.6 Possible X-ray counterparts of HESS J1841055
The X-ray flux (0.7–10 keV) of G26.60.1 observed by ASCA was reported to be erg cm-2 s-1 (Bamba et al., 2003). This is consistent with the 0.5–10 keV flux of Src C. The flux of the integrated point sources observed by Chandra and XMM-Newton in the hard band is erg cm-2 s-1. After subtraction of Src B and point source 1 and 2, the significant fraction of Src C (7.7 erg cm-2 s-1) is due to diffuse emissions, which may be possible counterparts of HESS J1841055. The flux ratio of gamma-ray and X-ray is ( erg cm-2 s-1 for HESS J1841055; Aharonian et al. 2008). This ratio is consistent with a hadronic scenario (Yamazaki et al., 2006).
The brightest X-ray source in the HESS J1841055 region is a SFXT, AX J1841.00536. Since this source is a point source while HESS J1841055 is largely extended, the SFXT would only locally and partially responsible for the high energy gamma-ray emission of HESS J1841055 (Sguera et al., 2009).
Four pulsars are found near HESS J1841055. Two of them, PSR J18380549 and PSR J18380537, are in our X-ray images. PSR J18380537 is a young gamma-ray pulsar (Pletsch et al., 2012) with the spin-down luminosity of erg s-1. This pulsar, however, is largely offset from the main body of HESS J1841055, and hence could be at most partial (or local) origin of the TeV emission. In addition, no significant X-ray is found from the positions of PSR J18380549 and PSR J18380537 (Pletsch et al., 2012) as shown in figure 1. The spin-down luminosity of PSR J18380549 is only erg s-1 (Hobbs et al., 2004), which is well below the required level for a counterpart of HESS J1841055.
Acknowledgement
The authors thank all of the Suzaku team members for their full support of the Suzaku project. KKN is supported by Research Fellowships of Japan Society for the Promotion of Science for Young Scientists. This study was also supported by JSPS and MEXT KAKENHI Grant Numbers 24740123 (MN), 20340043, 23340047, 25109004 (TGT), and 24540229 (KK).
References
References
- Acero et al. (2013) Acero, F., Ackermann, M., Ajello, M., et al. Constraints on the Galactic Population of TeV Pulsar Wind Nebulae Using Fermi Large Area Telescope Observations, The Astrophysical Journal, 773, 77, 2013.
- Aharonian et al. (2008) Aharonian, F., Akhperjanian, A. G., Barres de Almeida, U., et al., HESS very-high-energy gamma-ray sources without identified counterparts, Astronomy and Astrophysics, 477, 353–363, 2008.
- Bamba et al. (2003) Bamba, A., Ueno, M., Koyama, K., and Yamauchi S., Diffuse Hard X-Ray Sources Discovered with the ASCA Galactic Plane Survey, The Astrophysical Journal, 589, 253–260, 2003.
- Bartoli et al. (2013) Bartoli, B., Bernardini, P., Bi, X. J., et al., Observation of TeV Gamma Rays from the Unidentified Source HESS J1841055 with the ARGO-YBJ Experiment, The Astrophysical Journal, 767, 99, 2013.
- Bozzo et al. (2011) Bozzo, E., Giunta, A., Cusumano, G., et al., XMM-Newton observations of IGR J184100535: the ingestion of a clump by a supergiant fast X-ray transient, Astronomy and Astrophysics, 531, 130, 2011.
- Chatterjee et al. (2005) Chatterjee, S., Vlemmings, W. H. T., Brisken, W. F., et al., Getting Its Kicks: A VLBA Parallax for the Hyperfast Pulsar B150855, The Astrophysical Journal, 630, L61–L64, 2005.
- Evans et al. (2010) Evans, I. N., Primini, F. A., Glotfelty, K. J., et al., The Chandra Source Catalog, The Astrophysical Journal Supplement, 189, 37–82, 2010.
- Fukazawa et al. (2000) Fukazawa, Y., Makishima, K., Tamura, T., et al., Statistical properties of metal abundances of the intracluster medium in the central region of clusters, Monthly Notices of the Royal Astronomical Society, 313, 21–31, 2000.
- Hobbs et al. (2004) Hobbs, G., Faulkner, A., Stairs, I. H., et al., The Parkes multibeam pulsar survey - IV. Discovery of 180 pulsars and parameters for 281 previously known pulsars, Monthly Notices of the Royal Astronomical Society, 352, 1439–1472, 2004.
- Ishisaki et al. (2007) Ishisaki, Y., Maeda, Y., Fujimoto, R., et al., Monte Carlo Simulator and Ancillary Response Generator of Suzaku XRT/XIS System for Spatially Extended Source Analysis, Publications of the Astronomical Society of Japan, 59, S113–S132, 2007.
- Koyama et al. (1986) Koyama, K., Makishima, K., Tanaka, Y., Tsunemi, H., Thermal X-ray emission with intense 6.7-keV iron line from the Galactic ridge, Publications of the Astronomical Society of Japan, 38, 121–131, 1986.
- Koyama et al. (2007) Koyama, K., Tsunemi, H., Dotani, T., et al., X-Ray Imaging Spectrometer (XIS) on Board Suzaku, Publications of the Astronomical Society of Japan, 59, S23–S33, 2007.
- Matsumoto et al. (2008) Matsumoto, H., Uchiyama, H., Sawada, M., et al., Discovery of Extended X-Ray Emission from an Unidentified TeV Source, HESS J1614-518, Using the Suzaku Satellite, Publications of the Astronomical Society of Japan, 60, S163–S172, 2008.
- Matsushita et al. (2011) Matsushita, K., Radial profiles of Fe abundance in the intracluster medium of nearby clusters observed with XMM-Newton, Astronomy and Astrophysics, 527, 134, 2011.
- Mitsuda et al. (2007) Mitsuda, K., Bautz, M., Inoue, H., et al., The X-Ray Observatory Suzaku, Publications of the Astronomical Society of Japan, 59, S1–S7, 2007.
- Negueruera et al. (2006) Negueruela, I., Smith, D. M., Reig, P., Chaty, S., and Torrejón, J. M. Supergiant Fast X-ray Transients: A New Class of High Mass X-ray Binaries Unveiled by INTEGRAL, in Proc. The X-ray Universe 2005, ed. A. Wilson (Noordwijk: ESA), 165, 2006.
- Neronov et al. (2010) Neronov, A. and Semikoz, D., Galactic sources of E100 GeV gamma-rays seen by Fermi telescope, arXiv:1011.0210, 2010.
- Nevalainen et al. (2001) Nevalainen, J., Lumb, D., dos Santos, S., et al., Discovery of an absorbed cluster of galaxies (XMMU J183225.4103645) close to the Galactic plane with XMM-Newton, Astronomy and Astrophysics, 374, 66–72, 2001.
- Nobukawa et al. (2012) Nobukawa, K. K., Nobukawa, M., Tsuru, T. G., and Koyama K., Suzaku Observation of the Supergiant Fast X-Ray Transient AX J1841.0-0536, Publications of the Astronomical Society of Japan, 64, 99, 2012.
- Pletsch et al. (2012) Pletsch, H. J., Guillemot, L., Allen, B., et al., PSR J18380537: Discovery of a Young, Energetic Gamma-Ray Pulsar, The Astrophysical Journal Letters, 755, L20, 2012.
- Ricci et al. (2014) Ricci, C., Ueda, Y., Ichikawa, K, et al., The narrow Fe K line and the molecular torus in active galactic nuclei: an IR/X-ray view, Astronomy and Astrophysics, 567, 142, 2014.
- Romano et al. (2009) Romano, P., Sidoli, L., Cusumano, G., et al., Monitoring supergiant fast X-ray transients with Swift: results from the first year, Monthly Notices of the Royal Astronomical Society, 399, 2021–2032, 2009.
- Serlemitsos et al. (2007) Serlemitsos, P. J., Soong, Y., Chan, K., et al., The X-Ray Telescope onboard Suzaku, Publications of the Astronomical Society of Japan, 59, S9–S21, 2007.
- Sguera et al. (2005) Sguera, V., Barlow, E. J., Bird, A. J., et al., INTEGRAL observations of recurrent fast X-ray transient sources, Astronomy and Astrophysics, 444, 221–231, 2005.
- Sguera et al. (2009) Sguera, V., Romero, G. E., Bazzano, A., et al., Dissecting the Region of 3EG J1837-0423 and HESS J1841-055 with INTEGRAL, The Astrophysical Journal, 697, 1194–1205, 2009.
- Takata et al. (2015) Takata, A., Nobukawa, M., Uchida, H., et al., X-Ray Study of the Supernova Remnant G337.20.7: Typing the Supernova Explosion, Submitted for Publications of the Astronomical Society of Japan, 2015.
- Tawa et al. (2008) Tawa, N., Hayashida, K., Nagai, M., et al., Reproducibility of Non-X-Ray Background for the X-Ray Imaging Spectrometer aboard Suzaku, Publications of the Astronomical Society of Japan, 60, S11–S24, 2008.
- Uchiyama et al. (2013) Uchiyama, H., Nobukawa, M., Tsuru, T. G., and Koyama, K., K-Shell Line Distribution of Heavy Elements along the Galactic Plane Observed with Suzaku, Publications of the Astronomical Society of Japan, 65, 19, 2013.
- Worral et al. (1982) Worrall, D. M., Marshall, F. E., Boldt, E. A., and Swank, J. H., HEAO 1 measurements of the galactic ridge, Astrophysical Journal, 255, 111–121, 1982.
- Yamauchi et al. (2011) Yamauchi, S., Bamba, A., and Koyama, K., A New Candidate of an X-Ray Luminous Cluster of Galaxies behind the Galactic Plane, Publications of the Astronomical Society of Japan, 63, S957–S961, 2011.
- Yamazaki et al. (2006) Yamazaki, R., Kohri, K., Bamba, A., et al., TeV -rays from old supernova remnants, Monthly Notices of the Royal Astronomical Society, 371, 1975–1982, 2006.
- Yasumi et al. (2014) Yasumi, M., Nobukawa, M., Nakashima, S. et al., Abundances in the ejecta of core-collapse supernova remnants G350.10.3 and G349.70.2, Publications of the Astronomical Society of Japan, 66, 689, 2014.