11email: rafal.wojaczynski@wp.pl, niedzwiecki@uni.lodz.pl, mitsza@uni.lodz.pl 22institutetext: Key Laboratory for Research in Galaxies and Cosmology, Shanghai Astronomical Observatory, Chinese Academy of Sciences, 80 Nandan Road, Shanghai 200030, China
22email: fgxie@shao.ac.cn
Gamma-ray activity of Seyfert galaxies and constraints on hot accretion flows
Abstract
Aims. We check how the Fermi/LAT data constrain the physics of hot accretion flows that are most likely present in low-luminosity AGNs.
Methods. Using a precise model of emission from hot flows, we studied the flow -ray emission resulting from proton-proton interactions. We explored the dependence of the -ray luminosity on the accretion rate, the black hole spin, the magnetic field strength, the electron heating efficiency, and the particle distribution. Then, we compared the hadronic -ray luminosities predicted by the model for several nearby Seyfert 1 galaxies with the results of our analysis of 6.4 years of Fermi/LAT observations of these AGNs.
Results. In agreement with previous studies, we find a significant -ray detection in NGC 6814. We were only able to derive upper limits for the remaining objects, although we report marginally significant () signals at the positions of NGC 4151 and NGC 4258. The derived upper limits for the flux above 1 GeV allow us to constrain the proton acceleration efficiency in flows with heating of electrons dominated by Coulomb interactions, which case is favored by the X-ray spectral properties. In these flows, at most % of the accretion power can be used for a relativistic acceleration of protons. Upper limits for the flux below 1 GeV can constrain the magnetic field strength and black hole spin value; we find these constraints for NGC 7213 and NGC 4151. We also note that the spectral component above GeV previously found in the Fermi/LAT data of Centaurus A may be due to hadronic emission from a flow within the above constraint. We rule out this origin of the -ray emission for NGC 6814. For models with a strong magnetohydrodynamic heating of electrons, the hadronic -ray fluxes are below the Fermi/LAT sensitivity even for the closest AGNs. In these models, nonthermal Compton radiation may dominate in the -ray range if electrons are efficiently accelerated and the acceleration index is hard; for the index , the LAT upper limits constrain the fraction of accretion power used for such an acceleration to at most %. Finally, we note that the three Seyfert 2 galaxies with high starburst activity NGC 4595, NGC 1068, and Circinus show an interesting correlation of their -ray luminosities with properties of their active nuclei, and we discuss this in the context of the hot flow model.
Key Words.:
Gamma rays: galaxies – Galaxies: Seyfert – Accretion, accretion disks – Black hole physics1 Introduction
Low-luminosity AGNs are probably powered by optically thin, hot accretion flows (for recent reviews see, e.g., Poutanen & Veledina, 2014; Yuan & Narayan, 2014). In the central parts of these flows, protons have energies above the threshold for pion production, and then the flows produce considerable -ray fluxes that are due to the decay of neutral pions. This property was noted early in the development of the accretion theory, for instance, by Shapiro et al. (1976), and was reported for the currently applied advection-dominated accretion flow (ADAF) models by Mahadevan et al. (1997). As estimated in Shapiro et al. (1976) and Oka & Manmoto (2003), the -ray luminosity, , of a flow surrounding a rapidly rotating black hole may be similar to its X-ray luminosity, . However, these studies neglected the general relativistic (GR) transfer of -ray photons as well as the absorption of these photons in the radiation field of the flow. Improved computations by Niedźwiecki et al. (2013), hereafter N13, showed that is at least an order of magnitude lower than if these effects are taken into account. The precise -ray emission model, however, has not been directly compared with current observational data.
No prominent -ray signal was found based on observations in the Fermi/LAT data from radio-quiet AGNs (e.g., Ackermann et al., 2012a, 2015), with a few notable exceptions. These include the three X-ray brightest Seyfert 2 galaxies, NGC 4945, NGC 1068, and Circinus (Lenain et al., 2010; Ackermann et al., 2012b; Hayashida et al., 2013). However, all three are composite AGN plus starburst systems, and it has not yet been definitively established whether their -ray emission is related with the starburst or with the AGN activity. The upper limits (UL) on the photon flux in the GeV range, derived in Ackermann et al. (2012a), typically constrain the luminosity ratio to and in several Seyferts to , which shows that the sensitivity of the Fermi/LAT surveys has reached the level at which predictions of the hadronic emission from hot accretion flows can be probed. This motivated the detailed comparison we present here.
We analyzed 6.4 years of Fermi-LAT data of nearby, low-luminosity AGNs, which means that we use a data set that is more than three years longer than the one used by Ackermann et al. (2012a) and is more than two years longer than the recent third catalog of AGNs detected by Fermi/LAT (Ackermann et al., 2015). A detailed comparison with the model requires a precisely determined black hole mass and intrinsic X-ray luminosity, therefore we focus here on several of the best-studied objects. As a particularly interesting case, we thoroughly examine the data from NGC 4151, for which the ratio of , found in Ackermann et al. (2012a), is the lowest of the 120 Seyfert galaxies considered in their work.
The physics of particle acceleration and heating in hot flows is not well understood. If non-thermal processes (e.g., magnetic reconnection) take place, a power-law-like distribution of particles may be expected. We here take into account predictions of hot flow models with proton distributions that include thermal and nonthermal components. We compute the -ray emission from accretion flows following the approach of N13. We use a GR hydrodynamic description of the flow combined with GR, Monte Carlo (MC) computations of radiative processes. We improve the model of N13 by refining the hydrodynamic solutions for flows whose proton distribution is dominated by a nonthermal component. We obtain solutions for a range of accretion rates that allows comparing our results with objects that have bolometric luminosities of between and of the Eddington limit. In Sect. 2 we discuss the dependence of the predicted on various parameters of the hot flow model, this has not been fully explored in precise computations before. In particular, N13 only considered a weak magnetic field and a fixed accretion rate. In Sect. 3 we present the results of our analysis of the Fermi/LAT data together with some results collected from the literature. Our main results are presented in Figs. 1 and 3. In Sect. 4 we briefly consider effects that are related with the nonthermal acceleration of electrons, in particular, their Compton emission in -rays. In Sect. 5 we discuss the general implications of our results for the physics of hot flows; we also briefly discuss hard spectral states of black hole binaries, where similar hot flows are most likely present.
2 Model of X- and -ray emission from hot flows
We applied the model developed in Niedźwiecki et al. (2012, 2013, 2014, 2015) and Xie et al. (2010). Here we briefly summarize its basic properties and some improvements we added here.
We considered a black hole that is characterized by its mass, , and angular momentum, , surrounded by a geometrically thick accretion flow with an accretion rate, . We defined the following dimensionless parameters: , , , where , is the gravitational radius and is the Eddington luminosity. We assumed a viscosity parameter, and the ratio of the gas pressure (electron and ion) to the magnetic pressure, .
The fraction of the dissipated energy that directly heats electrons is denoted by . We considered two limiting cases, one with , for which electron heating is dominated by Coulomb interactions at higher and compression at lower , and the other with , for which electron heating is dominated by magnetohydrodynamic (MHD) processes. Our results for are valid for all values of .
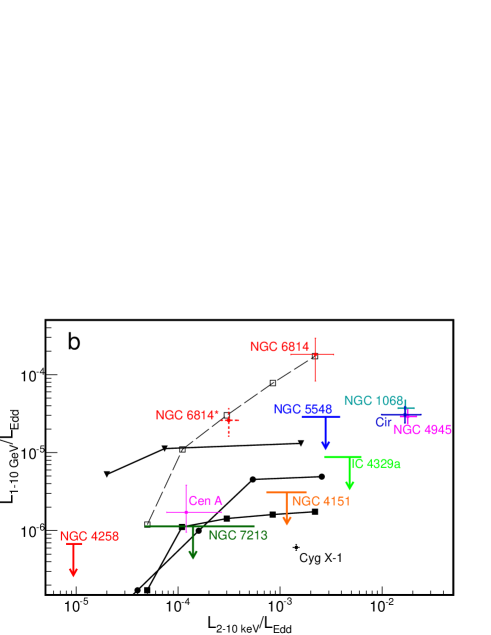
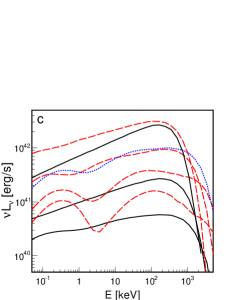
The Eddington ratio for a given energy range is denoted by with a relevant subscript, for example, and , where and are the luminosities in the 2–10 keV and 1–10 GeV range detected far away from the flow, that is, they are affected by GR transfer and absorption effects (only the dashed line in Fig. 1b shows the rest-frame luminosity). Similarly, the photon flux integrated over a given energy range is denoted by with a relevant subscript.
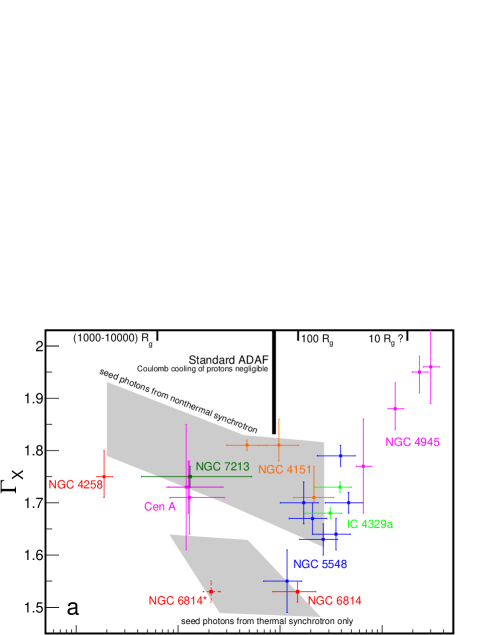
We found the global hydrodynamical solutions of the GR structure equations following Manmoto (2000) with minor improvements as described in Niedźwiecki et al. (2012). From this, we found the self-consistent electron temperature distribution, , for which the electron energy balance when global Compton cooling is achieved. This involved several iterations between the solutions of the electron energy equation and the MC Comptonization simulations. The procedure involves the assumption that the flow structure is unaffected by changes in , which constrains the range of exact solutions to (depending on the model, see also Yang et al. (2015)); the maximum is denoted by and is indicated by the thick vertical line in Fig. 1a. The Coulomb cooling of protons becomes strong at higher luminosities, and the flow is characterized by a dramatic dependence on even small changes of (when global Compton cooling is taken into account, cf. Xie et al. (2010)), which should lead to a collapse of the flow and formation of a standard cold disk at , with the transition radius, , dependent on .
All model results we present here were obtained for flows extending out to . We currently investigate the regime of . Although the results are rather preliminary, we find that (1) up to (indicated by the boundary of gray area in Fig. 1a) the hot flow can occupy the inner region within (this accretion flow geometry is supported by observations, as noted below); (2) up to this , the X-ray and the rest-frame -ray emission is correctly approximated by models with flows extending to large , for which we used the hydrodynamical solution neglecting the Coulomb cooling of protons; and (3) this model (with a flow extending to large ) may overestimate the -ray opacity (see below).
The minimum luminosity of flows that can be studied with our computational method, determining the lowest (denoted by ) in all presented models, is set by the requirement that the energy balance for electrons is determined by radiative cooling (rather than advection). Close to , the compressive heating of electrons dominates for , yielding an approximately constant radiative efficiency. This effect is crucial for assessing the -ray emission in objects with , and we return to this below.
The magnitude of the hadronic processes involves a significant uncertainty related to the distribution of proton energies. At the thermalization and cooling timescales for protons are much longer than the accretion timescale, and the distribution of protons is determined by poorly understood heating and acceleration processes. We considered three cases:
a thermal model T in which all protons have a Maxwellian distribution;
a nonthermal model N, where the total power is used to accelerate a small fraction of protons, for which we assume a power-law distribution, up to , and we assume that the other protons remain cold; the radius-dependent fraction of the protons with the power-law distribution is given by Eq. (7) in N13;
and a hybrid model H0.1 that has 10% of the energy content in nonthermal protons, denoted by , and 90% of the energy content in thermal protons; for the nonthermal protons we assume a power-law distribution like that in model N.
The assumptions of these models are identical to models T, N, and H in N13, except for the energy content of nonthermal component in model H, which was radius-dependent in N13, whereas here we assumed a radius-independent (indicated by the subscript in H0.1). For model N, however, we here take into account the effect neglected in N13, namely, a higher compressibility of the flow supported by the pressure of a nonthermal, relativistic proton gas, corresponding to the decrease of the adiabatic index from (for a thermal proton gas with typically subrelativistic temperatures) to 4/3. All results for model N in this work use the hydrodynamic solutions including this effect. The higher compressibility of the flow results in its smaller geometrical thickness and, hence, higher density (see also Fig. 4 in Popham & Gammie (1998)). For a given set of parameters, the density is higher by a factor of (for ) to (for ) in model N than in models T or H0.1.
We note that the dependence of the geometrical structure on in model N, which was discussed in Niedźwiecki et al. (2014), is almost completely reduced. The results presented for this model, with both components significantly contributing to the total pressure (i.e., protons and magnetic field), described by the adiabatic index 4/3, correspond to the maximum density, and hence the maximum Thomson depth, , as well as the maximum of the flow for a given set of , , and .
To compute the X-ray radiation, we took into account seed photons from nonthermal synchrotron emission, which is crucial to reach agreement for the model spectra with the observational data. As first noted by Yuan & Zdziarski (2004), ADAF models that follow the original formulation by Narayan & Yi (1995), that is, whose seed photons are provided by thermal synchrotron emission, predict too high and disagree with observational data for AGNs. Following the results of Niedźwiecki et al. (2015), we self-consistently included the synchrotron emission of pion-decay electrons for , whereas for we assumed that a fraction of the electron heating power was used for their nonthermal acceleration. In the latter case, we assumed and a monoenergetic injection of electrons at , for which synchrotron self-absorption is relatively unimportant (in Sect. 4.2 we release this assumption and consider the dependence on the electron acceleration distribution). The two gray regions are delineated in Fig. 1a to indicate the location of model solutions that include a significant nonthermal synchrotron radiation (upper panel) and solutions with only thermal synchrotron emission (lower panel), see Sect. 5 for a more detailed discussion.
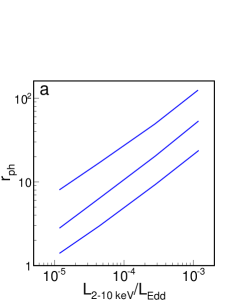
Using our MC Comptonization code, we tabulated the angular-, energy-, and location-dependent distribution of photons propagating in the central region. Then, to compute , we took into account the absorption of escaping -ray photons on pair creation in interactions with the (tabulated) target photons, strictly following N13. In Fig. 2a we show the size, , of the -ray photosphere (inside which the flow is opaque to -rays), which is determined as the radius of the emission point in the equatorial plane, from which the optical depth along the outward radial trajectory is . For radial directions close to the symmetry axis, values of determined by a similar condition are lower by a factor of . Results presented in this work, except for the dashed line in Fig. 3, correspond to spectra averaged over the observation angle, . A strong dependence on only occurs for a rapidly rotating black hole and only at low , at which the contribution from the innermost few is not attenuated by absorption. In other cases, the difference between -ray fluxes received at different does not exceed a factor of . The amount of attenuation due to absorption is illustrated by the dashed (rest-frame ) and solid (observed ) lines with squares in Fig. 1b; we note that at high the internal is higher by two orders of magnitude than observed.
The dependence of on is similar in all models (i.e., for different , or ). However, the scaling presented in Fig. 2a cannot be simply extrapolated to , at which this extrapolated would exceed the flow size of . In this case, the -ray opacity should be comparatively lower, at least in outer parts of the flow (i.e., close to ). In a flow extending to large the opacity for a -ray photon escaping from is dominated by head-head interactions with X-ray photons produced at . For photons escaping from the outer parts of a flow contained within , the opacity is dominated by much less efficient head-tail interactions with X-ray photons produced at .
Below we summarize the dependence of on various parameters that is relevant for the comparison presented in Sect. 3. For thermal protons, the bulk of the hadronic radiation is emitted in the 0.1-1 GeV range. The presence of nonthermal protons is reflected in the production of photons with GeV, with a power-law spectrum for a power-law proton distribution. We consider these two regimes separately.
2.1 Thermal protons: vs , and
The rate of pion production depends on the number of protons with energies above the pion production threshold. For the thermal distribution of protons, this rate is extremely sensitive to the proton temperature, . The pion production rate is low for K and negligible for K. The highest , and accordingly the highest , can be expected for flows with large and and small . The maximum that can be observed for thermal protons, with for between and , is shown by the line with squares in Fig. 3. In models with , or , is smaller at least by a factor of several, and even by orders of magnitude at ; in all these cases, the model predictions are below the Fermi ULs discussed in Sect. 3.
The dependence on these three parameters involves the following effects. In flows with smaller , a larger part of the accretion power is used to build up the magnetic field strength, therefore, the proton heating power is weaker. As a result, for the proton temperature is by a factor of lower than for . The related decrease of is illustrated in Fig. 3; for and , only exceeds K at , hence, at the -ray emission is strongly attenuated by absorption. The increase of yields the increase of electron heating at the expense of the proton heating, and it therefore obviously results in the decrease of the ratio. For the decreasing , a decreasing fraction of the accreted rest-energy is dissipated, therefore, decreases. In the extreme case of and , weakly exceeds K only close to the event horizon, and no hadronic emission can be expected.
At photons with GeV may escape from the ergosphere (the extremely relativistic region located within ) and some specific effects of the Kerr metric can be observed. These are that gravitational focusing of the photon trajectories toward the equatorial plane enhances the flux received by edge-on observers. Furthermore, the increase of from 0.95 to 0.998 increases by a factor of ; at both values of give the same -ray production rate. Taking these effects into account, we show the estimated maximum that can be expected at by the dashed line in Fig. 3. For this is lower than , meaning that it corresponds to the regime where advection of electron energies dominates. This in turn means that the lowest point (for and ) is not based on a precise solution of our model; we used the scaling of radiative efficiency, , found in Xie & Yuan (2012) for low , to roughly estimate the X-ray luminosity.
2.2 Nonthermal protons: vs and
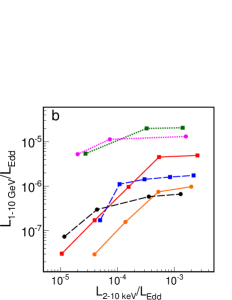
The dependence of on in models with is shown in Fig. 2b. Here the number of protons above the pion production threshold depends only linearly on the proton heating power. This means that is much less sensitive to both and than in model T. The difference between various models results mostly from different radiative efficiencies (of electrons), which establishes the relation between and , and accordingly the rest-frame . The efficiency is determined primarily by the value of . Obviously, also depends on . However, we note that the difference between models H0.1 and N does not simply involve the difference of by a factor of 10, corresponding to an increase of from 0.1 to 1. The difference is more complex because of the difference between the hydrodynamical solutions that underlie these models.
For , when the heating of electrons is dominated by Coulomb interactions (at larger ), the rest-frame -ray luminosity scales roughly linearly with the X-ray luminosity (both ). For this scaling, combined with the increase of with increasing , the observed is roughly constant while changes by more than an order of magnitude (see dotted and dashes lines in Fig. 2b). At low , when the compressive heating of electrons dominates, leading to , we note a fast decrease of with decreasing ; this is most clearly seen for model H0.1 with (dashed line with squares in Fig. 2b), in which compressive heating dominates for , corresponding to .
In models with , the radiative efficiencies are higher, therefore, is lower (because of the lower ) at a given than for . Hence, for we only present results for model N; for H0.1 the predicted -ray flux is below the sensitivity of LAT. For a constant , results in a fast decrease of with decreasing . Furthermore, for large , the radiative efficiency increases with , as a result, at a given is by a factor of several larger for than for (somewhat counter-intuitively).
The uncertain value of introduces the main uncertainty in testing the hadronic emission model by allowing for a range of at a given . However, different also correspond to different Thomson depths of the flow, which is reflected in the shape of the X-ray spectrum. The above uncertainty can therefore be reduced by using the X-ray spectral information. Figure 2c shows example X-ray spectra for large and small . Spectra of large- models in general deviate from a power-law shape at , that is, for with and with . For low- models, deviations from a power-law shape are weak down to (the bottom solid line in Fig. 2c).
We considered various proton distribution slopes between and 2.7. In all models, the lowest corresponds to (for , is larger by up to a factor 2), and conservatively we assumed this for Fig. 1b.
| Source | Refs. | |||
| (Mpc) | ||||
| IC 4329a | 1a𝑎aa𝑎a1.3;,2 | |||
| NGC 4151 | 3b𝑏bb𝑏b1.2;,4,4 | |||
| NGC 4258 | 5c𝑐cc𝑐c2;,6,7 | |||
| NGC 5548 | 8,9 | |||
| NGC 6814 | 10d𝑑dd𝑑d1.5.,9,11 | |||
| NGC 6814∗ | 10d𝑑dd𝑑d1.5.,12,11 | |||
| NGC 7213 | 0.014 | 13,14,11 | ||
| Cent. A | 15,16,17 | |||
| Circinus | 1.1–2.3 | 18,19,11 | ||
| NGC 1068 | 20,21,11 | |||
| NGC 4945 | 22,23,24 |
(1) Brenneman et al. (2014), (2) Markowitz (2009), (3) Lubiński et al. (2010), (4) Hönig et al. (2014), (5) Reynolds et al. (2009), (6) Miyoshi et al. (1995), (7) Herrnstein et al. (1999), (8) Brenneman et al. (2012), (9) Pancoast et al. (2015), (10) Walton et al. (2013), (11) Tully (1988), (12) Bentz et al. (2009), (13) Lobban et al. (2010), (14) Schnorr-Müller et al. (2014), (15) Fukazawa et al. (2011), (16) Cappellari et al. (2009), (17) Harris et al. (2010), (18) Arévalo et al. (2014), (19) Greenhill et al. (2003), (20) Bauer et al. (2014), (21) Greenhill et al. (1996), (22) Puccetti et al. (2014), (23) Greenhill et al. (1997), (24) Tully et al. (2009)
| Source | |||
|---|---|---|---|
| Energy range: 1–10 GeV | |||
| IC 4329a | 2.7 | ||
| IC 4329a | 2.1 | ||
| NGC 4151 a𝑎aa𝑎ausing the full data set of 6.4 years and including source S in the model; | 2.7 | ||
| NGC 4151a𝑎aa𝑎ausing the full data set of 6.4 years and including source S in the model; | 2.1 | ||
| NGC 4151b𝑏bb𝑏b-year data set (6.4 years without period S), source S not included; | 2.1 | ||
| NGC 4151c𝑐cc𝑐cdata from the first three years, S included in the model; | 2.1 | ||
| NGC 4151d𝑑dd𝑑ddata from the first three years, S not included in the model. | 2.1 | ||
| NGC 4258 | 2.7 | ||
| NGC 4258 | 2.1 | ||
| NGC 5548 | 2.1 | ||
| NGC 5548 | 2.7 | ||
| NGC 6814 | |||
| NGC 6814∗ | |||
| NGC 7213 | |||
| NGC 7213 | |||
| Cent. A(1) | |||
| Circinus(2) | |||
| NGC 1068(2) | |||
| NGC 4945(2) | |||
| Energy range: 0.2–1 GeV | |||
| IC 4329a | 4.0 | ||
| NGC 4151 (1)a𝑎aa𝑎ausing the full data set of 6.4 years and including source S in the model; | 4.0 | ||
| NGC 4151 (2)b𝑏bb𝑏b-year data set (6.4 years without period S), source S not included; | 4.0 | ||
| NGC 4258 | 4.0 | ||
| NGC 5548 | 4.0 | ||
| NGC 7213 | |||
3 Sample and data analysis
We considered nearby AGNs with spectral properties consistent with the hot flow scenario. This includes several Seyfert 1 galaxies: NGC 4151, NGC 5548, IC 4329a, NGC 6814, NGC 4258, and NGC 7213. We also took into account the FR I galaxy Centaurus A, whose X-ray radiation may be dominated by a Seyfert-like emission. Spectral parameters of the intrinsic X-ray emission, measured in all these objects, agree with our model of thermal Comptonization in hot flows (see, e.g., Fig 1a). Furthermore, they show direct evidence of the lack of an optically thick disk in the central region. For objects with the lowest luminosities (NGC 4258 and NGC 7213) studies of the Fe K line place the inner edge of optically thick disk between and (Reynolds et al., 2009; Lobban et al., 2010). In more luminous objects (NGC 4151, NGC 5548, IC 4329a, and NGC 6814), the measured Fe K line widths, eV (Lubiński et al., 2010; Walton et al., 2013; Brenneman et al., 2012, 2014), indicate truncation of the disk at ; a similar location of an optically thick disk is indicated by reverberation measurements (Edelson et al., 2015). These accretion geometries are consistent with the model of spectral evolution developed for black hole binaries, for instance, by Esin et al. (1997), with changing in response to changes in (for a review see Done et al., 2007).
We also considered three Seyfert 2 galaxies, NGC 1068, Circinus, and NGC 4945. All three are observed to have high bolometric luminosities, above the range that can be precisely studied with the current version of our model. Nevertheless, comparing their -ray luminosities with properties of their active nuclei appears to be interesting.
For most AGNs in our sample, direct measurements of the masses of their supermassive black holes are available, only for IC 4329a and NGC 7213 did we use estimates based on the velocity dispersion. The adopted and distance values are given in Table 1. For NGC 5548 and IC 4329a we assumed the luminosity distances for the following cosmological parameters: , , and km s-1 Mpc-1. The error bars on the values of in Figs. 1 and 3 are mostly due to uncertainties in the determination of . Of the measurements of that are based on H20 megamaser kinematics, the uncertainty is reported only for Circinus; for the remaining cases (NGC 1068, NGC 4258, and NGC 4945) we assumed the same relative uncertainties in for Figs. 1 and 3. For NGC 6814 the difference of measurements of between Bentz et al. (2009) and Pancoast et al. (2015) amount to an order of magnitude, so we present results for both values; the case with the higher value of is denoted by a star superscript in Tables 1 and 2 and Fig. 1.
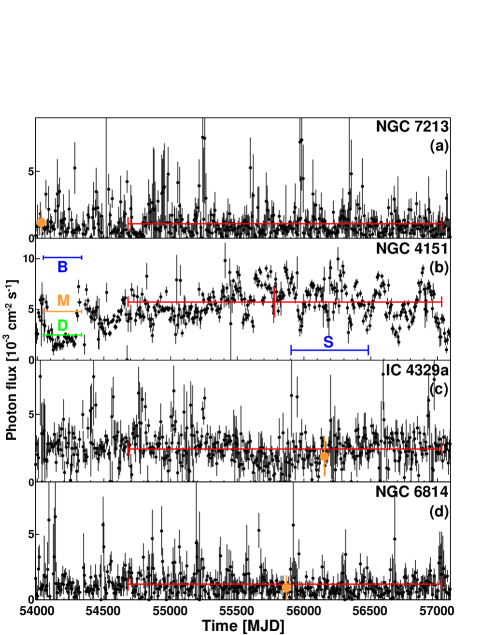
Table 2 shows the results of our analysis of the Fermi/LAT data, described below, except for NGC 1068, Circinus, NGC 4945, and Centaurus A, for which we used the results of previous studies collected from literature. In Figs. 1b and 3 we show the measured and , or UL on them, as a function of the intrinsic . To find the latter, we used results of detailed X-ray spectral studies (specified below) of high-quality data from Suzaku, NuStar, or simultaneous XMM and INTEGRAL observations, which allow distinguishing the primary X-ray emission and reflection or absorption components. The parameters of these fits are shown in Fig. 1a. Using the Swift/BAT (Krimm et al., 2013) light curves333http://swift.gsfc.nasa.gov/results/transients , we find that even for the most variable objects (NGC 7213, IC 4329a, and NGC 6814; their light curves are shown in Fig. 4) the adopted X-ray observations correspond to the flux levels close to the average Swift/BAT flux during the analyzed 6.4 years of Fermi/LAT observations; in some objects we used the intrinsic rescaled to account for a small difference, see Table 1.
3.1 LAT data analysis
For NGC 4151, NGC 5548, NGC 4258, NGC 6814, NGC 7213, and IC 4329a we analyzed 6.4 years of the Fermi/LAT data, comprising observations carried out between 2008 August 4 and 2015 January 10. For each object, events were selected from a region with a radius of centered on the position of the analyzed source. We performed the unbinned likelihood analysis using the v9r33p0 Fermi Science Tools with CALDB instrument response functions. We used the standard templates for the Galactic (gll_iem_v05_rev1.fits) and the isotropic (iso_source_v05_rev1.txt) backgrounds. In the likelihood analysis we took into account all sources reported in the Fermi/LAT Third Source Catalog (Acero et al., 2015, hereafter 3FGL) within a radius of 15∘ around the analyzed object. Each of the catalog sources was modeled with a best-fit spectral function (as specified in the catalog, in most cases a power-law) with parameters left free in the model fitting.
Except for NGC 6814 we did not find statistically significant signals. We derived the 95% confidence level ULs for the photon flux using the Bayesian method.
We first checked how the use of both an extended data set and improved models (based on 3FGL) of the celestial regions of interest affects the UL values. Assuming the -ray photon spectral index , we found ULs for lower by a factor (for NGC 7213 and IC 4329a) and (for NGC 5548) than the corresponding UL in Ackermann et al. (2012a). For NGC 4151 the UL value is somewhat dependent on the approach to modeling (as discussed below), but in general, we were unable to reduce it significantly below the value quoted by Ackermann et al. (2012a).
The pion decay spectra can only be described by a simple power-law in limited energy ranges. For the thermal distribution of protons, the -decay spectrum can be very roughly approximated by a very soft power-law, with , above GeV. For the power-law proton distribution, it is a power-law above GeV. Then, to compare with predictions of model T, we assumed and found UL for . To compare with predictions of models with , we found UL for assuming different values of between 2.1 and 2.7. For all AGNs, except for NGC 5548, the highest ULs correspond to (the difference for other values of does not exceed a factor of 2), and we used them in Fig. 1b. The comparison in Fig. 1b is presented in the most conservative manner, meaning that we used the lowest predicted by the model (for ) and the highest UL value (for ).
3.2 NGC 4151
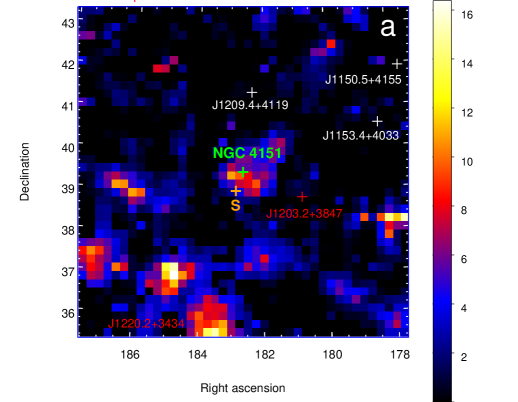
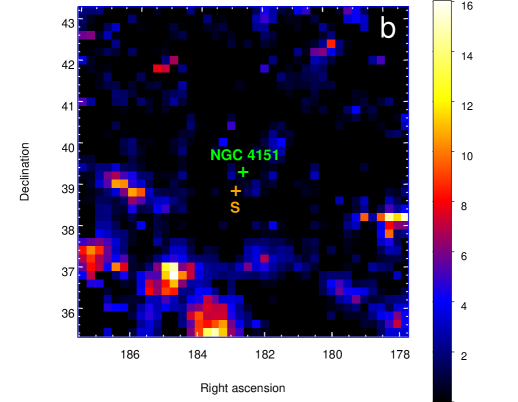
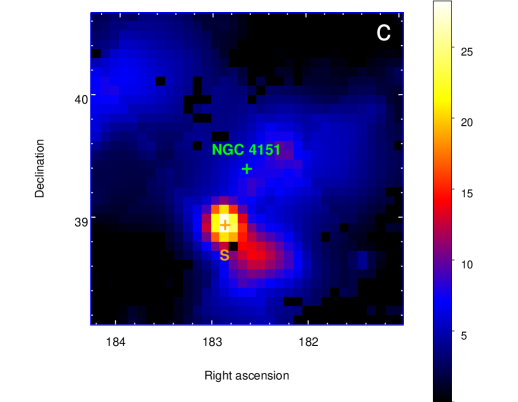
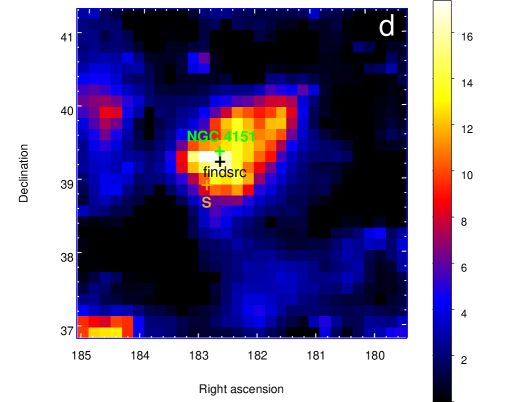
At the position of NGC 4151 we found a signal with the test-statistic significance TS for GeV, see Fig. 5d. It most likely contains a contribution from a new -ray source found in our analysis, denoted below by S, shifted by only from NGC 4151. Interestingly, however, the gtfindsrc best-fit location for this signal (shown by the black cross), assuming that it comes from a single source, is shifted from the position of NGC 4151 by only 8′. Source S is strongly variable, which hinders a proper assessment of its contribution to the -ray signal. The details of our analysis are as follows.
We first examined the significances of -ray signals around NGC 4151 by means of their TS values. This revealed three new sources in the region, which were not reported in the Fermi/LAT Second Source Catalog and hence not included in the model used in Ackermann et al. (2012a). For each of these sources we used the gtlike and gtfindsrc tools to find their significance, best-fit position, and spectral parameters. Two of them (indicated by the red symbols in Fig. 5a) have recently been reported in 3FGL, with parameters approximately consistent with those estimated in our analysis. They are 3FGL J1220.2+3434, shifted from NGC 4151 by , for which our analysis gives , and ph s-1 cm-2, and 3FGL J1203.2+3847, shifted from NGC 4151 by °, for which we derived , and ph s-1 cm-2. These sources are included in the model used for all results presented in this work.
The position of the third source, S, from NGC 4151, is determined by several photons with energies between 10 and 20 GeV, which arrived from the same direction (within 8′) between December 2011 and June 2013; we assume that the source exhibited an outburst activity during this 1.5-year period, which we denote as period S. Source S is clearly seen in the TS map built for period S alone, see Fig. 5c, whereas the map built without this period only shows a weak residual, centered on NGC 4151 and not on S, see Fig. 5a. After subtracting all 3FGL sources, we find for source S (1) TS , , ph s-1 cm-2 using the data from period S, and (2) TS , , ph s-1 cm-2 using the full 6.4-year data set. Source S is not reported in 3FGL, which was built using data up to 2012 July, that i, covering only of period S. For the data from period S, gtfindsrc gives the location of S at , . A possible candidate for this source is a BL Lac object, 2E 1209.0+3917, only from this location.
For a 4.9-year data set, without the period S, gtlike shows no signal (TS ) at the S position. The residual seen in the TS map for this data set, Fig. 5(a), can be fully compensated for by adding the point source at the position of NGC 4151 (compare with panel b), and gtlike gives , and for this source.
The presence of a variable source S results in an ambiguity for the UL on the -ray flux from NGC 4151, especially below 1 GeV, where the point spread function of LAT is much higher than the angular separation between S and NGC 4151. In our analysis we considered two variants:
(1) assuming that S strongly softened before and after period S, but still provided some contribution at low energies, we used the full 6.4-year data set and included source S in the model in addition to the 3FGL sources, which yielded the UL values denoted by superscript ’a’ in Table 2;
(2) assuming that S completely faded away before and after period S, we used the data for 4.9 years without period S and included only the 3FGL sources in the model (i.e., without source S), which yielded the UL values denoted by superscript ’b’ in Table 2.
The thus obtained ULs on differ by a factor of , both values of the resulting UL on are shown in Fig. 3. The UL on is much less model-dependent. In Fig. 1b we use the UL obtained for the above case (1) with assumed , other ULs for this energy range differ by at most 50% and do not affect our conclusions. We also note that adding source S in the model for the first three years has a negligible effect, see cases ’cd’ in Table 2. We also checked that our results are unchanged if we introduce additional sources to account for several residuals located at to from NGC 4151, seen in Fig. 5(a).
We used the recent dust-parallax distance measurement and the implied stellar-velocity-based mass (see Table 1), both higher by % than assumed in previous works on high-energy emission from NGC 4151. NGC 4151 shows a moderate X-ray variability with changes of the X-ray flux by up to a factor of between the dim and bright states. Using the adopted distance and values and the power-law fits of Lubiński et al. (2010), we found the intrinsic for the (dim, medium, and bright) state; the parameters of these three states are shown in Fig. 1a). The average Swift/BAT flux during the considered Fermi/LAT observations is higher by a factor 1.2 than the flux of the medium state, see Fig. 4b.
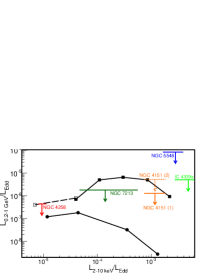
As we see in Figs 1b and 3, the ULs on and derived for NGC 4151 yield the tightest constraints on both and of the bright Seyfert 1 galaxies (although IC 4329a has the lowest ratio in our sample). For , model N overpredicts by a factor of several, regardless of or values. Then, if heating of electrons is dominated by Coulomb interactions, the energy content of nonthermal protons is limited to .
For , the model predictions, except for model N with , are below the UL value. However, as noted before, the much lower predicted by large- models is accompanied by much lower . The X-ray spectrum of NGC 4151 is precisely measured, at least in the bright state, and allows testing this property. Fits of the bright-state spectrum with the slab compPS model in Lubiński et al. (2010) give . To compare it with our model predictions, we simulated the X-ray spectra for our models with ; we used the INTEGRAL/ISGRI response function and assumed the normalization corresponding to the bright state of NGC 4151. Then, the simulated spectra were fitted with the slab compPS model. For , the best fit has (model H0.1 with , , ). For , all simulated spectra were fitted with . We conclude that although large- models are essentially unconstrained by the Fermi UL, they also appear to be inconsistent with the X-ray data.
predicted by model T, compared with with the Fermi UL for the above case (1), disfavors models with both a large and a large , in a manner consistent with NGC 7213. For case (2), however, the UL is above the model prediction. Stronger constraints can be obtained if NGC 4151 enters the flux level of the dim state for a longer period, as at , is close to the extent of the -ray emitting region for thermal protons.
3.3 NGC 6814
The -ray signal from the direction of NGC 6814 with TS was found by Ackermann et al. (2012a). However, the source is not reported in 3FGL. It may not have passed the TS criterion, assumed in 3FGL, as the above value is close to the limit. Our analysis, using data for 6.4 years, confirms the signal with TS and our best-fit parameters for a power-law spectrum (see Table 2) are approximately consistent with those of Ackermann et al. (2012a).
In Fig. 1a we show the parameters of the intrinsic X-ray emission from spectral fits to Suzaku observations in 2011 (Walton et al., 2013). Interestingly, the source is located in the region for an inefficient (thermal synchrotron) source of seed photons. During this observation the source was in a relatively dim state, with the average Swift/BAT flux lower by a factor of than the average during the Fermi/LAT observations, see Fig. 4d.
As noted above, we considered two values of for NGC 6814. For both, the measured gives exceeding the maximum value predicted for the hot flow (in models N with ), which rules out an origin of the observed -ray signal in an inner hot flow. For the higher value of , NGC 6814 has a similar to the -ray-loud Seyfert 2 galaxies, a possible explanation is discussed in Sect. 5.
3.4 NGC 5548 and IC 4329a
The likelihood analysis of the Fermi/LAT data does not reveal any significant signal around these two X-ray-bright Seyfert galaxies (in both TS ) and therefore we computed the ULs given in Table 2.
For NGC 5548, we show in Fig. 1a the parameters of the power-law fits from Brenneman et al. (2012) for seven Suzaku observations in 2007. The average Swift/BAT flux during the 6.4 years of Fermi/LAT observations is equal to the average flux during the Suzaku observations, and we used the intrinsic from the fit of Brenneman et al. (2012) for the average Suzaku spectrum.
For IC 4329a, we show in Fig. 1a the parameters of the power-law fits from Brenneman et al. (2014) for lower and higher flux states during Suzaku and NuSTAR observations in 2012. We used larger by a factor 1.3 to account for the difference between the average Swift/BAT flux for 6.4 years and the flux from measurement simultaneous with Suzaku/NuSTAR observations, see Fig. 4c.
Both sources are observed above but within the range of approximate applicability of our model. During one observation, NGC 5548 is seen in the area of ADAF solutions with inefficient cooling. In the remaining observations both sources show interesting hints of modest hardening below or softening above with increasing .
3.5 NGC 7213
Despite the large uncertainty in , NGC 7213 gives interesting constraints on the hot flow model; crucially, it is observed at , between the X-ray bright Seyfert 1 galaxies discussed above and NGC 4258. The likelihood analysis of the Fermi/LAT data does not reveal any significant signal around NGC 7213 (TS ), and we computed the ULs given in Table 2. In Fig. 1a we show the parameters from a Suzaku observation in 2006 (Lobban et al., 2010) during which the average flux level was similar to the average during 6.4 years, see Fig. 4a.
Figure 1b shows that the derived UL for constrains the nonthermal energy content to for . Models with predicts below the Fermi limit, except for and . However, the X-ray spectra predicted for appear to be qualitatively inconsistent with the spectrum measured in NGC 7213. The spectra at (the dotted line for and the overlying dashed line for in Fig. 2c) deviate significantly from a power-law shape, whereas the Suzaku spectrum between 0.6 and 50 keV is described by a simple power-law (Lobban et al., 2010). The UL for rules out a high flow around a high- black hole.
3.6 NGC 4258
The precisely determined parameters of this AGN made it an essential object for the development of the hot flow models (e.g., Lasota et al., 1996). However, it has not been included in previous analyses of the Fermi/LAT data. At the position of NGC 4258 we found a weak -ray excess above the background, with TS = 9.4. A likelihood analysis of the signal with gtlike gives , ph s-1 cm-2. Despite the weak residual, the derived ULs on the photon flux yield the tightest constraint on and of all considered objects, see Table 2.
In Fig. 1a we show parameters of the analysis reported by Reynolds et al. (2009) of the Suzaku observation in 2006, who also noted that during this observation NGC 4258 increased its intrinsic X-ray luminosity by a factor of relative to the average from Swift/BAT measurements. We used from the Suzaku fit reduced by a factor of 2.
At , the 0.2–1 GeV emission is weakly affected by absorption, and we can observe radiation from the ergospheric region (see Sect. 2). However, as Fig. 3 shows, the strongest expected signal is only at the level of the Fermi UL.
For , model N predicts a flux strongly exceeding the derived UL for , ruling out . For , the predicted -ray flux is an order of magnitude below the UL value. However, the corresponding X-ray spectrum (bottom dashed line in Fig. 2c) seems to rule out this (large-) case if the X-ray radiation observed from NGC 4258 is produced by thermal Comptonization.
3.7 Circinus, NGC 1068, and NGC 4945
For the Seyfert 2 galaxies we used the parameters reported in 3FGL, which are approximately consistent ( within 30%) with previous analyses (Lenain et al., 2010; Ackermann et al., 2012b; Hayashida et al., 2013).
Of these three AGNs, only NGC 4945 shows rapid variability in the hard X-rays, which indicates that it is a transmission-dominated source. We can therefore directly probe the nuclear emission. In Fig. 1a we show fits from Puccetti et al. (2014) for NuSTAR observations in 2013. The average Swift/BAT flux during the four years of Fermi observations used in 3FGL agrees with the average flux during the NuSTAR observations.
In NGC 1068, the direct X-ray emission of is completely obscured along our line of sight and we only see the reflected component. Then, the assessed intrinsic emission is strongly model dependent. We used corresponding to the best-fit of Bauer et al. (2014). This assessment, based on the observed reflected component, gives the level of emission from the active nucleus averaged over a long time, possibly over hundreds of years, because a significant fraction of reflection arises at a pc scale (see Bauer et al., 2014). Similarly, the X-ray emission from Circinus is reflection dominated; we used results from Arévalo et al. (2014). NGC 1068 and Circinus are not shown in Fig. 1a because the estimates for their intrinsic are model dependent.
Figure 1b shows that all three -ray-loud Seyfert 2 galaxies agree remarkably well after scaling by their central black hole masses, with and in all three. We also note that their ratio does not exceed the limit on the luminosity ratio in other AGNs, except for that corresponding to the UL in IC 4329a for .
3.8 Centaurus A
The interpretation of the high-energy spectrum of Cen A has some open questions. Its X-ray emission may contain contribution from both the jet and the accretion flow. The latter origin is supported by the thermal-like cutoff, claimed in Beckmann et al. (2011), and by the location in the area of the – plane occupied by Seyfert galaxies. In Fig. 1a we show the parameters from three Suzaku observations in 2009 (Fukazawa et al., 2011). Fukazawa et al. (2011) also noted hints for a harder power-law component, with , weakly contributing below 100 keV, which may represent emission from the jet. The main contribution to the -ray emission of Cen A most likely comes from the jet. However, Sahakyan et al. (2013) found evidence for a second component, an order of magnitude less luminous than the main -ray component. This weaker component has a hard spectrum and dominates above GeV. Assuming that this component extends down to 1 GeV with the same slope, we find . Based on a comparison with predictions of model H0.1 , this component can be emitted from a flow with and (slightly dependent on plasma magnetization).
The Swift/BAT flux level during the 2009 Suzaku observations is equal to the average flux during the Fermi/LAT data-taking period used for the analysis in Sahakyan et al. (2013).
4 Nonthermal electrons
Here we consider effects related with nonthermal electrons that are produced by various mechanisms, specifically, their contribution to the observed -ray luminosity and to the optical depth.
4.1 Pion decay
If nonthermal protons are present, electrons with may be produced by charged pion decay. The nonthermal Compton radiation of these electrons may extend to the LAT energy range. The power injected in decay electrons is similar to the luminosity in decay -rays. However, electrons with lose most of their energy in synchrotron radiation, therefore their nonthermal Compton emission in the -ray range is always much weaker than the decay component.
The density of -decay , determined by the pair equilibrium condition (cf. Niedźwiecki et al., 2015), is at least two orders of magnitude lower than the density of the ionization electrons. The production rate of is similar to that of , therefore pairs produced by absorption of -decay -rays give at most a similar contribution to the total density as those from -decay. Production of further generations of pairs is unlikely for the luminosities described by our model, see below. Overall, the products of hadronic processes contribute negligibly to the optical depth.
If a strong absorption affects the -decay -rays, the synchrotron radiation of thus produced pairs increases the seed photon input, again at most by a factor of . We neglected this effect in computations presented in this work; we checked that this twice higher seed photon input yields an electron temperature that is reduced by up to 10% and only insignificantly affects our results.
4.2 Direct acceleration
We briefly discuss constraints on the acceleration of electrons resulting from the Fermi/LAT ULs. For the results presented in this section we do not use the simplified description (i.e., with a monoenergetic injection) of the accelerated electrons, and we assume that they are accelerated to the power-law distribution with the acceleration index . As above, the amount of nonthermal electrons is parametrized by . Specifically, the power used for the nonthermal acceleration is , where is the total power dissipated in the flow.
Conditions in the inner parts of hot flows surrounding supermassive black holes allow for acceleration of electrons to GeV energies; for instance, using Eq. (7) from Zdziarski et al. (2009), we found the maximum Lorentz factors to be limited by the synchrotron losses of for the typical magnetic field strength of G. The synchrotron emission of these electrons extends up to MeV, so they can produce photons in the LAT energy range only by Compton scattering. We implemented the description of nonthermal Compton emission in our MC code and performed simulations with , for which the nonthermal Compton spectrum extends up to GeV.
The -ray luminosity produced by the nonthermal Compton scattering primarily depends on and . We found that for and , the values of and for the nonthermal Compton are below any UL derived from the LAT data for objects with . For , the -ray Compton component for exceeds the ULs for NGC 4258, NGC 7213 and NGC 4151, then, for such the fraction of accretion power used for nonthermal acceleration is constrained. We found for instance that for it is limited to (corresponding to and ).
In our computations we assumed that synchrotron radiation emitted below the self-absorption frequency is thermalized, as described in several works on the synchrotron boiler mechanism (e.g., Malzac & Belmont, 2009), meaning that the effective heating of thermal electrons is higher than . The power in the self-absorbed radiation is for . For , it is . Then, if is large, the heating of thermal electrons is always strong, with the synchrotron boiler dominating for . This also implies that our conclusions regarding the allowed values of are weakly dependent on other parameters of the flow. Although shows a significant dependence on , for example, both the nonthermal Compton and the thermal Compton scale roughly linearly with (the latter either through the synchrotron boiler or direct MHD heating), making the ratio weakly dependent on the other parameters.
4.3 absorption
Secondary pairs, produced by absorption, in general affect radiative properties of flows in the considered range of only insignificantly. The first generation of pairs contributes at most a few per cent to the Thomson optical depth. Copious creation of secondary pairs through electromagnetic cascades requires (1) the Compton process to dominate over synchrotron, and (2) Compton photons produced above the threshold for pair production. Typically, at least one of these conditions is not fulfilled. In the innermost parts of the flow, Compton energy losses are comparable to synchrotron losses only for electrons with Lorentz factors not exceeding a few hundred. At higher energies, synchrotron losses strongly dominate as a result of the Klein-Nishina decline in the Compton scattering rate, hence, the development of a cascade is suppressed. In turn, the lower energy electrons, for which the more efficient Compton losses are mostly due to interactions with X-ray photons from thermal Comptonization, mainly produce photons with MeV. However, at , the flows are mostly transparent to such photons. Therefore, we do not expect a significant contribution of secondary pairs to the Thomson depth of the flow. We note, however, that at the innermost region should be opaque to photons with MeV, and in this regime the secondary pairs may then contribute considerably to the optical depth.
We also note that spatially extended pair cascades, such as discussed by Zdziarski et al. (2009), for instance, are unlikely to strengthen the observed -ray flux. Such extended cascades can only develop in the region with . In a hot flow, increases quickly toward the center, see Fig. 7 in N13, therefore the free path of -rays produced within is typically very short. Furthermore, as noted above, the absorbed energy is lost to synchrotron radiation rather than used for cascade development.
5 Discussion
We first briefly comment on the X-ray spectral properties of the considered AGNs with . At these luminosities, the seed photons for Comptonization must be produced internally to the flow, and nonthermal synchrotron radiation is an almost obvious process providing the amount of seed photons needed to explain the AGN data (Poutanen & Veledina, 2014; Niedźwiecki et al., 2015). If is small, the nonthermal electrons are provided by the decay of charged pions, unless both and are small and protons are thermal, see Sect. 2.1. We emphasize that the weakness of -ray signals related with decay does not contradict a copious injection of nonthermal electrons by decay because the most efficient pion production occurs in the region opaque to -rays. If is large, the decay does not provide a sufficient amount of nonthermal electrons because the flow density is too low (here inefficient production is strictly related with very low level of -ray activity). Then, direct acceleration must take place if is large. These models (i.e., with either a significant production or ) fill the upper gray region in Fig. 1a. Typical Seyfert spectra clearly agree with these solutions.
Solutions with seed photons from thermal synchrotron alone (including models with and , as well as model T with , and ) fill the lower gray region. Obviously, intermediate cases are also possible, for instance, with and . Seyferts are occasionally observed with parameters corresponding to inefficient cooling (NGC 6814 and one of NGC 5548 data points). These harder-than-typical spectra may result from a decline of nonthermal electron injection. For large it may correspond to the decrease of , and for small to the decrease of (again, for small and thermal protons).
Observational assessment of nonthermal acceleration processes in astrophysical plasmas is an essential question. Hot flows in which ultra-relativistic acceleration of protons takes place can be considered a source of neutrinos detected by IceCube (e.g., Kimura et al., 2015). Accretion flows should also be strong acceleration sites according to hybrid thermal and nonthermal Comptonization models (e.g., Vurm & Poutanen, 2009; Malzac & Belmont, 2009; Veledina et al., 2011) that are widely applied to explain X-ray spectra of accreting black holes; here at least % of the energy must be provided to electrons by nonthermal processes if thermalization of electrons via Coulomb collision and synchrotron self-absorption is taken into account (Del Santo et al., 2013). Interestingly, these models are typically fitted with . As discussed in Sect. 4.2, the -ray luminosities from nonthermal Compton emission of flows with such are below the LAT ULs derived in Sect. 3 for Seyfert galaxies, even if .
Observational evidence of the presence of non-thermal particles in accretion flows includes detection of MeV tails (e.g., Droulans et al., 2010; Zdziarski et al., 2012) and patterns of optical/infrared evolution (Poutanen et al., 2014), both observed in stellar black-hole systems. However, these features are produced by nonthermal electrons, which may come from pion decay, and in principle, they do not require direct acceleration.
Observations in the GeV range provide the means to directly measure the efficiency of proton acceleration in hot flows. The obtained ULs for in NGC 4258, NGC 7213 and NGC 4151 constrain the fraction of accretion power used for relativistic acceleration of protons to at most (if ). Remarkably, these three AGNs allow probing various parts of the flow because at , and , radiation produced at a few, ten, and several tens of , respectively, dominates the observed 1–10 GeV flux. The component dominating the core emission of Centaurus A above GeV may come from a hot flow in which . In this scenario, its should be higher at least by a factor of than in NGC 7213 (see Fig. 1b), which has similar . This might reflect differences between flows powering radio-loud and radio-quiet AGNs. We also note that in this hot flow scenario for Centaurus A, the observed -rays (above 4 GeV) provide information about the region close to the jet formation site444according to the radio imaging of M 87, e.g. Doeleman et al. (2012), and assuming that the sizes of such sites are common in AGNs.
We now briefly discuss hard spectral states of black hole binaries in which hot accretion flows, similar to those powering AGNs, are most likely present. In the innermost parts of flows powering both classes of objects the same physical processes are expected. This view is supported by the similarity between the X-ray spectra of Seyferts and black hole binaries in the hard spectral states (e.g., Zdziarski et al., 1996), with slight differences simply explained by scaling of seed photon energies with the black hole mass (cf. Niedźwiecki et al., 2015). These differences do not affect the -ray emission, and the relation between and or shown in Figs 1–3 is probably also relevant for flows around stellar-mass black holes.
An estimate of the -ray activity level, which can be compared with the hot flow model, has only been obtained for the hard state of Cyg X-1 by Malyshev et al. (2013). Figure 1b shows that it gives a slightly tighter constraint than Seyfert galaxies, limiting to at most a few per cent for , and at most % for and . A significant nonthermal proton component, with , is only allowed if and is high. This finding places interesting constraints on hybrid models (see above) if protons are accelerated with at least a similar efficiency to electrons (as expected in many acceleration scenarios). It may be also interesting to note that similar values of correspond to the Cyg X-1 hard state () and our gtlike fits to signals at the positions of NGC 4151 () and NGC 4258 (), although the significance of the -ray signal is rather weak (TS = 15.6) in Cyg X-1 and marginal in NGC 4258 and NGC 4151.
Finally, we comment on the -ray emission of NGC 4945, NGC 1068, and Circinus. All three exhibit both an AGN and starburst activities. NGC 4945 and NGC 1068 approximately follow some multiwavelength correlations established in other star-forming galaxies (Ackermann et al., 2012b), which suggests that their -ray emission may be related to the latter activity. However, Circinus does not agree with these correlations, furthermore, its exceeds the calorimetric limit (where all cosmic rays produced by supernovae interact with interstellar matter), see Hayashida et al. (2013). Furthermore, Lenain et al. (2010) noted that measured in NGC 1068 exceeds by a factor of the level expected for the total gas mass and supernova rate estimated in this galaxy, which led them to suggest that the -rays may be produced in a jet. Similarly, Yoast-Hull et al. (2014) found that their detailed starburst model underestimates the observed -ray flux and overestimates the radio flux for NGC 1068, and they argued that these problems would be resolved if the AGN were the primary source of -rays. This shows that the origin of -rays still seems rather unclear.
Seyfert galaxies show a strong correlation between nuclear star-formation and the AGN luminosity (e.g., Diamond-Stanic & Rieke, 2012). Masses of supermassive black holes in Circinus, NGC 1068, and NGC 4945 are precisely determined by H20 megamaser measurements. Their values imply an intriguing similarity of the values of both and in all three objects. The question then arises whether their -ray emission might be related with accretion processes in their active nuclei. For the intrinsic , the geometry of accretion flow is very uncertain. It cannot be studied through Fe K line distortions because the X-ray spectra of all three AGNs are completely absorbed below 10 keV. Some analogies with black hole binaries, in which (1) luminous hard states have been observed at such (e.g., Zdziarski et al., 2004), (2) softening of intrinsic X-ray slopes above is observed that closely resembles the behavior seen in NGC 4945 (see, e.g., Fig. 1 in Yang et al. (2015)), and (3) strong thermal components are seen at indicating that the cold disk extends down to (e.g., Cabanac et al., 2009) suggest that inner hot flows may be present in these AGNs, but only within the innermost several . This value of is tentatively shown in Fig. 1a. For such a small, strongly energized (the main release of gravitational energy occurs in this region) and relatively dense flow, we cannot exclude the possibility that a sufficient -ray flux is produced in an outer layer and escapes avoiding absorption (taking into account a strong local anisotropy of the X-ray radiation field, see Sect. 2). Any stronger conclusions for this scenario would be premature; a self-consistent model, compatible with the X-ray data, needs to be developed before a quantitative assessment of the -ray flux can be made.
We do not expect direct -ray signals from central parts of accretion flows in black hole binaries even if they have the same geometry at this . Any emission in the GeV range would be absorbed in interaction with soft X-ray emission of a cold disk extending to small , see Bednarek (1993) for quantitative estimates. In AGNs, a UV-emitting cold disk only attenuates -rays at GeV.
Another possibility involves escape of protons accelerated in the flow and their interaction with circumnuclear matter. About 0.1% of the accretion power would need to be carried away by escaping protons to explain the -ray measurements. This would also allow explaining the -ray signal in NGC 6814 by the same emission mechanism, assuming that (1) its supermassive black hole has (the higher of the two values considered above), for which its is similar to those of NGC 4549, Circinus, and NGC 1068; and (2) protons were injected into the circumnuclear region during an earlier phase of higher (by almost 2 orders of magnitude relative to current) activity of NGC 6814, in the scenario similar to that proposed for the Galactic center (e.g., Chernyakova et al., 2011). In this scenario, an energy-dependent diffusive loss of protons may explain the slightly softer -ray spectrum of NGC 6814.
6 Summary
Hot flows are supported by the proton pressure, and the production of pions in collisions of the energetic protons should be their generic property. If this is true, a lack of detection of a related -ray signal could be regarded as an argument against this class of models. However, the expected flux depends on several parameters, and in the extreme case of a strongly magnetized flow around a nonrotating black hole, the conditions for pion production are not achieved if protons are thermal.
We compared the prediction of the model with several well-studied AGNs, for which the available data allowed a robust determination of the nuclear luminosity scaled by the Eddington value. At the positions of NGC 4151 and NGC 4258, we found weak residuals, whose nature (background fluctuation or an actual emission) could not be assessed because of their low statistical significance.
The highest -ray luminosities are predicted if electrons are heated mostly by Coulomb interactions. If additionally most of the accretion power is used for the relativistic acceleration of a small fraction of protons, the highest level of is expected for between and . This exceeds the Fermi limit on for NGC 4258, NGC 7213, and NGC 4151 at least by a factor of several. Thus, the Fermi ULs provide an interesting constraint on the MHD processes that convert the accretion power into the kinetic energy of protons: A rather uniform heating of all protons would need to take place. Given this constraint, we used predicted for thermal distribution of protons to rule out a flow with a high (equipartition) value of around a high- black hole for NGC 7213 and and NGC 4151; for the latter this result is model dependent.
If a large part of the accretion power is used for a direct heating or acceleration of electrons, the expected -ray fluxes are below the Fermi ULs, except for NGC 4151 and NGC 7213, for which was ruled out with a small (yielding some constraints on the acceleration efficiency, which may be relevant for hybrid models). However, this (large ) class of models appears to be disfavored by the predicted properties of X-ray spectra, which significantly deviate from a power law at and are described by (too) small at larger .
The -ray-loud Seyfert 2 galaxies radiate at a much higher Eddington ratio than other nearby AGNs, possibly as a result of enhanced fueling that is related with starburst activity in their nuclear regions. At this , the transition between the hot flow and the cold disk possibly takes place within the central . Whether it creates conditions suitable for the escape of -rays or relativistic protons remains an open question.
Acknowledgements.
We thank F. Longo for help with the Fermi/LAT data analysis, P. Lubiński for help with the INTEGRAL software and the referee for motivating us to include the results for nonthermal Compton emission. We made use of data and software provided by the Fermi Science Support Center, managed by the HEASARC at the Goddard Space Flight Center, and Swift/BAT transient monitor results provided by the Swift/BAT team. RW was supported by the Polish MNiSW grant for young scientists B1511500001045.02. AN was supported by the Polish NCN grant DEC-2011/03/B/ST9/03459. FGX was in part supported by the Strategic Priority Research Program ”The Emergence of Cosmological Structures” of CAS (grant XDB09000000), and the Natural Science Foundation of China (grants 11203057, 11133005).References
- Acero et al. (2015) Acero, F., Ackermann, M., Ajello, M., et al. 2015, ApJS, 218, 23
- Ackermann et al. (2012a) Ackermann, M., Ajello, M., Allafort, A., et al. 2012a, ApJ, 747, 104
- Ackermann et al. (2012b) Ackermann, M., Ajello, M., Allafort, A., et al. 2012b, ApJ, 755, 164
- Ackermann et al. (2015) Ackermann, M., Ajello, M., Atwood, W., et al. 2015, ArXiv e-prints [arXiv:1501.06054]
- Arévalo et al. (2014) Arévalo, P., Bauer, F. E., Puccetti, S., et al. 2014, ApJ, 791, 81
- Bauer et al. (2014) Bauer, F. E., Arevalo, P., Walton, D. J., et al. 2014, ArXiv e-prints [arXiv:1411.0670]
- Beckmann et al. (2011) Beckmann, V., Jean, P., Lubiński, P., Soldi, S., & Terrier, R. 2011, A&A, 531, A70
- Bednarek (1993) Bednarek, W. 1993, A&A, 278, 307
- Bentz et al. (2009) Bentz, M. C., Walsh, J. L., Barth, A. J., et al. 2009, ApJ, 705, 199
- Brenneman et al. (2012) Brenneman, L. W., Elvis, M., Krongold, Y., Liu, Y., & Mathur, S. 2012, ApJ, 744, 13
- Brenneman et al. (2014) Brenneman, L. W., Madejski, G., Fuerst, F., et al. 2014, ApJ, 788, 61
- Cabanac et al. (2009) Cabanac, C., Fender, R. P., Dunn, R. J. H., & Körding, E. G. 2009, MNRAS, 396, 1415
- Cappellari et al. (2009) Cappellari, M., Neumayer, N., Reunanen, J., et al. 2009, MNRAS, 394, 660
- Chernyakova et al. (2011) Chernyakova, M., Malyshev, D., Aharonian, F. A., Crocker, R. M., & Jones, D. I. 2011, ApJ, 726, 60
- Del Santo et al. (2013) Del Santo, M., Malzac, J., Belmont, R., Bouchet, L., & De Cesare, G. 2013, MNRAS, 430, 209
- Diamond-Stanic & Rieke (2012) Diamond-Stanic, A. M. & Rieke, G. H. 2012, ApJ, 746, 168
- Doeleman et al. (2012) Doeleman, S. S., Fish, V. L., Schenck, D. E., et al. 2012, Science, 338, 355
- Done et al. (2007) Done, C., Gierliński, M., & Kubota, A. 2007, A&A Rev., 15, 1
- Droulans et al. (2010) Droulans, R., Belmont, R., Malzac, J., & Jourdain, E. 2010, ApJ, 717, 1022
- Edelson et al. (2015) Edelson, R., Gelbord, J. M., Horne, K., et al. 2015, ApJ, 806, 129
- Esin et al. (1997) Esin, A. A., McClintock, J. E., & Narayan, R. 1997, ApJ, 489, 865
- Fukazawa et al. (2011) Fukazawa, Y., Hiragi, K., Yamazaki, S., et al. 2011, ApJ, 743, 124
- Greenhill et al. (2003) Greenhill, L. J., Booth, R. S., Ellingsen, S. P., et al. 2003, ApJ, 590, 162
- Greenhill et al. (1996) Greenhill, L. J., Gwinn, C. R., Antonucci, R., & Barvainis, R. 1996, ApJ, 472, L21
- Greenhill et al. (1997) Greenhill, L. J., Moran, J. M., & Herrnstein, J. R. 1997, ApJ, 481, L23
- Harris et al. (2010) Harris, G. L. H., Rejkuba, M., & Harris, W. E. 2010, PASA, 27, 457
- Hayashida et al. (2013) Hayashida, M., Stawarz, Ł., Cheung, C. C., et al. 2013, ApJ, 779, 131
- Herrnstein et al. (1999) Herrnstein, J. R., Moran, J. M., Greenhill, L. J., et al. 1999, Nature, 400, 539
- Hönig et al. (2014) Hönig, S. F., Watson, D., Kishimoto, M., & Hjorth, J. 2014, Nature, 515, 528
- Kimura et al. (2015) Kimura, S. S., Murase, K., & Toma, K. 2015, ApJ, 806, 159
- Krimm et al. (2013) Krimm, H. A., Holland, S. T., Corbet, R. H. D., et al. 2013, ApJS, 209, 14
- Lasota et al. (1996) Lasota, J.-P., Abramowicz, M. A., Chen, X., et al. 1996, ApJ, 462, 142
- Lenain et al. (2010) Lenain, J.-P., Ricci, C., Türler, M., Dorner, D., & Walter, R. 2010, A&A, 524, A72
- Lobban et al. (2010) Lobban, A. P., Reeves, J. N., Porquet, D., et al. 2010, MNRAS, 408, 551
- Lubiński et al. (2010) Lubiński, P., Zdziarski, A. A., Walter, R., et al. 2010, MNRAS, 408, 1851
- Mahadevan et al. (1997) Mahadevan, R., Narayan, R., & Krolik, J. 1997, ApJ, 486, 268
- Malyshev et al. (2013) Malyshev, D., Zdziarski, A. A., & Chernyakova, M. 2013, MNRAS, 434, 2380
- Malzac & Belmont (2009) Malzac, J. & Belmont, R. 2009, MNRAS, 392, 570
- Manmoto (2000) Manmoto, T. 2000, ApJ, 534, 734
- Markowitz (2009) Markowitz, A. 2009, ApJ, 698, 1740
- Miyoshi et al. (1995) Miyoshi, M., Moran, J., Herrnstein, J., et al. 1995, Nature, 373, 127
- Narayan & Yi (1995) Narayan, R. & Yi, I. 1995, ApJ, 452, 710
- Niedźwiecki et al. (2015) Niedźwiecki, A., Stȩpnik, A., & Xie, F.-G. 2015, ApJ, 799, 217
- Niedźwiecki et al. (2014) Niedźwiecki, A., Xie, F.-G., & Stȩpnik, A. 2014, MNRAS, 443, 1733
- Niedźwiecki et al. (2013) Niedźwiecki, A., Xie, F.-G., & Stepnik, A. 2013, MNRAS, 432, 1576
- Niedźwiecki et al. (2012) Niedźwiecki, A., Xie, F.-G., & Zdziarski, A. A. 2012, MNRAS, 420, 1195
- Oka & Manmoto (2003) Oka, K. & Manmoto, T. 2003, MNRAS, 340, 543
- Pancoast et al. (2015) Pancoast, A., Brewer, B. J., Treu, T., et al. 2015, MNRAS, 448, 3070
- Popham & Gammie (1998) Popham, R. & Gammie, C. F. 1998, ApJ, 504, 419
- Poutanen & Veledina (2014) Poutanen, J. & Veledina, A. 2014, Space Sci. Rev., 183, 61
- Poutanen et al. (2014) Poutanen, J., Veledina, A., & Revnivtsev, M. G. 2014, MNRAS, 445, 3987
- Puccetti et al. (2014) Puccetti, S., Comastri, A., Fiore, F., et al. 2014, ApJ, 793, 26
- Reynolds et al. (2009) Reynolds, C. S., Nowak, M. A., Markoff, S., et al. 2009, ApJ, 691, 1159
- Sahakyan et al. (2013) Sahakyan, N., Yang, R., Aharonian, F. A., & Rieger, F. M. 2013, ApJ, 770, L6
- Schnorr-Müller et al. (2014) Schnorr-Müller, A., Storchi-Bergmann, T., Nagar, N. M., & Ferrari, F. 2014, MNRAS, 438, 3322
- Shapiro et al. (1976) Shapiro, S. L., Lightman, A. P., & Eardley, D. M. 1976, ApJ, 204, 187
- Tully (1988) Tully, R. B. 1988, Nearby galaxies catalog (Cambridge University Press)
- Tully et al. (2009) Tully, R. B., Rizzi, L., Shaya, E. J., et al. 2009, AJ, 138, 323
- Veledina et al. (2011) Veledina, A., Vurm, I., & Poutanen, J. 2011, MNRAS, 414, 3330
- Vurm & Poutanen (2009) Vurm, I. & Poutanen, J. 2009, ApJ, 698, 293
- Walton et al. (2013) Walton, D. J., Zoghbi, A., Cackett, E. M., et al. 2013, ApJ, 777, L23
- Xie et al. (2010) Xie, F.-G., Niedźwiecki, A., Zdziarski, A. A., & Yuan, F. 2010, MNRAS, 403, 170
- Xie & Yuan (2012) Xie, F.-G. & Yuan, F. 2012, MNRAS, 427, 1580
- Yang et al. (2015) Yang, Q.-X., Xie, F.-G., Yuan, F., et al. 2015, MNRAS, 447, 1692
- Yoast-Hull et al. (2014) Yoast-Hull, T. M., Gallagher, III, J. S., Zweibel, E. G., & Everett, J. E. 2014, ApJ, 780, 137
- Yuan & Narayan (2014) Yuan, F. & Narayan, R. 2014, ARA&A, 52, 529
- Yuan & Zdziarski (2004) Yuan, F. & Zdziarski, A. A. 2004, MNRAS, 354, 953
- Zdziarski et al. (1996) Zdziarski, A. A., Gierlinski, M., Gondek, D., & Magdziarz, P. 1996, A&AS, 120, C553
- Zdziarski et al. (2004) Zdziarski, A. A., Gierliński, M., Mikołajewska, J., et al. 2004, MNRAS, 351, 791
- Zdziarski et al. (2012) Zdziarski, A. A., Lubiński, P., & Sikora, M. 2012, MNRAS, 423, 663
- Zdziarski et al. (2009) Zdziarski, A. A., Malzac, J., & Bednarek, W. 2009, MNRAS, 394, L41