The Remarkable Deaths of 9 - 11 Solar Mass Stars
Abstract
The post-helium burning evolution of stars from to is complicated by the lingering effects of degeneracy and off-center ignition. Here stars in this mass range are studied using a standard set of stellar physics. Two important aspects of the study are the direct coupling of a reaction network of roughly nuclei to the structure calculation at all stages and the use of a subgrid model to describe the convective bounded flame that develops during neon and oxygen burning. Below , degenerate oxygen-neon cores form that may become either white dwarfs or electron-capture supernovae. Above the evolution proceeds “normally” to iron-core collapse, without composition inversions or degenerate flashes. Emphasis here is upon the stars in between which typically ignite oxygen burning off center. After oxygen burns in a convectively bounded flame, silicon burning ignites in a degenerate flash that commences closer to the stellar center and with increasing violence for stars of larger mass. In some cases the silicon flash is so violent that it could lead to the early ejection of the hydrogen envelope. This might have interesting observable consequences. For example, the death of a star could produce two supernova-like displays, a faint low energy event due to the silicon flash, and an unusually bright supernova many months later as the low energy ejecta from core collapse collides with the previously ejected envelope. The potential relation to the Crab supernova is discussed.
Subject headings:
stars: AGB and post AGB, evolution; supernovae: general, individual (Crab); supernovae: nucleosynthesis1. INTRODUCTION
The post-carbon burning evolution of stars near the transition from those that leave white dwarfs to those that make supernovae has always been challenging to model (Barkat et al., 1974). For non-rotating stars of solar composition, the most interesting mass range is from to . For other metallicities, the range may vary (Ibeling & Heger, 2013). In these stars, the effects of degeneracy persist and, combined with neutrino cooling by the plasma- and pair-processes, lead to temperature inversions, off-center shell ignition, and composition inversions. Despite these computational challenges, the late stages of evolution of these stars have been studied extensively. Representative historical and important recent calculations have been done by Miyaji et al. (1980); Nomoto (1984); Hillebrandt et al. (1984); Nomoto (1987); Mayle & Wilson (1988); Dominguez et al. (1993); Timmes et al. (1994); Gutierrez et al. (1996); Garcia-Berro et al. (1997); Iben et al. (1997); Ritossa et al. (1999); Siess (2006); Poelarends et al. (2008); Jones et al. (2013); Tauris et al. (2013); Takahashi et al. (2013); Doherty et al. (2014); Jones et al. (2014), and Moriya et al. (2014).
An obscure, but relevant historical reference is Woosley et al. (1980). This was the first, and so far as we know, only study to report a quite different outcome for the explosion of stars - a violent flash at the onset of silicon ignition that ejected the envelope of the star. After the envelope was ejected, the remaining bound core, consisting of a mixture of silicon and iron, completed its silicon burning evolution and collapsed, about a year later, to a neutron star. The collision between the matter ejected when the iron core collapsed and the previously ejected envelope created an unusually bright supernova. For a time, an informal, unpublished discussion went on between the Japanese (e.g. Miyaji et al., 1980; Nomoto, 1984; Miyaji & Nomoto, 1987) and US groups as to the actual fate of stars - electron capture in a core of neon and oxygen resulting in collapse or silicon deflagration followed by iron-core collapse, with the ultimate agreement being that probably both happened for some narrow range of masses (e.g. Woosley & Weaver, 1986).
Here we return to this issue with the same code used in 1980, but with improved stellar and nuclear physics. We find, as anticipated, that both electron-capture supernovae and silicon deflagration are common outcomes for stars near . For the assumed physics, the production of a neon-oxygen core that collapses due to electron capture on unburned fuel happens for solar metallicity stars below , while degenerate silicon flashes characterize stars from to . In the range to , the flash is particularly violent and could lead to envelope ejection prior to iron core collapse.
In § 2 the stellar and nuclear physics used in the models is discussed. In § 3 the evolution below is briefly reviewed. This subject is worth revisiting, if only to set some fiducial masses for the KEPLER code. We find, as have many others, regions of mass where carbon-oxygen (CO) dwarfs are the outcome and others where neon-oxygen-magnesium (ONe) white dwarfs result. If such stars retain their hydrogen envelope until death, thermonuclear supernovae (CO-dwarfs) or electron-capture supernovae (ONe dwarfs) will result. In § 4 and § 5, we discuss the stars that, following the propagation of convectively bounded oxygen and silicon burning flames, produce iron cores that collapse to neutron stars. A novel treatment of oxygen burning flames (oxygen CBFs) is employed that incorporates a subgrid model for the flame propagation as a function of temperature in a full star calculation of the evolution (§ 4.1.1). The silicon flash and its prompt effects are studied for each model where it occurs. Since the flash frequently ignites off-center, one must also follow the subsequent propagation of a silicon burning CBF to the center after the core contracts and reignites burning (§ 4.1.2). It is found that the Rayleigh-Taylor instability plays a major role in the propagation of this silicon-burning flame.
In § 6, we discuss, in greater detail, those stars where silicon ignites explosively, calculating the light curves for a few cases where a large amount of silicon burns (§ 7). Some of these events can be brighter than a Type Ia supernova (SN Ia) for a month or two. Finally, we conclude (§ 8) with some speculations regarding the nature of the supernova that made the Crab Nebula and speculate as to how our results might change in the case of a more realistic multi-dimensional simulation.
2. PHYSICS EMPLOYED
The full evolution of stars with main sequence masses in the range to was calculated (Table 1) using the KEPLER code (Weaver, Zimmerman, & Woosley, 1978; Woosley et al., 2002). All stars had an initially solar composition and, with one exception (§ 7.1), were not rotating. The solar abundance set employed was from Lodders (2003) with , , and metallicity, . Mass loss was included using standard prescriptions and the nuclear reaction rates and opacities were the same as used in many previous studies (e.g., Woosley et al., 2002; Woosley & Heger, 2007). The grid of stellar masses calculated was non-uniform and focused upon stars where the nature of silicon burning was rapidly varying. For stars lighter than , the “end state” was not determined since the calculations were halted once a very thin helium shell had formed. These stars would evolve as super-asymptotic giant branch (SAGB) stars and may produce electron-capture supernovae or just end their lives as ONe white dwarfs (e.g., Poelarends et al., 2008; Jones et al., 2013; Doherty et al., 2014).
An important aspect of the calculation was the use of a moderate-sized nuclear reaction network directly coupled to the stellar structure (for prior examples, see Woosley et al., 2004; Jones et al., 2013). The network at the presupernova stage typically contained approximately 230 isotopes from carbon through germanium. A representative network included 1-2H, 3-4He, 6-8Li, 7,9-11Be, 8,10-14B, 11-14C, 13-15N, 14-18O, 16-19F, 19-23Ne, 21-25Na, 23-28Mg, 25-29Al, 27-34Si, 30-35P, 31-38S, 34-39Cl, 36-42Ar, 37-43K, 40-48Ca, 41-49Sc, 44-52Ti, 45-53V, 48-56Cr, 50-57Mn, 52-60Fe, 54-61Co, 56-64Ni 57-65Cu, 60-66Zn, 64-80Ga 64-82Ge and neutrons. A test case (10.5 ) that used a larger network of 365 isotopes, the difference being more neutron-rich isotopes for the same elements above calcium, gave nearly identical results for the presupernova composition and structure. For example, the silicon core masses differed by less than 0.005 , and the central values of for the two cases were 0.4334 and 0.4324 for the two cases. Heavier elements and more isotopes could easily have been included, and would be necessary to study the s-process in these stars, but the purpose here was to survey the structure of presupernova stars, not their heavy element nucleosynthesis. It was important to link this network directly to the structure during post-helium burning evolution because of the considerable electron capture that goes on in the degenerate stellar cores prior to silicon ignition (Jones et al., 2013). It was also important to include the proper nuclear physics for silicon burning itself when the composition consists chiefly of 30Si and 34S, not 28Si and 32S. An “alpha-network” would have been wholly inadequate and the “QSE” network normally used for silicon burning in KEPLER would not treat neutron-rich silicon burning very accurately (even though it does include special reactions for the destruction of 30Si).
The network was “adaptive” (Rauscher et al., 2002). Any isotope that would have appreciable abundance was automatically and dynamically added as needed during the calculation. Up until the time of iron core collapse, the electron fraction, , within the helium core stayed in the range to . Thus the composition and weak interactions were well represented by the moderate-sized network.
Weak interactions during oxygen and silicon burning affect the evolution, mostly by altering the Chandrasekhar mass. Here, as in past studies (Woosley & Heger, 2007; Heger et al., 2001), the ground state decay rates were taken as a lower bound to be used at low temperature and density. At higher temperature and density, the weak rates of Fuller et al. (1980, 1982a, 1982b, 1985), Langanke & Martinez-Pinedo (2000), and Oda et al. (1994) were used. For details of the implementation see Weaver, Zimmerman, & Woosley (1978) and Heger et al. (2001).
The outcome of presupernova evolution in this mass range is known to be sensitive to the treatment of semi-convection and convective overshoot mixing. An important consequence is setting the CO-core mass that results for a given main sequence mass (Table 1). Our CO-core masses turned out to be somewhat larger, for a given main sequence mass, than in some other studies reflecting a greater efficiency of overshoot mixing. For example, calculations using the MESA code sometimes give smaller CO cores (Sukhbold & Woosley, 2014). There is considerable variation for this quantity in the literature though (Eldridge & Tout, 2004; Sukhbold & Woosley, 2014), and our core masses are within previously published ranges.
Results can also be sensitive to zoning. In most cases of interest carbon, oxygen, or silicon burning ignite off center as convective shells whose base is characterized by a large, nearly discontinuous temperature inversion. These burning shells propagate inwards in mass by way of conductive flames or Rayleigh-Taylor instability. Too large a zone could artificially halt the migration of the flame (Timmes et al., 1994; Siess, 2006) in a calculation that did not include a subgrid model for the burning. Typical calculations here used 1000 to 1300 Lagrangian zones, but the zoning was not uniform. Due to the rapid temperature change near the flame, fine zones were automatically inserted in its vicinity. To avoid the runaway insertion of zones in the temperature discontinuity, a minimum mass was specified. Except for a single sensitivity study at 9.5 , no zones smaller than were allowed, except near the surface of the star. In practice, this meant that zones in the vicinity of the flame typically had a thickness of roughly to km, except very near the center where they were thicker.
Jones et al. (2013) have suggested the possible importance of thermohaline mixing in the study of stars in this mass range. Thermohaline mixing is included in KEPLER using the formalism of Braun (1997) and Kippenhahn et al. (1980), but adopted to a general equation of state as done for the stability considerations described in Heger et al. (2005) and using an efficiency coefficient, , of unity. This formulation has also been used by Cantiello & Langer (2010). We did not find that thermohaline mixing had an important effect in any of our oxygen-burning or silicon-burning flames since the laminar flame propagation and Rayleigh-Taylor mixing dominated.
3. PRESUPERNOVA EVOLUTION BELOW
While the critical masses depend upon the code physics, especially for convection, the evolution of massive stars below can be segregated into three broad categories based upon their final outcome (Table 1): 1) CO white dwarfs (below ); 2) ONe white dwarfs ( - , depending upon mass loss); and 3) electron-capture supernovae (upper end of - , depending upon mass loss).
There have been many studies of this mass range. Doherty et al. (2014) and Jones et al. (2013) recently carried out surveys similar to ours, though neither followed the post-oxygen burning evolution. Both found outcomes qualitatively similar to ours, although certain critical masses were shifted upwards in mass by about in the study of Doherty et al. (2014). They obtained CO white dwarfs for stars below , whereas our limit is . For itself, they found a transition object that only partly burned its carbon, quite similar to our model. From to , they found ONe white dwarfs, and, at , they found electron capture supernovae. We obtain ONe dwarfs and electron-capture supernovae from to , the same upper bound as also found by Jones et al. (2013). The variation in critical masses in these three studies can be attributed to the their treatments of mass loss, semiconvection, convective overshoot mixing, and, to a lesser extent, nuclear physics, opacities, and the initial metallicity of the stars. We claim no superiority for either treatment, but point out that similar categories of behavior are probable in any evolution code that carries all the relevant physics, but with mass shifts due to uncertainties in that physics.
3.1. Carbon-Oxygen White Dwarfs - M
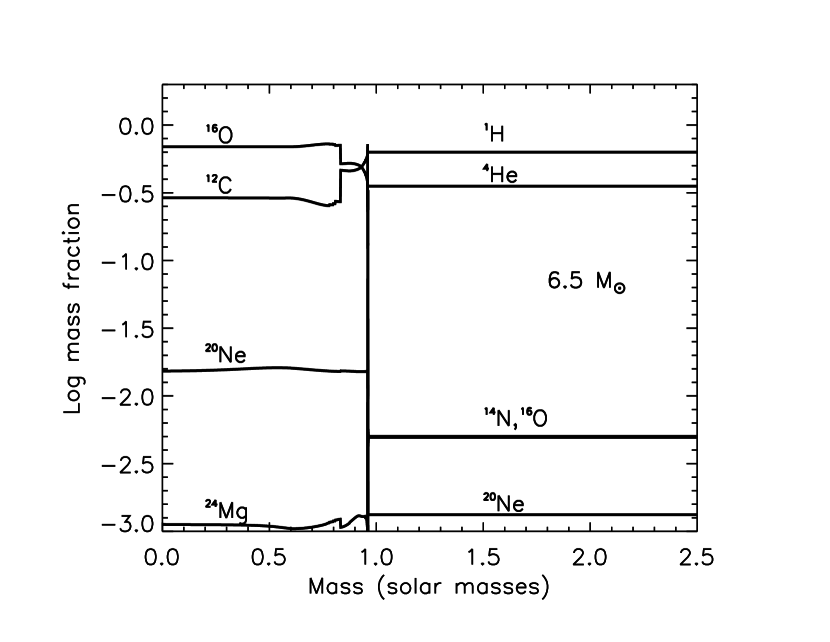
A representative case of a star that made a CO white dwarf was the model. This star had a main sequence lifetime of Myr and a helium burning lifetime of Myr, identical to the , model of Doherty et al. (2014). Our star developed a maximum helium convective core near helium depletion of , however, which resembles more their model (they found for the maximum convective core in that model). At central helium depletion, our helium core had a mass of . Later, convective dredge up reduced the helium core and CO-core to . At that time, the helium shell became very thin and flashes began. Our star then had a luminosity of erg s-1, a radius of cm, and a total mass of . Its central temperature and density were K and g cm-3, respectively, and its composition is given in Fig. 1.
The thin helium shell flashes were not resolved and the subsequent evolution of this star was not followed. For commonly employed mass loss rates, the envelope will be lost before the CO core approaches the Chandrasekhar mass and a white dwarf will result. There is some possibility that a few of these stars might become “Type 1.5 supernova” (Iben & Renzini, 1983) if the Chandrasekhar mass is reached before the entire envelope is ejected. Altogether, the model here resembled closely the to models of Doherty et al. (2014), the chief difference with their model being the greater extent of the helium convective region during core helium burning.
The model itself was an interesting transition case which ignited, but did not complete carbon burning. Its hydrogen and burning lifetimes were Myr and My and the maximum extent of the helium convective core, . At central helium depletion, the helium core mass was . Once again, these lifetimes are the same as the model of Doherty et al. (2014), but the extent of the convective core was more like their heavier model. Carbon burning ignited off center at when convective dredge up had reduced the helium plus CO core mass to . This is slightly less than the minimum core mass for carbon ignition of cited by Doherty et al. (2014). The density and temperature at the carbon ignition point were g cm-3 and K, similar to values previously found by Siess (2006). was at the ignition point reflecting the initial metallicity of the star with no appreciable electron capture prior to that point. A convectively bounded carbon-burning flame moved into the center, eventually giving the composition in Fig. 2. The central temperature and density for the last model calculated were K and g cm-3. was still 0.4986. Thin helium shell flashes were not resolved and the subsequent evolution of the star was again not followed. Overall the evolution of this model was similar to the model of Doherty et al. (2014) and the model of Siess (2006) (though one would have to go to the model of Siess (2006) to find a star that ignited carbon so close to the center).

The degenerate CO core of the model still had - carbon, by mass fraction, remaining in its interior (Fig. 2). If the envelope is not lost prior to reaching the Chandrasekhar mass, this would be sufficient to ignite a carbon deflagration and produce a Type 1.5 (single star) or Type Ia supernova (mass exchanging binary).
In summary, we find for this mass range, using the standard physics in KEPLER, a value for the upper mass that does not ignite carbon burning of approximately . This is about less than the often cited value of , but well within the range of values obtained in other studies. For example, Bressan et al. (1993) find of - and Poelarends et al. (2008) find a value of to . For other references and a discussion see Siess (2006). The range is probably largely due to the varying treatment of convective overshoot mixing and semiconvection by different groups.
3.2. Oxygen-Neon White Dwarfs and Electron-Capture Supernovae 7.0 -
Moving on up in mass, one encounters stars that are able to deplete carbon in their cores before becoming cold degenerate objects, but are unable to ignite neon and oxygen burning. Typical of stars in this mass range is the model. This star had a maximum convective extent during helium core burning of and a helium core mass at helium depletion of , comparable to the to model of Doherty et al. (2014). Our 7.5 model ignited carbon off center at where the density and temperature were g cm-3 and K, respectively. Carbon burning moved inwards as a CBF and, after reaching the center, was followed by episodes of carbon shell burning, finally leaving a degenerate core with the composition shown in Fig. 3 when all nuclear burning had ended. The size of the helium plus ONe core at that point was . The evolution of the model was similar, but it and all heavier models ignited carbon burning in the center.

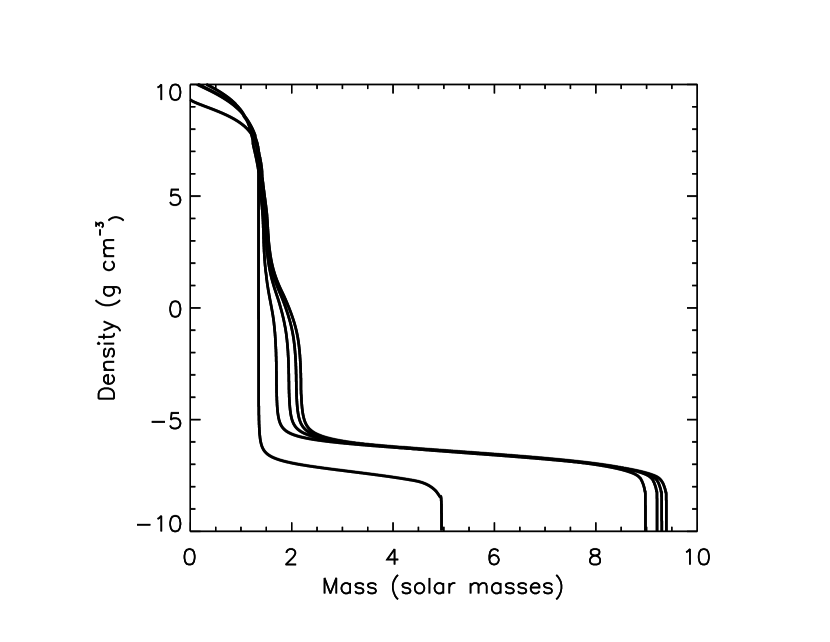
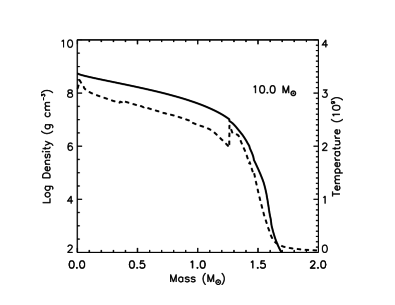
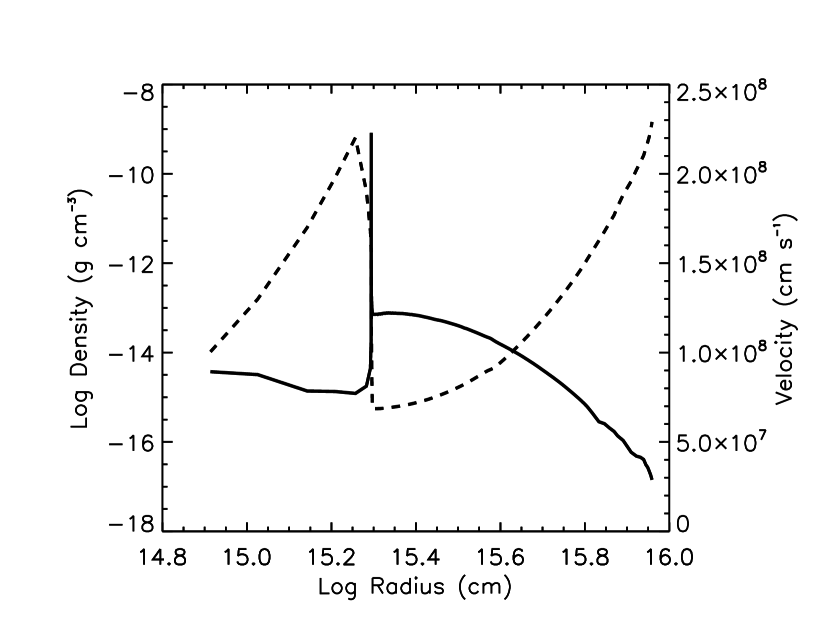
Further evolution would again have required the tracking of helium shell flashes in very low mass zones and an uncertain mass loss history, and was not attempted here. Other more thorough studies (e.g. Poelarends et al., 2008; Jones et al., 2013; Doherty et al., 2014) suggest that stars in this mass range will produce, in the common case, ONe white dwarfs. For some range of masses, depending upon the treatment of mass loss, the core will grow to the Chandrasekhar mass before the envelope is lost and an electron-capture supernova will result (Jones et al., 2013). The density structure at the end when a supernova occurred would be similar to that shown for the model in Fig. 4. By employing coarse zoning that suppressed thin shell flashes, that model was evolved until its core mass was and its central density was g cm-3, only a few hundredths of a solar mass short of collapse.
4. CONVECTIVELY BOUNDED FLAMES (CBFs) ABOVE 9.0
A major complication inhibiting the realistic modeling of heavier stars in the 9.0 to mass range (Table 1) is the need to realistically represent the CBFs that ignite during their post-carbon-burning evolution (Timmes et al., 1994; Iben et al., 1997; Siess, 2006; Jones et al., 2013, 2014). CBFs occur when any major fuel (hydrogen, helium, carbon, neon, oxygen, or silicon) ignites off center. Above 9.0 , hydrogen, helium and carbon ignite centrally and it is the combustion of the heavier fuels - oxygen, neon, and silicon - that complicates matters. The temperature inversion that causes off-center ignition is due to the interaction of degeneracy and neutrino losses and, because of the high temperature sensitivity of the burning processes, the energy transport above the burning region is always convective.
The fuel first ignites somewhere off-center in a degenerate flash. Depending upon the degree of the degeneracy, the flash can be weak or violent, and the burning quickly drives convection out to the mass necessary to radiate the excess energy as neutrinos. Initially, the temperature at the base of the shell is not high enough to lead to substantial inward motion of the burning front by conduction, though there could, of course, be convective “undershoot mixing”. That is, the low temperature in the temperature gradient immediately beneath the convective zone initially implies such a slow conductive flame speed that the time for the base to move inwards in mass is long compared to the time for the composition in the shell to evolve. Thus, initially, the base of the shell stays approximately fixed in Lagrangian coordinate while the fuel burns in a shell. As the temperature at the base of the convective shell rises in response to the decreasing mass fraction of fuel though, the conductive flame speed, which is very sensitive to that “bounding temperature”, accelerates inwards. In the resulting flame, burning in the temperature gradient just beneath the convective shell raises the local temperature to a critical value where nuclear energy generation exceeds radiative and conductive losses. That region then flashes to a higher temperature that is super-adiabatic compared with the next zone out. Unspent fuel spills into the convection shell and is mixed outwards, providing a new source of fuel for burning in the shell. The energy produced is mostly lost to neutrinos. The next zone in heats up by conduction and the process repeats. As the flame moves into the unburned matter, the decreasing area bounded by the flame requires the flame to move faster, hence it becomes hotter.
4.1. A Microscopic View of CBFs
There are two ways of viewing such flames. The “microscopic view”, which has just been described, envisions the flame as a thin sheet with a specified boundary temperature that propagates locally, by conduction, into a homogeneous medium with prescribed properties like a modified laminar flame (e.g. Timmes et al., 1994). The other “macroscopic” view (§ 4.2) views the flame as a boundary condition the star adjusts to accommodate the global constraints of hydrostatic equilibrium, composition, and neutrino losses. The two views are complementary ways of describing the same physical phenomenon.
In the microscopic view, if the flame were well resolved (it isn’t usually), the process of burning and mixing would be continuous. The energy generation resulting from the flame’s propagation would vary slowly according to the local composition, density, and bounding temperature. The flame properties would agree with those estimated by evaluating the usual laminar flame speed formula (Landau & Lifshitz, 1959) with appropriate modifications,
| (1) | |||||
| (2) |
where is the flame speed, , its width, , the nuclear energy generation rate, , the reciprocal mean free path, c, the speed of light, and , the energy difference, in erg g-1, between the cold fuel beneath the flame and the base of the convective shell. Results are most sensitive to the energy generation, and it is here that things can become complicated. For a “free flame” the temperature and energy generation can rise without bound and the above equations give a very narrow, fast flame (Timmes & Woosley, 1992). At 109 g cm-3, for example, the flame speed and width for an oxygen-neon burning flame are 6.4 km s-1 and cm. For the CBF, however, the burning temperature cannot exceed the bounding temperature. In fact, the temperature where conduction inwards balances energy generation is a bit less than the bounding temperature (Timmes et al., 1994, their Fig. 8). Thus a CBF moves much more slowly and is broader than an unbounded or “free” flame.
4.1.1 Oxygen Burning CBFs
A case of particular interest here is a CBF moving into a core of about 60% oxygen and 30% neon. Eventually, both oxygen and neon burn, but in the conductive region that sets the flame speed, only a little fuel has burned, and that is chiefly neon. Since neon burning proceeds by a photodisintegration-rearrangement reaction, the energy generation is, to first order, independent of the density. Taking a temperature of K gives an energy generation rate in the neon-oxygen material in KEPLER using the 220 isotope network of erg g s-1. Order of magnitude estimates for the other quantities in eq. (2) at an appropriate time in, e.g., a 9.5 model are cm-1 and and erg g-1. Both quantities depend only weakly upon the temperature and density. Using these values in eq. (2) gives a crude estimate of the flame speed of cm s-1 and its width, 3500 cm.
More accurate results have been obtained off-line from the highly resolved numerical modeling of parametrized flames. Such studies have been done for oxygen-neon flames (Timmes et al., 1994), but not for silicon burning. For the oxygen-neon flame described above, these studies find, for K, a flame speed = 1.91 cm s-1 and width, = 250 cm, very much smaller than any practical stellar zone thickness. Apparently evaluating the energy generation at 90% of the bounding temperature though, 1.8 vs 2.0 K, gives the correct order of magnitude. Changing the bounding temperature used in the estimate would greatly distort the speed-to-width ratio, though one could artificially change the opacity and achieve agreement. The chief use of eq. (2) is in understanding and extrapolating the more accurate numerical studies. For example, in Table 6 of Timmes et al. (1994) the flame speed depends on the bounding temperature roughly as T18. This is the approximately the square root of the temperature dependence of the energy generation rate in KEPLER in the relevant temperature range. Similarly the width goes as T-18 and both are approximately independent of the density.
In order to follow oxygen-neon flames in KEPLER, a subgrid representation of the propagation was implemented. First the location of the flame on the grid, if there was one, was determined based upon composition and temperature information. A flame was deemed to exist when, moving outwards, a stellar zone was encountered where the temperature increased by more than 10% and the mean atomic weight decreased by more than 2%. In addition, the hotter zone was required to be hotter than . For cooler temperatures the flame speed is negligible. This algorithm, which was only used for neon and oxygen burning, proved successful in unambiguously determining the location of the burning front. Energy was then artificially deposited in the cooler underlying zone on a time scale given by the thickness of the zone, , divided by the desired flame speed, . The effective energy generation rate in the cool zone, j, was then
| (3) |
where is the internal energy in erg g-1 of the cooler zone, , the internal energy of the hotter zone, F, a multiplier of order unity, and , the artificial energy generation rate in erg g-1 s-1. This was added to any nuclear energy generation in zone j. In order to conserve energy and maintain code stability an equal amount of energy was subtracted each time step from the hot zones, j+1 though j+5. In practice, convection kept those zones coupled to the larger heat reservoir of the convective shell surrounding the flame. In response to the artificial energy deposition, the cooler zone was gradually heated to some flash point where its nuclear energy generation exceeded in eq. (3), after which the temperature in the zone rapidly ran away until it became convectively linked with zone j+1. The flashing of individual zones resulted in a sputtering flame, but one whose average speed was determined by and F. The parameter F was adjusted to make the flame move at a value close to the actual value of , which empirically required .
It remained only to prescribe . Fortunately, in the case of oxygen burning CBFs, there exist off-line studies that gave the flame speed as a function of bounding temperature (the temperature of zone j+1) quite accurately. These are given in Table 5 of Timmes et al. (1994). While this table is for a single composition, the actual composition in our stars was not far from 60% oxygen, 40% neon and the results do not depend sensitively upon the actual mixture. The density range of the table, 2 - g cm-3, needed to be extended down slightly to a few g cm-1, but fortunately, as discussed above, the oxygen-neon CBF is not sensitive to density. A fit to Table 5 of Timmes et al. gave
| (4) |
where n is 18 in the range , 13, for , and 10 for . In practice, the subgrid model gave a flame that moved at a speed that was typically within a factor of two of this value.
While this approach worked well in a 1D stellar evolution code, the actual stellar physics is certainly more complicated. The flame probably remains thin, but the fuel-ash interface may significantly diverge from spherical symmetry. In particular, Rayleigh-Taylor instability or convective undershoot mixing might significantly accelerate the burning. The laminar CBF speed used here should thus be regarded as a lower bound to the actual burning rate in 3D.
4.1.2 Silicon burning CBFs
Unfortunately there are no corresponding tables for the propagation of a CBF in dense, neutronized silicon and sulfur. A rough estimate of the flame’s properties can be obtained using equation 2. While the bounding temperature changes significantly with time, a representative condition might be K for a density g cm-3. For a neutron-rich mixture of silicon and sulfur isotopes, mostly 30Si and 32Si. the nuclear energy generation rate from KEPLER at a temperature near 90% of is erg g s-1. Taking cm-1, and erg g-1 gives a flame width of about 30 cm and speed of 9 m s-1, considerably faster than the oxygen-neon CBF described above. A fine zoned calculation of a small sphere (59% 30Si, 34% 32Si, 3.5% 34S, and 3.5% 36S; = 0.456) at constant pressure with zoning of about 1 cm using the technique of Niemeyer & Woosley (1997) gave a width of about 10 cm and a speed of 2 m s-1. Both estimates are order of magnitude guesses and the real speed will vary considerably with the bounding temperature, but the estimates show that the silicon flame is also very thin and moves rapidly.
Fortunately, the speed of the silicon burning CBF is not crucial to the most important conclusion of this paper, namely the dynamical nature of the silicon flash in stars around 10 . Also, other physics comes into play that may render the propagation speed of a laminar silicon flame moot. The burning interface is increasingly Rayleigh-Taylor unstable because of the inversion of mean atomic weight and , and this instability also causes the rapid advancement of the burning.
Following the silicon flash in stars from 9.0 to 10.2 , there remains a core of unburned silicon of up to 0.4 (much less in the heavier models; Table 2). This silicon nodule is surrounded by a thick shell of iron that has experienced substantial electron capture. The silicon itself is also neutron rich, having been made by an oxygen CBF operating at high density, but not so neutronized as the iron above it. Representative values for the electron mole number are = 0.465 for the silicon and 0.45 or less for the iron. The mean atomic mass is also inverted with in the silicon and 54 in the iron. Were it not for the accompanying temperature inversion, the iron-silicon interface would clearly be Rayleigh-Taylor unstable.
The temperature is inverted, though, with to 5 in the iron ash, once the core has relaxed and reignited silicon burning, and in the silicon. This temperature inversion prohibits mixing so long as the bounding temperature stays above a critical value. Neutrino losses are continually seeking to cool the convective shell and erode this barrier. The iron is kept hot by the small influx of silicon that is continually being mixing outwards from the silicon CBF. Were this mixing to stop, the silicon abundance would decrease in the convective shell, the temperature would go down, just a bit, and the interface would become Rayleigh-Taylor unstable. This would mix silicon out and rekindle the burning.
Employing the Ledoux criterion for convection, the solution the KEPLER code finds to this constraint is to, rarely and briefly, convectively link a single cooler silicon zone with an overlying hotter convective zone of iron. A small amount of mixing powers a brief resurgence of burning in the convective shell that raises its temperature slightly above the threshold required for instability by the Ledoux criterion and shuts off the convective link with the inner zone. Once the bit of fuel that was mixed outwards gets depleted, the temperature in the convective shell decreases and the convective linkage occurs again. Backups in the code prevent a large amount of fuel from mixing during a single episode.
Over time, the mixing also raises the temperature in the cooler zone by bringing in hot ash. Eventually, its temperature increases to the point where the cooler zone itself runs away and became permanently convective. The burning in KEPLER is thus self-regulating. If too little fuel is mixed into the burning front, the convection shuts off and the bounding temperature declines, making the inversion in and more effective and causing new mixing. If too much is mixed, the bounding temperature rises and shuts off mixing.
While this behavior reflects a real mixing instability, its implementation is debatable. The burning front advances because of intermittent convection, not conduction. What does it mean for convection to turn on and off on sub-millisecond time scales - far faster than e.g., sound can cross a zone? Basically, it is the star’s response to a real macroscopic dilemma - how to keep burning when the only available fuel lies beneath a temperature inversion that acts to stabilize it against mixing. However the mixing occurs, it must continue at a rate sufficient to at least balance the star’s neutrino losses. Throughout the mixing of a single zone, the global neutrino losses, , stay relatively constant. The average flame speed is then
| (5) |
where is the energy yield per gram from burning a given fuel - oxygen or silicon, is the radius of the flame, and , the local density. For typical conditions, 1044 erg s-1, cm, erg g-1, and g cm-3, the necessary flame speed is cm s-1. This is not very different from that expected for a conductive flame had one been resolved, based on the relations in § 4.1.2, and perhaps both processes operate. An analytic subgrid model for silicon CBFs was not included in the present study however.
4.2. A Macroscopic View of CBFs
Consider a degenerate stellar core with a mass slightly in excess of the cold, non-rotating Chandrasekhar mass for its given composition, especially for its distribution of . Ignoring rotation, such a configuration can only be stabilized against collapse by the presence of finite entropy. An effective Chandrasekhar mass can be defined (e.g., Baron & Cooperstein, 1990) as
| (6) | |||||
| (7) |
where is the Fermi energy, roughly MeV for a relativistic degenerate gas, and is the electronic entropy, roughly . For a given core mass and then, there is a minimum entropy required to stabilize the core against collapse.
Now consider now a core where electron capture in a convective burning shell has reduced substantially below 0.50 (a value of 0.46 to 0.48 might be typical) in a large fraction of the mass. This happens in oxygen and silicon burning, but not in carbon burning. Assume further that before the capture ensued, the core already had a mass very close to the cold Chandrasekhar mass for , i.e., 1.39 , including corrections for relativity and Coulomb forces. In the absence of nuclear burning, a core with the new would collapse, as also noted by Jones et al. (2013). Within this core however, there is a convective burning shell with base temperature and extent . Because the temperature gradient in the convective shell is adiabatic, the extent of the shell depends mainly on , so there are really just two variables, and the location in mass of the burning shell. For a given CBF location, the bounding temperature must be at least adequate to stabilize the star against collapse.
At the necessary high temperatures, neutrino losses by the pair and plasma processes (mostly the former) will attempt to drive the temperature down and make the core unstable to collapse. The instability is exacerbated by further electron capture within the convective shell which reduces . Energy generation to balance these neutrino losses can only be obtained by the advancement inwards of the CBF. Much as in “ordinary” massive stars with stationary oxygen burning shells, the burning seeks to maintain, on the average, an overall condition of “balanced power” (Woosley et al., 2002) with neutrino losses balanced by nuclear energy generation. Here however, the temperature-sensitive rate at which the flame moves plays the role of the nuclear energy generation rate. The star seeks and finds a solution where the flame moves at the necessary speed to balance neutrino losses in the convective shell. Not too surprisingly since the mass fraction of the oxygen in the convective shell outside the CBF is non-trivial, typically from 1% to 10% by mass, the bounding temperature at which balanced power is achieved is similar to that for ordinary oxygen shell burning, roughly K. The flame thus moves at a speed cm s-1 and the neutrino losses are typically 1042 - 1043 erg s-1.
The silicon burning flame stabilizes at a larger temperature and flame speed where intermittent Ledoux convection mixes out enough silicon to provide a global neutrino loss rate of about 1045 erg s-1. This is what is required if silicon is to burn in a convective shell with temperature at its base 4 to The flame neither accelerates rapidly nor extinguishes, but obeys, on the average, a condition of balanced power.
5. OFF-CENTER OXYGEN BURNING AND SILICON FLASHES - 9.0 TO
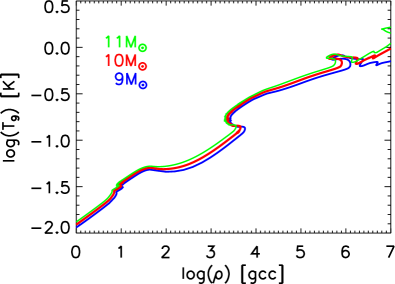
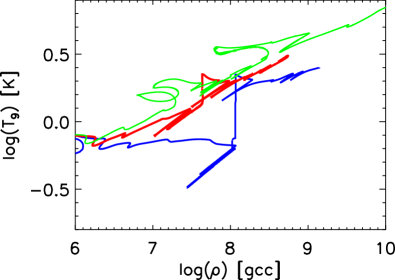
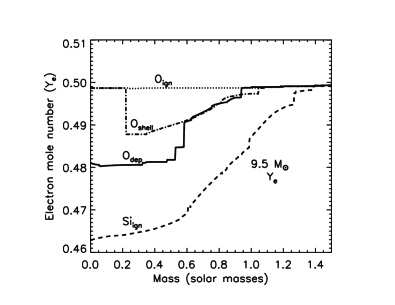
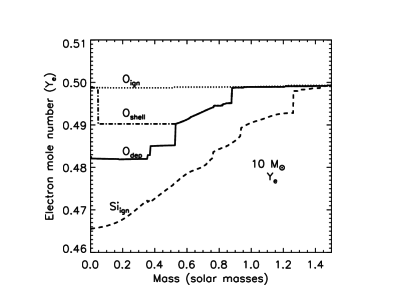
We are now equiped to discuss the actual models in the 9.0 to 10.3 range. Above 9.0 , for the assumed physics, the evolution of a massive star short of the pair-instability limit culminates in the production of an iron core in hydrostatic equilibrium that collapses to a neutron star or black hole. For stars from 9.0 through , the effects of degeneracy are still very strong and, while carbon ignites centrally, neon and oxygen do not. Silicon too usually ignites off center, (Table 2), in a powerful flash. At the upper end of the mass range (9.8 - 10.3 ), the flash is robustly violent enough to lead to a localized thermonuclear runaway, a “silicon deflagration” (§ 6). Deflagration may also occur for other masses in this range (e.g., the 9.0 and 9.3 models), but the occurrence at lower mass is more sensitive to the treatment of the flame. A 9.0 model which used an artificially slow oxygen burning flame did not experience a deflagration. Fig. 5 summarizes the final state of three stars, two of which experienced a very strong silicon flash culminating in deflagration (9.0 and 10.0 models) and one of which evolved “normally” igniting all burning stages at its canter (11.0 model). Fig. 6 shows substantial electron capture occuring the in oxygen burning CBF in the 9.5 and 10.0 models.
5.1. Strong Silicon Flashes - No explosion
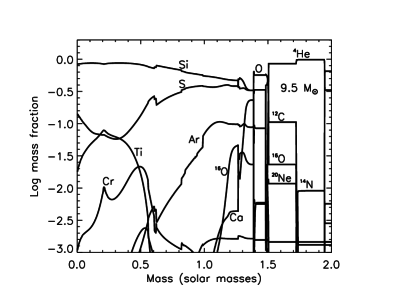
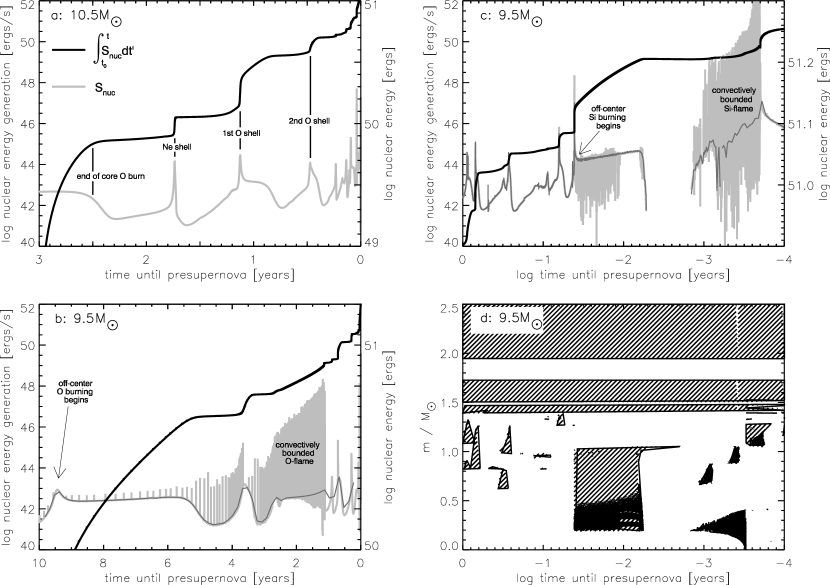
Consider the illustrative case of the 9.5 model. Twenty-one years prior to iron core collapse, neon ignites in a gentle “flash” 0.252 (1560 km) off center. The neon burns in a growing convective zone that eventually extends to 1.1 . Briefly, neon burning develops a power erg, but after about a month, the power declines to 1042 erg s-1, where it remains for about 10 years. When the neon in this shell has been depleted, the temperature at the shell’s base rises to K and a neon-burning CBF develops and begins to move inwards. The flames velocity is very slow though, and three years later, it has only reached 0.217 while its temperature has climbed to K, sufficient for oxygen burning. Off-center oxygen burning thus commences with another mild flash 9.5 years before iron core collapse (Fig. 7 and Fig. 8). The burning initially powers convection out to 0.85 . A combined neon-oxygen burning CBF then begins its advance into the core while the extent of the convective oxygen burning shell shrinks in mass. About 5 years before core collapse, oxygen has been only partly depleted in the convective shell and with 3.6 years remaining, the temperature at the CBF becomes high enough for the oxygen convective shell to briefly grow again. There follows a resurgence of burning resulting from the rapid regrowth of the convective shell out to 0.9 . After burning out the oxygen in that shell, the CBF resumes its inwards progress eventually arriving at the center 1.1 years before the iron core collapses.
It is interesting to compare the properties of this oxygen burning flame with those discussed in in § 4. During the interval from 3.0 to 1.1 years before collapse, the flame moves from 1300 km to the stellar center while maintaining a flame temperature between 1.9 K and K. The average flame speed in KEPLER was about 1 cm s-1. This agrees reasonable well with the the 0.5 - 2 cm s-1 range given by eq. (4).
After the oxygen CBF reaches the center of the 9.5 model, there follows a period of about a year of residual oxygen shell burning in the outer part of the star and Kelvin-Helmholtz contraction in the inner part, during which the central density rises from g cm-3 to g cm-3. Electron capture in the oxygen convective shell and flame has already substantially reduced so that the core is more massive than the cold Chandrasekhar limit(Jones et al., 2013, and Fig. 6). Eventually, silicon ignites very degenerately, off-center at 0.186 . This ignition is violent, but not quite hydrodynamic. The temperature at the base of the silicon shell rises to K at g cm-3 where . The nuclear power briefly reaches 1048 erg s-1 (log t = -1.4 in frame c of Fig. 8), close to the value where convective transport would break down (§ 5.3). This large power and rapid expansion of the silicon core ( km s-1) launches a shock with speed about 30 km s-1 in the declining density gradient at the edge of the core, but this shock attenuates as its momentum is shared with a large amount of envelope mass and it never makes it to the stellar surface before the core collapses.
Following the initial flash, silicon burns in a convective shell for about two weeks (Fig. 8). For the first 8 days, the burning occurs in a core that is still “ringing” from the strong flash. During the last week the pulsations damp out though. Even though there is no well-defined silicon burning CBF yet, the energy generation during the pulsational phase varies wildly. Roughly erg is released, and many strong sound waves are launched into the envelope, but none are sufficiently violent individually or collectively to eject the envelope.
After the silicon has burned to almost zero in the convective shell, a silicon burning CBF begins its propagation to the center of the star. This takes about 11 hours to move 600 km with an average flame speed that, in KEPLER, was about 15 m s-1. The higher speed here (as compared with the oxygen-burning CBF) reflects the much higher neutrino losses, 1045 - 1046 erg s-1 that accompany the greater burning temperature (Fig. 8), and to a lesser extent, the smaller energy yield from burning silicon instead of oxygen. The flame must advance faster to compensate (eq. (5); § 4.2). The speed is also not too far off from that expected for a silicon CBF had one been included (§ 4.1.2), though the progression here is actually determined by the Rayleigh-Taylor instability.
Once the silicon-burning CBF reaches the center, the inner 1.06 is already composed of neutronized iron, but final collapse is delayed until an additional 0.23 of silicon burns in a shell. This takes 2.6 hours, and then the core collapses.
The 9.1, 9.2, 9.4, 9.6 and 9.7 models were qualitatively similar to the 9.5 model, differing chiefly in the nature of the silicon flash which occurred closer to the center of the star in the heavier models. The 9.0 and 9.3 models, on the other hand, were different and more similar to the silicon deflagrations to be discussed in § 6. This because an additional oxygen burning shell developed that allowed more cooling and greater degeneracy when silicon ignited. The non-monotonic behavior of the late stages of evolution due to the interplay of carbon and oxygen burning shells has been discussed by Sukhbold & Woosley (2014).
5.2. Nuclear Power and Possible Mass Loss in the Last Decade
It has been suggested that the last years in a massive star’s life might be characterized a by very large mass loss rate driven by the acoustic transport into the envelope of a portion of the vastly super-Eddington powers developed in the star’s convective shells (e.g., Quataert & Shiode, 2012; Shiode & Quataert, 2014). The loss of even a fraction of a solar mass during the last few years would substantially modify the spectrum and light curve of the supernova that results when it dies. Stars around 10 are interesting in this regard because they spend a longer time burning oxygen than their higher mass cousins. For example, the 10.5 model begins oxygen burning 8.8 years before iron core collapse. For a 25 star (Woosley & Heger, 2007), the corresponding time is 0.49 years. The envelopes of these lower mass stars are also very loosely bound, with net binding erg, and have steep density gradients around a degenerate core that could serve to accelerate sound waves into shocks. Since the burning of a solar mass of oxygen to iron releases about 1051 erg, even inefficient energy transport by sound waves could potentially have a large effect.
Fig. 8 shows the power developed by nuclear reactions in the cores of 9.5 and 10.5 stars during their last 10 and 3 years respectively. The 10.5 star is an example of a massive star that ignites all burning stages in its center. It is extreme only in being a light example of this class. No CBFs form at any point. The nuclear power after oxygen ignition stays at erg s-1 for a few months and then declines to around 1 to erg s-1 where it remains for 6 years until oxygen is depleted in the stellar center. Over the next two years oxygen and neon burn in shells, developing power that briefly climbs above 1044 erg s-1 when the shells ignite, and then, following a brief phase of silicon burning, the iron core collapses to a neutron star.
The 9.5 model, on the other hand, is characterized by CBFs during both its oxygen and silicon burning phases. Like the 10.5 model, it maintains a nuclear power over 1042 erg s-1 for about a decade, but the mechanics of the burning is different. The star ignites neon burning 20 years before core collapse and, as the neon depletes in the shell 10 years later, the burning transitions into first a neon-burning, and then an oxygen-burning CBF. Since the zones in the vicinity of the flame have nearly constant mass, the spikes in energy generation from individual zone flashes indicate the progress of the flame in Fig. 8. Typical zoning in within 0.1 of the silicon flame was 1030 gm (0.0005 ) and the full calculation of the 9.5 evolution required over 500,000 models. Much finer zoning would have been impractical and not added greatly to our understanding. 3.5 years before core collapse, the CBF pauses while oxygen burns in a growing convective shell. About 1050 erg is released during this shell burning. Over the next 2.2 years, an oxygen-burning CBF moves to the center of the star (§ 5.1).
During its last year, the core experiences several episodes of oxygen shell burning as the residual abundance of oxygen in the outer core burns away. These are not CBFs, just regular shell burning, but they help support the core while it cools by neutrino emission. Finally, during the last two weeks, silicon ignites with a violent flash and burns in a new CBF (silicon-burning). Two hours after that flame reaches the center, the iron core collapses. Large powers (over 1046 erg s-1) are developed during and after the silicon-burning CBF propagation, but this energy is deposited so late that, baring a hydrodynamical event, it probably has little effect on presupernova mass loss.
Without multi-dimensional simulation the real physical nature of these oxygen and silicon burning CBFs is difficult to know. The sputtering of individial zones is artificial, but still the matter in the flame is degenerate. Localized runaways may result in the more effective production of acoustic energy than ordinary convection.
5.3. The Limits of Convection
In the , , and models, the maximum luminosity in the silicon convective shell during silicon ignition briefly reached , , and erg s-1, respectively, and the expansion speed exceeded several km s-1. The silicon burning luminosity peaks as the burning density at the shell declined below about g cm-3 when the burning temperature was near K. As will now be shown, luminosities this large are close to the limit of what can be carried by convection at these radii and densities.
The maximum power that convection can carry is approximately
| (8) |
where is the radius of the shell, about km; is the density when the luminosity is maximal, about g cm-1; is the convection speed which must be substantially subsonic, i.e., of order km s-1; is the heat content, close to 10erg g-1; and reflects the fact that the luminosity can only remove a small fraction of the heat content of a zone in a convective crossing time without shutting off the convection. For , erg s-1. This limit is consistent with what was observed in KEPLER. Models that developed greater luminosities were unable to transport the power by ordinary convection and a localized runaway developed.
6. EXPLOSIVE SILICON BURNING - -
From through and also for and (8 models), oxygen burning, ignites off center, and then burns to the center of the star in a CBF. Subsequently, a series of oxygen shell burning episodes culminate in the production of a roughly Chandrasekhar-mass of degenerate silicon. Substantial neutronization has already occurred by this point resulting in a decrease in the Chandrasekhar mass before silicon ignites (Fig. 6). Further neutrino cooling after oxygen depletion thus lead to increased degeneracy and a potentially explosive configuration.
Silicon thus ignites in these stars as a powerful deflagration generating a shock wave that propagates into the hydrogen envelope. While the calculations unambiguously show the occurence of some sort of dynamic event, accurate results are difficult to obtain because, once the runaway becomes localized to an off-center point, the further evolution is inherently three dimensional.
6.1. Evolution at
For illustration, consider the model. This model begins its runaway in a fashion similar to the (top frame of Fig. 7), but nuclear energy generation rapidly grows to super-critical levels (§ 5.3). Igniting at (instead of for the model) and a density g cm-3, the temperature quickly rises from K at ignition (when convection first begins), reaching K just as the maximum luminosity in the shell exceeds erg s-1. This temperature, , plays a similar role to in the carbon runaway in SN Ia (Woosley et al., 2004). Silicon flashes that do not reach this threshold temperature do not become explosive and cause hydrodynamical mass ejection (§ 5.1). Once the temperature exceeds this value, however, convection freezes out and a single zone runs away in isolation, reaching a maximum of K only 1.7 ms later. During this time, the silicon and other intermediate mass elements in that zone burn to nuclear statistical equilibrium.
At this point, a localized flame has been born. What happens next is uncertain. A density inversion might develop leading to Rayleigh-Taylor instability, as in a SN Ia, but this was not immediately apparent in the KEPLER model after the runaway of a single zone. If convection was turned off when the luminosity reached erg s-1, the burning still propagated for brief period as a detonation wave through about (6 zones). This happened because the phase velocity for the burning implied by the adiabatic temperature gradient at such high luminosities was supersonic. Had convection been turned off at a lower luminosity this supersonic burning probably would not have occurred. The fact that a detonation induced by a shallow temperature gradient failed to survive is also suggestive that detonation may be difficult to achieve in a silicon-rich composition.
Once the detonation died, expansion of these burned layers did result in a density inversion of about - comparable to the decrement seen in carbon-deflagration models for SN Ia. So the likely outcome here is a silicon deflagration - but in how extensive a region? How much mass would burn? Based upon the well-studied case of off-center ignition in SN Ia, the runaway might initially ignite at a single point (Nonaka et al., 2012), not in a symmetric spherical shell. If only a single point ignites and gives rise to a single plume of burning, the total mass consumed in the deflagration may be small (Malone et al., 2014). Until the core expands significantly, degenerate burning would continue however, possibly igniting in more than one location. Without detailed 3D studies (for an analogue see Zingale et al., 2013), it is difficult to say just how much silicon burns. If a subsequent transition to another detonation occurs later, then an appreciable fraction of the entire core could burn, but this may be even more difficult to achieve for silicon than for carbon and oxygen.
Given the smaller energy yield from silicon burning (as opposed to carbon burning) to iron, the silicon core will not be fully disrupted, even if a significant fraction burns. The binding energy of the star at this point is erg. Silicon burning to iron releases only erg for each solar mass of silicon burned. The core is relativistically degenerate, however, with a structural adiabatic index close to , so even a little burning causes significant expansion. If that expansion is sufficiently rapid, the shock wave it creates can eject the loosely bound envelope. Typically the net binding energy of most of the hydrogen envelope is near erg (Table 1). For the model at onset of the silicon flash, the total star mass is and the binding energy outside of the inner is erg. Outside of the inner , it is erg. Burning to iron yields erg, so there is no dearth of energy to cause an explosion of some sort. Transporting this energy out of the core by a shock wave though, and giving the envelope enough momentum to exceed its escape speed is much more difficult.
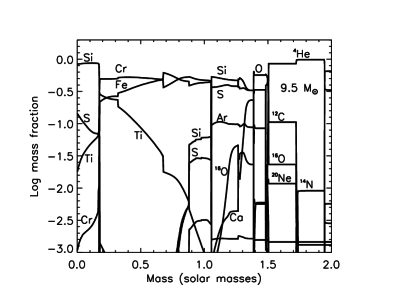
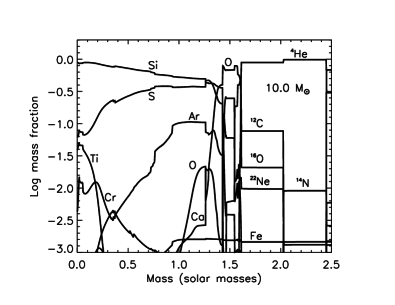
Other models in the though range experienced a similar evolution to , though the heavier stars ignited silicon closer to or at the center (Table 2). The composition of the model at the time silicon ignites is given in Fig. 9. Above , silicon ignited gently and the stars evolved to iron core collapse with their envelopes still intact. The , and models ignited all advanced stages, carbon, oxygen, and silicon burning at center of star and can thus be considered “normal” core-collapse supernovae.
6.2. Mass Ejection
The observable outcome of these models depends upon the amount of silicon that burns hydrodynamically. A small amount of burning does not eject the envelope, or ejects it so slowly and so close to the time of iron core collapse that there is little observable distinction compared to a star in which no silicon flash occurred. Because of the uncertainties inherent in a 1D simulation a variety of outcomes was explored and parametrized by how much silicon burns explosively. Table 3 gives, for each case where explosive silicon burning occurred, the amount of silicon burned in the initial flash (“Fe-Mass”), the delay time between the silicon flash and iron-core collapse, the photospheric radius of the presupernova star (which may be small if the ejected envelope has already recombined), the velocity of the ejecta from the silicon flash (if any) at the time of iron core collapse, and the luminosity of the star or remaining core when the iron core collapses. Cases of high velocity and large radius (cm) or high luminosity indicate a prior supernova in progress when the core collapses.
In all cases, the burning was allowed to propagate artificially, for a time, at nearly sonic speed by leaving convection on well past the stage where the luminosity exceeded erg s-1. Some variation in outcome was achieved by changing the efficiency of the convection using a multiplier on the calculated convective velocity (“Conv. Param.” in Table 2). No physical significance is attributed to this operation. It is just a way of producing variable amounts of burning. The upper bound to the mass that burns, around , occurs when the density becomes sufficiently low that the complete burning of silicon to iron produces too little energy to raise the fuel to a temperature where it world burn in a Courant time scale (sound crossing time for a zone). Thus a detonation wave, if there were one, would likely stall after burning this mass.
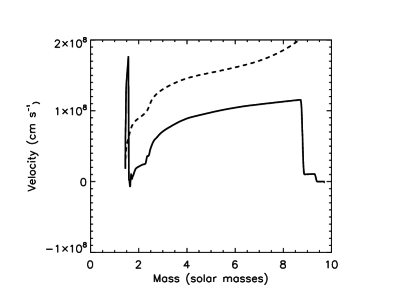
Having explosively produced the given “Fe Mass”, the core expands sending out a strong pulse that steepens into a shock wave in the steep density gradient at its edge. Afterwards, the core pulses a few more times and experiences a Kelvin-Helmholtz phase of variable duration before finally settling down to ignite silicon shell burning stably. Continued evolution in all cases gave an iron core that collapsed to a neutron star, presumably launching some sort of additional explosion (§ 7.1). The delay time between the onset of the first explosive silicon flash and the final iron core collapse is given as “Delay Time” in Table 2 and varied from a couple of weeks to a couple of years. The final velocity structure for several models parametrized by the amount of silicon that burned is given in Fig. 10.
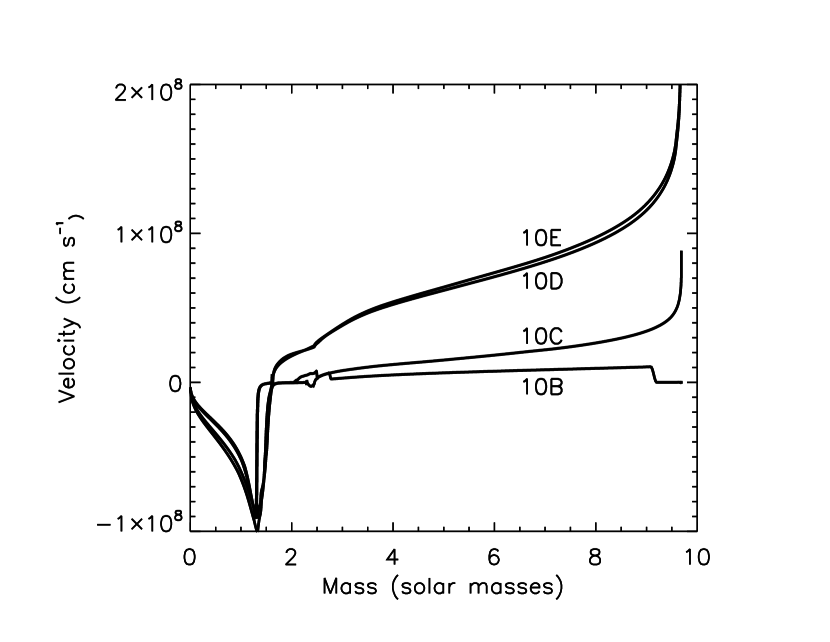
In some cases, when only a little silicon burns, like in Models 10A and 10B, the shock wave either never makes it, or barely makes it to the surface before the iron core finishes evolving and collapses to a neutron star. Thus the “presupernova” radius and main light curve are not appreciably altered. There might be appreciable changes, however, in the supernova luminosity at break out and in the presupernova density structure near the iron core.
In other cases where the amount of silicon burned was greater, however, envelope ejection occurs well before core collapse (Models 10C, 10D, 10E) and the observable supernova was very different. Essentially two supernovae occurred in rapid succession, and the second one could be very bright. In these cases the velocity of the outer layers was large and, if enough time elapsed for significant recombination, the photospheric radius and radius of the outermost eject may differ - hence the two entries for the photospheric radius and the “edge” in Table 3.
7. SUPERNOVAE, BRIGHT AND FAINT, SINGLE AND DOUBLE
7.1. Rotation, Energetics and Light Curves
Numerous studies (e.g., Woosley & Baron, 1992; Fryer et al., 1999; Dessart et al., 2006, 2007) have shown that (at least) a low energy explosion, erg with of 56Ni ejected, is an inevitable consequence of the accretion-induced collapse of a white dwarf. If nothing else, the neutrino-powered wind that accompanies neutron star formation will release that much energy (Qian & Woosley, 1996; Kitaura et al., 2006). The cores in Fig. 4 are so hydrodynamically detached from their low density envelopes, and their mantles of helium and carbon so small, that their collapse will closely resemble bare white dwarfs. Calculations of accretion-induced collapse are thus directly applicable to the study of supernovae in this mass range and similar results are expected and have been obtained for non-rotating stars by Kitaura et al. (2006) and Burrows et al. (2007).
With rapid rotation and large field strengths, both the energy and mass ejected could be considerably greater (Dessart et al., 2007), but the rotation rates and field strengths required may be unrealistically large. Given the long period spent by single stars as a red supergiant, magnetic torques will likely lead to the core rotating slowly at the time of its collapse. A single test case, a , solar metallicity model evolved here to core collapse including rotation and magnetic torques as in Heger et al. (2005), had an angular momentum interior to the base of the oxygen shell at of erg s. The angular momentum in the iron core alone, , was erg s-1. Assuming a pulsar moment of inertia, (Lattimer & Yahil, 1989; Lattimer & Prakash, 2001) and radius 12 km, this implies a pulsar period near 17 ms and a gravitational mass of 1.2 to . This estimated period compares quite favorably with observationally inferred estimates for the Crab pulsar rotational period at birth of ms (e.g., Muslimov & Page, 1996; Heger et al., 2005). Such a slow period for a neutron star implies a rotational kinetic energy of less than erg, so even the inclusion of rotation is unlikely to produce an explosion of erg.
We note in passing that the low explosion energy, essentially from a spherically symmetric neutrino-powered wind, and the lack of appreciable accretion during the explosion, might imply a low “kick-velocity” for the Crab pulsar (Wongwathanarat et al., 2013). Measurements (Kaplan et al., 2008) suggest that the Crab pulsar moves slower than most others, and even that speed could be a consequence of a progenitor that had run away from a binary and a prior explosion.
For now, to illustrate the qualitative features of the resultant supernovae, we adopt here an explosion energy at the time of iron core collapse of erg, and explore the consequences. Since the interaction with the ejected envelope considerably slows the ejecta from the core collapse and can even radiate a large part of the energy as light, this energy must be evaluated somewhat differently than the customary “kinetic energy at infinity” criterion. Here we use the explosion energy to be defined as the net energy on the grid (gravitational binding energy plus internal energy) when all nuclear reactions have stopped and the explosion is well underway. This is, however, well before any shock has erupted from the surface of the star or any bright display commenced.
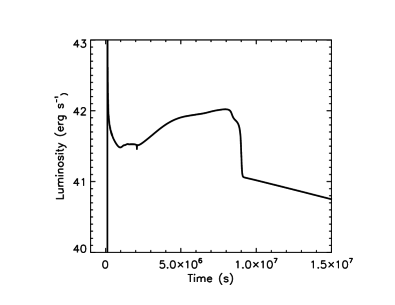
Using a piston to impart a net energy of erg to the matter outside the collapsed core in Model 10B, the resulting shock from core collapse overtook the shock from the earlier silicon flash just as the latter was breaking out (Fig. 11). The resulting light curve is thus very similar to what would be obtained had there been no silicon flash - a relatively faint, long lasting Type IIp supernova. This solution should be representative for all the models in Table 3 where the velocity at the “edge” of the star is zero and where the photospheric radius approximately equals the edge radius, i.e., the star has not significantly expanded before the iron core collapsed.
Very different results are found for Model 10D and similar models where a large fraction of the silicon core burns. In these cases the silicon flash promptly ejects the entire hydrogen envelope with speeds km s-1. Equally important, the strong flash causes the core to expand to such low density that the Kelvin-Helmholtz time scale for recontracting and reigniting silicon burning becomes very long - months to years rather than days. As a result, significant mass moves to 10cm - 10cm before the iron core collapses. The collision of shells at such large radii, where the matter is almost optically thin, converts streaming kinetic energy into light with unusually high efficiency. A substantial fraction of the entire explosion energy, erg, comes out as light. Also because of the long delay, there is time for two supernova-like displays from a single star’s death.
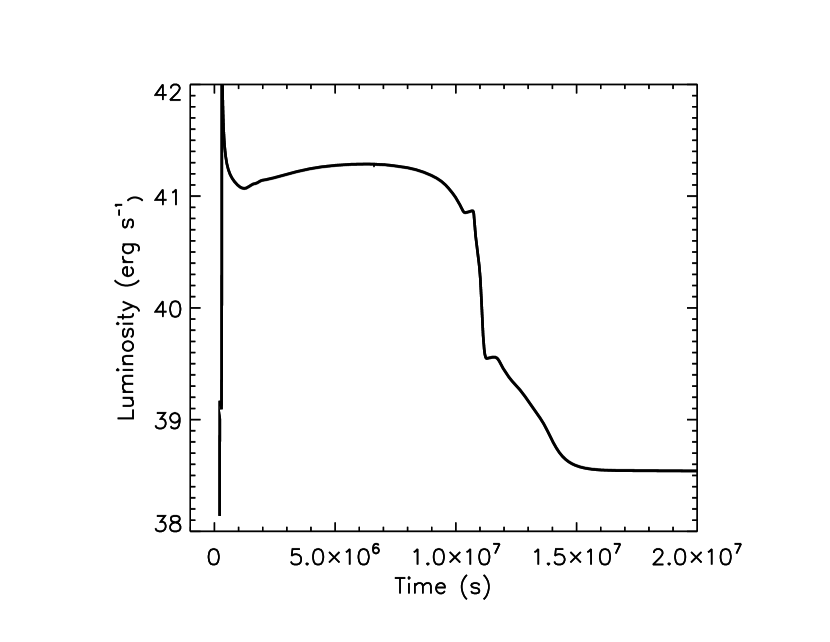
The first is a relatively faint explosion, erg s-1 (Fig. 12) as the silicon flash expels the red giant envelope. The total kinetic energy associated with event 1 in the figure is only erg (see also Fig. 10). This event has faded away about months (s) before the onset of the second much brighter supernova. Had the silicon flash energy been less, a single supernova with unusual time structure - like the superposition of the two figures - would have resulted. Similar low energy Type II supernovae have been considered by Lovegrove & Woosley (2013), albeit with a different central energy source.
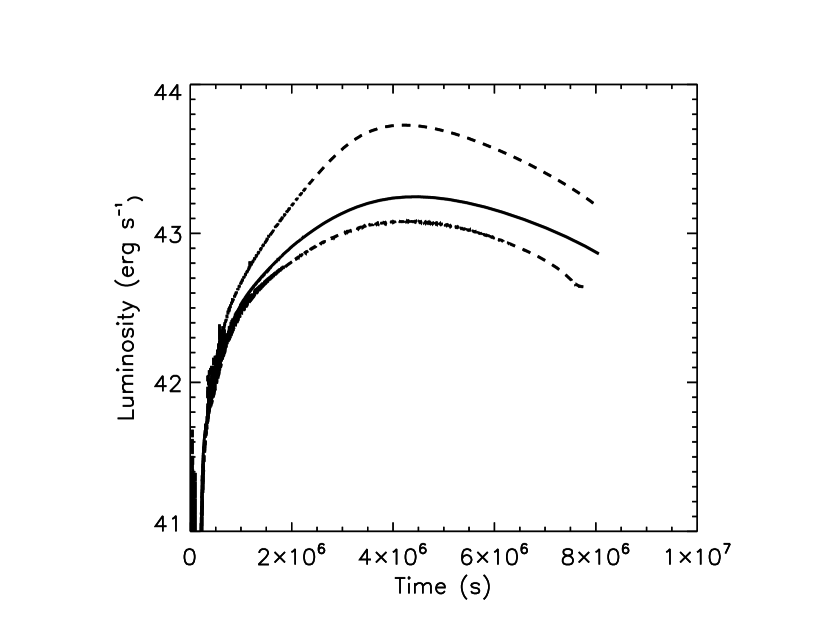
The second supernova is very bright. If the envelope has moved an optimal distance, cm, before being overtaken by the shock generated by core collapse, kinetic energy can be converted into light with high efficiency. Interestingly, the energy from the silicon flash in many models in Table 3 gives the right value to make bright displays from the low energy explosion of stars of only moderate mass. Once the shells have been launched and collide, the outcome resembles what has been proposed for pulsational-pair instability supernovae at much higher mass (Woosley & Heger, 2007) and poses some of the same computational challenges. In particular, when calculated in 1D, the colliding shells produce a very dense, geometrically thin shell in which most of the mass resides (Fig. 13). This shell poses computational difficulty because many Lagrangian shells have essentially the same radius and is also unphysical. In reality, the collision will produce mixing that must be studied in at least two dimensions (Chen et al., 2014). Qualitatively, the bolometric light curves shown in Fig. 12 will probably not change appreciably (up to the point where they could be calculated), but the composition will be mixed and the spectrum altered.
7.2. Nucleosynthesis
Stars in this mass range are not prolific sources of common elements (Hillebrandt et al., 1984; Mayle & Wilson, 1988). The steep density gradient around the collapsing core implies a low shock temperature in all but the matter very nearby, so explosive nucleosynthesis is minimal. The compact structure of the presupernova core also implies thin carbon and oxygen shells, so pre-explosive nucleosynthesis is small as well. Indeed, the chief nucleosynthetic contribution of stars in this mass range may be part of the s-process, for those stars that develop a thin helium shell and pass through an asymptotic giant branch phase ( here), or the r-process from the neutrino powered wind when the neutron star is born.
The synthesis of intermediate mass elements and iron is nevertheless interesting for predicting the sorts of abundances that might be found in the remnants of supernovae in this mass range, and for the effect of 56Ni on the light curve. The nucleosynthesis for the two representative cases in which explosions were simulated, Models 10B and 10D, is summarized in Table 4. The synthesis of 56Ni is quite sensitive to the location of the piston used to drive the explosion and will remain uncertain until a real (i.e., multi-dimensional) explosion model can be computed. For Model 10B, two locations for the piston were explored. One, at , is the traditional location used in many other studies, the base of the oxygen shell where the entropy experiences an abrupt rise above . Given the sharp density decline there, very little 56Ni is made. The other location, , at the edge of the neutronized iron, was the deepest location likely to be ejected in any model. This is in part because calculations of neutrino-transport models show that the iron core is generally a lower bound to the mass incorporated into the bound baryonic remnant, but also because ejection of even a few hundredths of a solar mass of such neutron-rich matter would greatly overproduce rare nuclei in the iron group.
In any case, the ejection of more iron-group matter would not have increased the 56Ni yield. Model 10D had a piston situated at the point, but the density decline there was not so steep since the weaker silicon flash had not ejected so much matter and there had been less time to cool and contract. In summary, it seems that 56Ni production will likely be in the range to . The production of of 56Ni in explosions is consistent with previous studies (Kitaura et al., 2006; Wanajo et al., 2009), and pending further multi-dimensional modeling (e.g. Melson et al., 2015) and studies of the nucleosynthesis in the neutrino-powered wind, we believe it to be a good factor of two estimate. Lighter elements are less sensitive to the simulation of the explosion and therefore are more accurately determined.
8. CONCLUSIONS
The presupernova evolution of stars in the to range has been explored with emphasis upon stars from 9.0 to . These are stars that ignite oxygen off center. An important component of these studies is the use of a large network, including the necessary weak interactions for altering the electron mole number, , during all stages of the post-helium burning evolution (Jones et al., 2013). Particularly important is the neutronization that goes on during oxygen shell burning and decreases the effective Chandrasekhar mass of the core, making it prone to collapse in the absence of strong burning shells. Also important and novel is our treatment of the propagation of the oxygen and silicon burning CBFs, especially using a subgrid model to describe the oxygen CBF propagation.
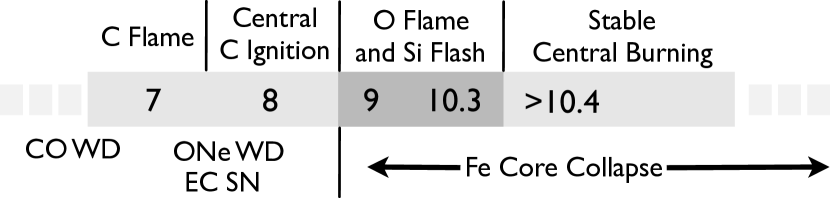
We find that evolution in this mass range can be categorized by five possible outcomes (Fig. 14). In order of increasing mass these are: 1) carbon-oxygen white dwarfs (§ 3.1; below 7.0 ); 2) neon-oxygen white dwarfs or electron-capture supernovae (depending upon uncertain mass loss rates; § 3.2; 7.0 - 9.0 ); 3) stars that ignite degenerate silicon burning off-center in a strong flash, but which remain hydrodynamically stable until iron-core collapse (§ 5.1; 9.1, 9.2, and 9.4 - 9.7 ); 4) stars for which the silicon flash is so violent as to lead to a localized deflagration and possible envelope ejection (§ 6; 9.0, 9.3, and 9.8 - 10.3 ); and 5) ordinary core-collapse supernovae (stars over 10.3 ). Examples of each category are given in Table 1. Compared with earlier similar studies, our mass limits may be approximately lower than traditional values, e.g., supernovae are often assumed to start at , not . While we do not place great faith in the exact values of these masses, the existence of the various classes of events should be robust for the one-dimensional stellar physics employed.
We find, as have others, that those stars in this mass range that do eventually produce neutron stars have compact structures. that should be easy to explode using neutrinos, possibly too easy. Without strong magnetic fields and rotation, which we argue are negligible here, and without the ram pressure of an accreting mantle, the resulting explosion will probably be much weaker than the customary erg inferred observationally for common supernovae (e.g., Kasen & Woosley, 2009) and possibly more symmetric.
Though certainly not the last word, our treatment of CBFs in oxygen and silicon burning is novel (§ 4.1). Despite including the relevant physics, including a large network and associated neutrino losses, we do not find that thermohaline mixing or URCA shells pay a major role in either stage. Flame propagation and Rayleigh-Taylor instability, to the extent that either can be modeled in a 1D calculation, dominate. The advancement of the burning is also driven by macroscopic considerations (§ 4.2), the need to provide fuel to maintain the entropy of a core whose mass already exceeds the cold Chandrasekhar limit. Since the burning can only be sustained by the inward propagation of a flame, the CBF cannot go out, but must proceed, by whatever processes, at a rate at least sufficient to balance neutrino losses from the core.
But we have also demonstrated the need for further work. The tables of Timmes et al. (1994) for CBF speeds need to be extended, for oxygen-neon compositions, to lower density, and similar tables calculated for neutron-rich silicon burning. Perhaps more importantly, portions of the oxygen- and silicon-CBF evolution need to be examined in 3D. This could be done, for example, with an adaptive mesh, low-Mach-number code like MAESTRO (Nonaka et al., 2012). Our 1D description of a CBF as a discontinuous spherical shell is almost certainly wrong. In 3D, the burning may be localized into numerous hot spots. Whether the resulting temperature structure will be able to prevent a large scale overturn of the composition inversion is a fascinating question.
A novel result of the present models (though see Woosley et al., 1980) is the possibility of silicon igniting degenerately with a violent flash. For the 9.2, 9.4, 9.5, and models, ordinary convection was (barely) capable of transporting the energy from the flash efficiently enough that no runaway on a hydrodynamical time scale occurred. For the 9.0, 9.3 and 9.8 - models, however, the flash was so powerful that ordinary convection was not able to transport the energy and a localized deflagration developed. In this regard, the silicon flash in these stars resembles a Type Ia supernova in a Chandrasekhar carbon-oxygen white dwarf with an outcome that is likely to be equally difficult to determine. A key difference is that, unlike carbon burning, silicon burning to iron-group nuclei provides inadequate energy to unbind the core. The rapid burning does, however, cause an expansion of the core on a time scale that is short compared with the hydrodynamic time of the surrounding helium shell and base of the hydrogen envelope.
The observable outcome in these cases depends upon how much silicon burns in the flash and, once again, 3D calculations will ultimately be needed to answer the question. Here the efficiency of silicon deflagration was parametrized by adjusting, artificially, a convective efficiency parameter. If the amount of silicon that burns is less than about 0.3 , the silicon flash has little observable consequence. Because of the small energy release, the core does not expand greatly and recovers rapidly. The neutrino-mediated Kelvin-Helmholtz time for the silicon-iron core is less than about two weeks. If iron core collapse launches a second more powerful shock, as seems likely, the shock from the silicon flash will be overtaken either prior to or shortly after breakout. While the breakout transient itself might be altered, the main light curve would not change greatly. Unfortunately, based upon our understanding of similar explosions in Type Ia supernovae, the amount burned in an off-center ignited thermonuclear runaway may be small if no detonation occurs (Malone et al., 2014), and this may be the case for silicon deflagration as well. If so, a rather ordinary Type IIp supernovae, will result, albeit with lower than typical velocities and brightness on the plateau (Fig. 11).
On the other hand, if the amount of silicon that burns substantially exceeds , there will be an appreciable delay between envelope ejection and core collapse (Table 3). Burning more silicon gives higher speed to the ejected envelope and lengthens the Kelvin-Helmholtz time for the recontracting core. Maximum ejection speeds for the envelope range from several hundred to several thousand km s-1. For the more energetic explosions, those that burned of silicon and more, the waiting time between envelope ejection and final core collapse was months to years giving rise to the possibility of two supernova-like events from the same star. The first event is far fainter than the second, and fainter than typical Type IIp supernovae.
This behavior is intriguing given the historical record for the Crab Supernova, SN 1054. Because of the low mass of the ejecta, the small abundances of heavy elements, and the presence of a pulsar, this supernova has often been associated with the death of a star that, on the main sequence, had a mass (Nomoto et al., 1982; Wanajo et al., 2009). Yet the historical record, such as it is, suggests that the Crab was not unusually faint (Smith, 2013). We agree with Smith that the Crab may have been brightened by a substantial contribution from “circumstellar interaction”. To appreciably alter the light curve at maximum, however, one needs a substantial fraction of a solar mass of material at 10cm. The models we calculated here for stars in the - range are capable of doing that provided that the silicon flash is sufficiently violent to burn roughly half the core.
A new calculation (§ 7.1) of 10 evolution that includes rotation and the effects of magnetic torques predicts a rotation rate for the newly minted Crab pulsar of about 17 ms, which compares quite favorably with the observationally inferred value at birth, about 21 ms. The same calculation predicts a gravitational mass from the Crab pulsar of from 1.2 to .
Even if the silicon flash proves inadequate to eject the envelope sufficiently in advance of core collapse, there is still the possibility of substantial mass ejection by energy transported acoustically from the vastly super-Eddington convective shells during the last few years of the evolution (§ 5.2; Quataert & Shiode, 2012; Shiode & Quataert, 2014). Unlike supernovae in more massive stars where the length of oxygen burning is a few months or less (Woosley et al., 2002), oxygen shell burning igniting off-center and moving inwards by a convectively bounded flame typically takes years to reach the center. Even a small fraction of the integrated convective luminosity during the last ten years would be sufficient to eject the entire envelope. The interaction of the supernova shock with a dense wind could also appreciably brighten the event (Moriya et al., 2014).
References
- Barkat et al. (1974) Barkat, Z., Reiss, Y., & Rakavy, G. 1974, ApJ, 193, L21
- Baron & Cooperstein (1990) Baron, E., & Cooperstein, J. 1990, ApJ, 353, 597
- Braun (1997) Braun, H. 1997, PhD Thesis, Ludwig-Maximilians University, Munich.
- Bressan et al. (1993) Bressan, A., Fagotto, F., Bertelli, G., & Chiosi, C. 1993, A&AS, 100, 647
- Burrows et al. (2007) Burrows, A., Dessart, L., & Livne, E. 2007, Supernova 1987A: 20 Years After: Supernovae and Gamma-Ray Bursters, AIP Proceedings Series V, 937, 370
- Cantiello & Langer (2010) Cantiello, M., & Langer, N. 2010, A&A, 521, AA9
- Chen et al. (2014) Chen, K.-J., Woosley, S., Heger, A., Almgren, A., & Whalen, D. J. 2014, ApJ, 792, 28
- Dessart et al. (2006) Dessart, L., Burrows, A., Ott, C. D., Livne, E., Yoon, S. Y. & Langer, N., 2006, ApJ, 644, 1063
- Dessart et al. (2007) Dessart, L., Burrows, A., Livne, E., & Ott, C. D., 2007, ApJ, 669, 585,
- Doherty et al. (2014) Doherty, C. L., Gil-Pons, P., Siess, L., Lattanzio, J. C., & Lau, H. B. 2014, MNRAS, submitted.
- Dominguez et al. (1993) Dominguez, I., Tornambe, A., & Isern, J. 1993, ApJ, 419, 268
- Eldridge & Tout (2004) Eldridge, J. J., & Tout, C. A. 2004, MNRAS, 353, 87
- Fryer et al. (1999) Fryer, C., Benz, W., Herant, M., & Colgate, S. A. 1999, ApJ, 516, 892
- Fuller et al. (1980) Fuller, G. M., Fowler, W. A., & Newman, M. J. 1980, ApJS, 42, 447
- Fuller et al. (1982a) Fuller, G. M., Fowler, W. A., & Newman, M. J. 1982, ApJS, 48, 279
- Fuller et al. (1982b) Fuller, G. M., Fowler, W. A., & Newman, M. J. 1982, ApJ, 252, 715
- Fuller et al. (1985) Fuller, G. M., Fowler, W. A., & Newman, M. J. 1985, ApJ, 293, 1
- Garcia-Berro et al. (1997) Garcia-Berro, E., Ritossa, C., & Iben, I., Jr. 1997, ApJ, 485, 765
- Gutierrez et al. (1996) Gutierrez, J., Garcia-Berro, E., Iben, I., Jr., et al. 1996, ApJ, 459, 701
- Hashimoto et al. (1993) Hashimoto, M., Iwamoto, K., & Nomoto, K. 1993, ApJ, 414, L105
- Heger et al. (2001) Heger, A., Woosley, S. E., Martínez-Pinedo, G., & Langanke, K. 2001, ApJ, 560, 307
- Heger et al. (2005) Heger, A., Woosley, S. E., & Spruit, H. C. 2005, ApJ, 626, 350
- Hillebrandt et al. (1984) Hillebrandt, W., Nomoto, K., & Wolff, R. G. 1984, A&A, 133, 175
- Ibeling & Heger (2013) Ibeling, D., & Heger, A. 2013, ApJ, 765, 43
- Iben & Renzini (1983) Iben, I., Jr., & Renzini, A. 1983, ARA&A, 21, 271
- Iben et al. (1997) Iben, I., Jr., Ritossa, C., & Garcia-Berro, E. 1997, ApJ, 489, 772
- Jones et al. (2013) Jones, S., Hirschi, R., Nomoto, K., et al. 2013, ApJ, 772, 150
- Jones et al. (2014) Jones, S., Hirschi, R., & Nomoto, K. 2014, ApJ, 797, 83
- Kaplan et al. (2008) Kaplan, D. L., Chatterjee, S., Gaensler, B. M., & Anderson, J. 2008, ApJ, 677, 1201
- Kasen & Woosley (2009) Kasen, D., & Woosley, S. E. 2009, ApJ, 703, 2205
- Kippenhahn et al. (1980) Kippenhahn, R., Ruschenplatt, G., & Thomas, H.-C. 1980, A&A, 91, 175
- Kitaura et al. (2006) Kitaura, F. S., Janka, H.-T., & Hillebrandt, W. 2006, A&A, 450, 345
- Landau & Lifshitz (1959) Landau, L., & Lifshitz, F. M. 1959, Course in Theoretical Physics, Vol. 6. Fluid Mechanics (Oxford:Pergammon)
- Langanke & Martinez-Pinedo (2000) Langanke, K., & Martinez-Pinedo, G. 2000, Nuclear Physics A, 673, 481
- Lattimer & Yahil (1989) Lattimer, J. M., & Yahil, A. 1989, ApJ, 340, 426
- Lattimer & Prakash (2001) Lattimer, J. M., & Prakash, M. 2001, ApJ, 550, 426
- Lodders (2003) Lodders, K. 2003, ApJ, 591, 1220
- Lovegrove & Woosley (2013) Lovegrove, E., & Woosley, S. E. 2013, ApJ, 769, 109
- Malone et al. (2014) Malone, C. M., Nonaka, A., Woosley, S. E., et al. 2014, ApJ, 782, 11
- Mayle & Wilson (1988) Mayle, R., & Wilson, J. R. 1988, ApJ, 334, 909
- Melson et al. (2015) Melson, T., Janka, H.-T., & Marek, A. 2015, ApJ, 801, LL24
- Miyaji et al. (1980) Miyaji, S., Nomoto, K., Yokoi, K., & Sugimoto, D. 1980, PASJ, 32, 303
- Miyaji & Nomoto (1987) Miyaji, S., & Nomoto, K. 1987, ApJ, 318, 307
- Moriya et al. (2014) Moriya, T. J., Tominaga, N., Langer, N., et al. 2014, A&A, 569, AA57
- Muslimov & Page (1996) Muslimov, A., & Page, D. 1996, ApJ, 458, 347
- Niemeyer & Woosley (1997) Niemeyer, J. C., & Woosley, S. E. 1997, ApJ, 475, 740
- Nomoto et al. (1982) Nomoto, K., Sugimoto, D., Sparks, W. M., et al. 1982, Nature, 299, 803
- Nomoto (1984) Nomoto, K. 1984, ApJ, 277, 791
- Nomoto (1987) Nomoto, K. 1987, ApJ, 322, 206
- Nonaka et al. (2012) Nonaka, A., Aspden, A. J., Zingale, M., et al. 2012, ApJ, 745, 73
- Oda et al. (1994) Oda, T., Hino, M., Muto, K., Takahara, M., & Sato, K. 1994, Atomic Data and Nuclear Data Tables, 56, 231
- Poelarends et al. (2008) Poelarends, A. J. T., Herwig, F., Langer, N., & Heger, A. 2008, ApJ, 675, 614
- Qian & Woosley (1996) Qian, Y.-Z., & Woosley, S. E. 1996, ApJ, 471, 331
- Quataert & Shiode (2012) Quataert, E., & Shiode, J. 2012, MNRAS, 423, L92
- Rauscher et al. (2002) Rauscher, T., Heger, A., Hoffman, R. D., & Woosley, S. E. 2002, ApJ, 576, 323
- Ritossa et al. (1999) Ritossa, C., Garcia-Berro, E., & Iben, I., Jr. 1999, ApJ, 515, 381
- Shiode & Quataert (2014) Shiode, J. H., & Quataert, E. 2014, ApJ, 780, 96
- Siess (2006) Siess, L. 2006, A&A, 448, 717
- Smith (2013) Smith, N. 2013, MNRAS, 434, 102
- Sukhbold & Woosley (2014) Sukhbold, T., & Woosley, S. E. 2014, ApJ, 783, 10
- Takahashi et al. (2013) Takahashi, K., Yoshida, T., & Umeda, H. 2013, ApJ, 771, 28
- Tauris et al. (2013) Tauris, T. M., Sanyal, D., Yoon, S.-C., & Langer, N. 2013, A&A, 558, AA39
- Timmes & Woosley (1992) Timmes, F. X., & Woosley, S. E. 1992, ApJ, 396, 649
- Timmes et al. (1994) Timmes, F. X., Woosley, S. E., & Taam, R. E. 1994, ApJ, 420, 348
- Wanajo et al. (2009) Wanajo, S., Nomoto, K., Janka, H.-T., Kitaura, F. S., Müller, B. 2009, ApJ, 695, 208
- Weaver, Zimmerman, & Woosley (1978) Weaver, T. A., Zimmerman, G. B., & Woosley 1978, ApJ, 225, 1021
- Wongwathanarat et al. (2013) Wongwathanarat, A., Janka, H.-T., Müller, E. 2013, A&A, 552, A126
- Woosley et al. (1980) Woosley, S. E., Weaver, T. A., & Taam, R. E. 1980, Texas Workshop on Type I Supernovae, 96
- Woosley & Weaver (1986) Woosley, S. E., & Weaver, T. A. 1986, ARA&A, 24, 205
- Woosley & Baron (1992) Woosley, S. E., & Baron, E. 1992, ApJ, 391, 228
- Woosley et al. (2002) Woosley, S. E., Heger, A., & Weaver, T. A. 2002, Reviews of Modern Physics, 74, 1015
- Woosley et al. (2004) Woosley, S. E., Heger, A., Cumming, A., et al. 2004, ApJS, 151, 75
- Woosley et al. (2004) Woosley, S. E., Wunsch, S., & Kuhlen, M. 2004, ApJ, 607, 921
- Woosley & Heger (2007) Woosley, S. E., & Heger, A. 2007, Phys. Rep., 442, 269
- Zingale et al. (2013) Zingale, M., Nonaka, A., Almgren, A. S., et al. 2013, ApJ, 764, 97
| Initial | Final | Helium | CO | Si | Fe | BE | BE | Outcome |
|---|---|---|---|---|---|---|---|---|
| Mass | Mass | Core Mass | Core Mass | Core Mass | Core Mass | Envel | O-shell | |
| () | () | () | () | () | () | (erg) | (erg) | |
| 6.5 | 6.38 | 0.960 | 0.960 | - | - | 2.0b | - | CO WD |
| 7.0 | 6.79 | 1.033 | 1.033 | - | - | 2.1b | - | OC WD |
| 7.5 | 6.96 | 1.088 | 1.088 | - | - | 1.8b | - | ONe WD/EC SN |
| 8.0 | 7.76 | 1.171 | 1.171 | - | - | 1.2b | - | “ |
| 8.5 | 8.28 | 1.271 | 1.271 | - | - | 2.3b | - | “ |
| 8.75 | 8.51 | 1.345 | 1.345 | - | - | 1.1b | - | “ |
| 9.0Ac | 8.75 | 1.567 | 1.400 | 1.320 | 1.237 | - | 5.8 | Si-Defl. SN |
| 9.0Ec | 8.75 | 1.567 | 1.400 | 1.320 | 1.268 | - | - | Si-Defl. SN |
| 9.1 | 8.83 | 1.640 | 1.418 | 1.334 | 1.244 | 1.8 | 4.8 | Si-Flash SN |
| 9.2 | 8.93 | 1.759 | 1.441 | 1.365 | 1.244 | 2.0 | 3.4 | Si-Flash SN |
| 9.3Ac | 9.02 | 1.856 | 1.457 | 1.346 | 1.280 | - | 8.0 | Si-Defl. SN |
| 9.3Ec | 9.02 | 1.856 | 1.438 | 1.363 | 1.261 | - | - | Si-Defl. SN |
| 9.4 | 9.11 | 1.975 | 1.477 | 1.397 | 1.331 | 2.2 | 4.1 | Si-Flash SN |
| 9.5 | 9.21 | 2.054 | 1.493 | 1.356 | 1.332 | 2.2 | 6.8 | Si-Flash SN |
| 9.6 | 9.30 | 2.094 | 1.528 | 1.400 | 1.302 | 2.1 | 7.0 | “ |
| 9.7 | 9.39 | 2.183 | 1.546 | 1.412 | 1.305 | 2.2 | 7.4 | “ |
| 9.8Ac | 9.48 | 2.281 | 1.564 | 1.409 | 1.316 | 0.3 | 9.4 | Si Defl. SN |
| 9.8Ec | 9.48 | 2.281 | 1.564 | 1.269 | 1.215 | - | 9.0 | “ |
| 9.9Ac | 9.58 | 2.356 | 1.588 | 1.415 | 1.349 | 1.0 | 10 | “ |
| 9.9Ec | 9.58 | 2.356 | 1.597 | 1.302 | 1.231 | - | - | “ |
| 10.0Ac | 9.69 | 2.448 | 1.612 | 1.430 | 1.362 | 1.5 | 11 | “ |
| 10.0Ec | 9.69 | 2.448 | 1.626 | 1.311 | 1.232 | - | - | “ |
| 10.1Cc | 9.79 | 2.484 | 1.634 | 1.427 | 1.354 | - | 9.9 | “ |
| 10.1Ec | 9.79 | 2.484 | 1.657 | 1.336 | 1.256 | - | - | “ |
| 10.2Cc | 9.89 | 2.545 | 1.655 | 1.427 | 1.363 | - | 10 | “ |
| 10.2Ec | 9.89 | 2.545 | 1.638 | 1.370 | 1.296 | - | - | “ |
| 10.3Dc | 10.00 | 2.591 | 1.670 | 1.438 | 1.336 | - | 8.3 | “ |
| 10.3Ec | 10.00 | 2.591 | 1.645 | 1.363 | 1.260 | - | - | “ |
| 10.4 | 10.09 | 2.634 | 1.684 | 1.477 | 1.353 | 2.0 | 9.9 | Ordinary SN |
| 10.5 | 10.19 | 2.666 | 1.709 | 1.477 | 1.355 | 2.0 | 11 | “ |
| 10.75 | 10.45 | 2.736 | 1.736 | 1.523 | 1.318 | 2.5 | 7.5 | “ |
| 11 | 10.68 | 2.797 | 1.780 | 1.545 | 1.411 | 2.8 | 7.3 | “ |
| 11.25 | 10.90 | 2.835 | 1.802 | 1.552 | 1.346 | 2.8 | 8.1 | “ |
| 11.5 | 10.81 | 2.740 | 1.757 | 1.487 | 1.375 | 2.7 | 12.5 | “ |
| 12.0 | 10.93 | 3.103 | 1.997 | 1.636 | 1.290 | 3.7 | 12.2 | “ |
| 12.25 | 11.08 | 3.198 | 2.071 | 1.546 | 1.445 | 4.6 | 23.1 | “ |
| 12.5 | 11.23 | 3.304 | 2.145 | 1.567 | 1.464 | 4.8 | 24.0 | “ |
| 12.75 | 11.39 | 3.400 | 2.216 | 1.582 | 1.472 | 5.7 | 25.5 | “ |
| 13.0 | 11.59 | 3.486 | 2.282 | 1.602 | 1.489 | 6.3 | 27.3 | “ |
| 13.25 | 11.68 | 3.607 | 2.377 | 1.644 | 1.512 | 7.3 | 29.7 | “ |
| 13.5 | 11.93 | 3.675 | 2.434 | 1.658 | 1.518 | 7.9 | 30.9 | “ |
| Initial | Silicon | Ignition | |||||
|---|---|---|---|---|---|---|---|
| Mass | Core Massa | Mass | Density | Temperature | Luminosityb | Radiusa | |
| () | () | () | (g cm-3) | (K) | (erg s-1) | (cm) | |
| 9.0 | 1.308 | 0.408 | 4.94(8) | 3.21(9) | 9.43 | 1.04 | 2.83 |
| 9.1 | 1.334 | 0.358 | 4.94(8) | 3.25(9) | 9.30 | 1.02 | 2.78 |
| 9.2 | 1.365 | 0.314 | 4.58(8) | 3.21(9) | 9.16 | 1.00 | 2.75 |
| 9.3 | 1.343 | 0.330 | 4.60(8) | 3.20(9) | 9.21 | 1.01 | 2.73 |
| 9.4 | 1.387 | 0.275 | 4.15(8) | 3.15(9) | 8.96 | 1.04 | 2.77 |
| 9.5 | 1.332 | 0.237 | 4.67(8) | 3.19(9) | 9.31 | 1.08 | 2.83 |
| 9.6 | 1.399 | 0.2002 | 4.87(8) | 3.20(9) | 9.39 | 1.12 | 2.96 |
| 9.7 | 1.412 | 0.1527 | 4.84(8) | 3.20(9) | 9.39 | 1.15 | 3.02 |
| 9.8 | 1.409 | 0.0582 | 5.22(8) | 3.20(9) | 9.67 | 1.20 | 3.05 |
| 9.9 | 1.415 | 0.0364 | 5.17(8) | 3.20(9) | 9.64 | 1.26 | 3.11 |
| 10.0 | 1.427 | 0.0203 | 4.97(8) | 3.23(9) | 9.40 | 1.35 | 3.28 |
| 10.1 | 1.427 | 0.0164 | 4.62(8) | 3.16(9) | 9.35 | 1.39 | 3.34 |
| 10.2 | 1.432 | 0.0020 | 4.53(8) | 3.16(9) | 9.28 | 1.45 | 3.42 |
| 10.3 | 1.438 | 0 | 4.55(8) | 3.12(9) | 9.33 | 1.51 | 3.50 |
| 10.4 | 1.441 | 0 | 4.03(8) | 3.04(9) | 9.22 | 1.59 | 3.71 |
| 10.5 | 1.370 | 0 | 1.90(8) | 3.10(9) | 8.87 | 1.63 | 3.68 |
| 10.75 | 1.421 | 0 | 3.34(8) | 3.10(9) | 8.34 | 1.73 | 3.78 |
| 11.0 | 1.411 | 0 | 3.14(8) | 3.10(9) | 8.11 | 1.80 | 3.87 |
| 11.25 | 1.404 | 0 | 3.08(8) | 3.10(9) | 8.06 | 1.85 | 3.91 |
| 11.5 | 1.401 | 0 | 3.50(8) | 3.10(9) | 8.49 | 1.70 | 3.72 |
| 11.75 | 1.409 | 0 | 2.92(8) | 3.10(9) | 7.86 | 2.03 | 4.17 |
| 12.0 | 1.451 | 0 | 2.36(8) | 3.10(9) | 7.20 | 2.16 | 4.32 |
| 12.25 | 1.550 | 0 | 2.47(8) | 3.10(9) | 7.32 | 2.28 | 4.48 |
| 12.5 | 1.565 | 0 | 2.26(8) | 3.10(9) | 7.07 | 2.36 | 4.58 |
| 12.75 | 1.580 | 0 | 2.24(8) | 3.10(9) | 7.05 | 2.49 | 4.71 |
| 13.0 | 1.600 | 0 | 2.07(8) | 3.10(9) | 6.81 | 2.58 | 4.73 |
| 13.25 | 1.642 | 0 | 1.86(8) | 3.10(9) | 6.50 | 2.71 | 4.88 |
| 13.5 | 1.656 | 0 | 1.74(8) | 3.10(9) | 6.32 | 2.80 | 4.94 |
| Initial | Fe | Conv. | Delay | Photo. | Edge | Velocity | Lum. |
|---|---|---|---|---|---|---|---|
| Mass | Massa | param | Time | Radius | PreSN | Edge | PreSN |
| () | () | (sec) | (cm) | (cm) | (erg s-1) | ||
| 9.0A | 0.28 | 1.(-4) | 8.5(5) | 2.8(13) | 2.8(13) | 0 | 1.0(38) |
| 9.0E | 0.56 | 0.01 | 1.14(7) | 3.3(14) | 2.3(15) | 3.6(8) | 7.2(40) |
| 9.3A | 0.33 | 1.(-4) | 8.7(5) | 2.7(13) | 2.7(13) | 0 | 1.0(38) |
| 9.3E | 0.59 | 0.01 | 8.9(6) | 3.6(14) | 2.1(15) | 3.1(8) | 7.4(40) |
| 9.8A | 0.21 | 1.(-4) | 1.33(6) | 3.0(13) | 3.1(13) | 0 | 1.2(38) |
| 9.8B | 0.29 | 3.(-4) | 1.39(6) | 3.8(13) | 3.8(13) | 4.1(7) | 1.9(39) |
| 9.8C | 0.63 | 6.(-4) | 1.09(7) | 3.2(14) | 1.8(15) | 1.8(8) | 8.4(40) |
| 9.8D | 0.76 | 0.001 | 4.66(7) | 1.1(13) | 9.5(15) | 2.1(8) | 7.1(39) |
| 9.8E | 0.77 | 0.01 | 5.97(7) | 1.1(11) | 1.9(16) | 3.6(8) | 4.9(39) |
| 9.9A | 0.22 | 1.(-4) | 1.34(6) | 3.1(13) | 3.1(13) | 0 | 1.3(38) |
| 9.9B | 0.28 | 3.e-4) | 1.39(6) | 3.5(13) | 2.5(13) | 4.3(7) | 4.2(39) |
| 9.9C | 0.36 | 6.(-4) | 2.25(6) | 1.2(14) | 1.5(14) | 7.9(7) | 1.3(40) |
| 9.9D | 0.76 | .001 | 4.08(7) | 3.9(13) | 9.0(15) | 2.2(8) | 7.0(40) |
| 9.9E | 0.78 | 0.01 | 5.22(7) | 3.8(13) | 1.3(16) | 3.3(8) | 1.3(40) |
| 10.0A | 0.18 | 1.(-4) | 1.33(6) | 3.3(13) | 3.3(13) | 0 | 1.4(38) |
| 10.0B | 0.25 | 3.(-4) | 1.38(6) | 3.3(13) | 3.3(13) | 0 | 1.4(38) |
| 10.0C | 0.34 | 6.(-4) | 1.95(6) | 9.3(13) | 1.1(14) | 7.7(7) | 1.0(40) |
| 10.0C+ | 0.61 | 9.e-4 | 8.87(6) | 3.6(14) | 1.5(15) | 1.9(8) | 1.3(41) |
| 10.0D | 0.76 | 0.001 | 3.46(7) | 3.7(13) | 8.3(15) | 2.5(8) | 2.7(40) |
| 10.0E | 0.79 | 0.01 | 4.85(7) | 8.7(10) | 1.6(16) | 3.6(8) | 4.9(39) |
| 10.1C | 0.32 | 6.(-4) | 1.72(6) | 6.8(13) | 7.3(13) | 6.0(7) | 6.3(39) |
| 10.1D | 0.39 | 0.001 | 2.60(6) | 1.5(14) | 2.1(14) | 9.5(7) | 2.1(40) |
| 10.1E | 0.77 | 0.01 | 3.42(7) | 5.0(13) | 8.0(15) | 2.8(8) | 1.2(40) |
| 10.2C | 0.30 | 6.(-4) | 1.48(6) | 4.5(13) | 4.5(13) | 5.2(7) | 5.0(39) |
| 10.2D | 0.71 | 0.001 | 1.48(7) | 2.1(13) | 3.4(15) | 2.6(8) | 1.3(39) |
| 10.2E | 0.73 | 0.01 | 1.90(7) | 4.2(13) | 4.7(15) | 2.8(8) | 5.8(39) |
| 10.3D | 0.36 | 0.001 | 2.23(6) | 1.2(14) | 1.4(14) | 8.0(7) | 1.4(40) |
| 10.3E | 0.74 | 0.01 | 2.13(7) | 3.4(13) | 5.0(15) | 2.6(8) | 3.6(39) |
| Model | Piston | Energy | O | Mg | Si | S | Ar | Ca | 56Ni |
|---|---|---|---|---|---|---|---|---|---|
| Location | (erg) | () | () | () | () | () | () | () | |
| 10.0B | 1.301 | 2.0 | 0.161 | 0.010 | 0.048 | 0.034 | 0.0065 | 0.0015 | 0.0060 |
| 10.0B | 1.245 | 1.8 | 0.161 | 0.010 | 0.053 | 0.038 | 0.0073 | 0.0016 | 0.045 |
| 10.0D | 1.440 | 2.2 | 0.099 | 0.0060 | 0.011 | 0.0042 | 0.0008 | 0.0007 | 0.022 |