Effects of hot halo gas on the star formation and mass transfer during distant galaxygalaxy encounters
Abstract
We use -body/smoothed particle hydrodynamics simulations of encounters between an early-type galaxy (ETG) and a late-type galaxy (LTG) to study the effects of hot halo gas on the evolution for a case with the mass ratio of the ETG to LTG of 2:1 and the closest approach distance of 100 kpc. We find that the dynamics of the cold disk gas in the tidal bridge and the amount of the newly formed stars depend strongly on the existence of a gas halo. In the run of interacting galaxies not having a hot gas halo, the gas and stars accreted into the ETG do not include newly formed stars. However, in the run using the ETG with a gas halo and the LTG without a gas halo, a shock forms along the disk gas tidal bridge and induces star formation near the closest approach. The shock front is parallel to a channel along which the cold gas flows toward the center of the ETG. As a result, the ETG can accrete star-forming cold gas and newly born stars at and near its center. When both galaxies have hot gas halos, a shock is formed between the two gas halos somewhat before the closest approach. The shock hinders the growth of the cold gas bridge to the ETG and also ionizes it. Only some of the disk stars transfer through the stellar bridge. We conclude that the hot halo gas can give significant hydrodynamic effects during distant encounters.
Subject headings:
hydrodynamics — methods: numerical — galaxies: evolution — galaxies: halos — galaxies: interactions — galaxies: star formation1. INTRODUCTION
Interacting galaxy pairs have been actively studied both observationally and numerically over the past few decades (Toomre & Toomre 1972; Barnes & Hernquist 1992; Struck 2006; Smith et al. 2007; among many others). While the effects of galaxy mergers have been more intensely studied (e.g., Springel et al. 2005; Cox 2008; Genel et al. 2008; Naab et al. 2009), the interest in a whole variety of interactions, including flybys and distant encounters (before or without mergers), is growing only recently (e.g., Park et al. 2008; Hwang & Park 2009; Park & Choi 2009; Park & Hwang 2009; Sinha & Holley-Bockelmann 2012; L’Huillier et al. 2015). For example, Park et al. (2008) presented a unified picture on the evolution of galaxy morphology and luminosity through distant interactions and mergers by analyzing the Sloan Digital Sky Survey (SDSS; York et al. 2000) samples. In particular, they found the strong dependence of galaxy morphology on the local environment set up by the nearest neighbor galaxy. It was claimed that hydrodynamic effects of cold gas as well as hot diffuse halo gas play an important role in the evolution of galaxy color and star formation activity. It was also shown that galaxygalaxy encounters are very important in a cluster environment in star formation quenching through hydrodynamic interactions of late-type galaxies (LTGs) with cluster early-type galaxies (ETGs) (Park & Hwang 2009).
So far, however, the overall effects of hot halo gas on galaxy evolution during various interactions have not been well understood. They can be tackled with the use of hydrodynamical models that include both cold and hot gas. Recently, Moster et al. (2011) studied the role of hot gas in major mergers of disk galaxies, including for the first time a gradually cooling hot gas halo in the galactic-scale simulations. They showed that the hot gas component affects the star formation rates (SFRs), the efficiency of the starburst, and the kinematics and internal structure of the merger remnants. In a subsequent study (Moster et al. 2012), they also examined the effects of hot gas on disk thickening in minor mergers. They found that a cooling hot halo acts to reduce thickening by re-forming a massive thin disk in the post-merger. These studies have addressed that the results of interactions can be significantly affected by a hot gas halo component.
In order to further investigate the effects of hot halo gas in a wide range of interactions, we have been performing a series of -body/hydrodynamic simulations, including a cooling diffuse hot gas halo in our galaxy models. We presented the results of the first set of simulations in Hwang et al. (2013) (hereafter Paper I). In that work, we tested different density profiles for the gas halo with varying mass and initial spin in our Milky Way Galaxylike models and examined how the adopted gas halos create differences in the evolution of the isolated galaxies, particularly in the gas dissipation and the star formation activity in the disk.
In the current work, we perform a set of simulations of interactions between an ETG and an LTG. This work is motivated by the observational study by Park et al. (2008), where some interesting examples of ETGs having a late-type neighbor were presented, such as a blue elliptical-looking galaxy with strong star formation at its center, and a red galaxy having spiral-looking arms (see Figure 4 of their paper). In this work we aim to provide a set of simulated interacting galaxy systems that can be compared with observations in the follow-up studies. Our study focuses on, for the first time, the effects of hot halo gas during distant encounters on the changes of galactic properties. Specifically, we intend to investigate whether and how the presence of a hot gas halo component can cause differences in the star formation activities, the development and location of the tidal bridge, and the amount and dynamics of the material transferring through the bridge to the ETG, as in the examples mentioned above, with a fixed set of orbital parameters.
We will continue to study more cases of various interactions in different environments, emphasizing the role of hot halo gas in follow-up studies. For example, we plan to work on galaxy interactions in a rich galaxy cluster environment and investigate star formation quenching and the morphology transformation of LTGs influenced by the hot halo gas of neighboring ETGs, as well as the hot cluster gas.
This paper is organized as follows. We describe our initial galaxy models and the model parameters in Section 2, and the simulation code used for this work in Section 3. In Section 4, we present our simulation results of the distant encounters, explaining the orbital parameters, the evolution, and the star formation activities. Finally, we summarize and discuss our results in Section 5.
2. INITIAL GALAXY MODELS
We use four different galaxy models for this work, among which two are LTG models L and LH, and the other two are ETG models E and EH (Table 1). We generate the models by using the ZENO software package (Barnes, 2011). ZENO allows one to construct multiple spherical and disk components of a galaxy system in mutual equilibrium with user-specified density profiles in collisionless or gaseous form.
| Model components | Model parameters | Model L | Model LH | Model E | Model EH |
|---|---|---|---|---|---|
| aa ( M⊙) | 126 | 126 | 252 | 252 | |
| (disk gas fraction)bb | 0.12 | 0.12 | |||
| (halo gas fraction)cc | 0.01 | 0.01 | |||
| Star disk: | |||||
| Disk model | Exponential | Exponential | |||
| (kpc) | Star disk scale length | 3.5 | 3.5 | ||
| (kpc) | Vertical disk scale height | 0.35 | 0.35 | ||
| (kpc) | Outer disk cutoff radius | 42 | 42 | ||
| ( M⊙) | Total star disk mass | 4.4 | 4.4 | ||
| Number of particles | 204 800 | 204 800 | |||
| ( M⊙) | Mass of individual particles | 2.15 | 2.15 | ||
| (kpc) | Gravitational softening length | 0.07 | 0.07 | ||
| Gas disk: | |||||
| Disk model | Exponential | Exponential | |||
| (kpc) | Gas disk scale length | 8.75 | 8.75 | ||
| (kpc) | Vertical disk scale height | 0.35 | 0.35 | ||
| (kpc) | Outer disk cutoff radius | 105 | 105 | ||
| ( M⊙) | Total gas disk mass | 0.6 | 0.6 | ||
| Number of particles | 81 920 | 81 920 | |||
| ( M⊙) | Mass of individual particles | 0.73 | 0.73 | ||
| (kpc) | Gravitational softening length | 0.04 | 0.04 | ||
| DM halo: | |||||
| Halo model | NFW | NFW | NFW | NFW | |
| (kpc) | DM halo scale length | 21 | 21 | 21 | 21 |
| (kpc) | Tapering radius | 84 | 84 | 84 | 84 |
| ( M⊙) | Mass within radius | 12.35 | 12.23 | 24.71 | 24.46 |
| ( M⊙) | Total DM halo mass | 120 | 118.8 | 240 | 237.6 |
| Number of particles | 1 024 000 | 1 024 000 | 2 048 000 | 2 048 000 | |
| ( M⊙) | Mass of individual particles | 11.7 | 11.6 | 11.7 | 11.6 |
| (kpc) | Gravitational softening length | 0.16 | 0.16 | 0.16 | 0.16 |
| Gas halo: | |||||
| Halo model | Isothermal | Isothermal | |||
| (kpc) | Core radius | 10.5 | 10.5 | ||
| (kpc) | Tapering radius | 420 | 420 | ||
| ( M⊙) | Total gas halo mass | 1.2 | 2.4 | ||
| Number of particles | 163 840 | 327 680 | |||
| ( M⊙) | Mass of individual particles | 0.73 | 0.73 | ||
| (kpc) | Gravitational softening length | 0.04 | 0.04 | ||
| Bulge: | |||||
| Bulge model | Hernquist | Hernquist | Hernquist | Hernquist | |
| (kpc) | Bulge scale length | 0.7 | 0.7 | 2.8 | 2.8 |
| (kpc) | Truncation radius | 140 | 140 | 280 | 280 |
| ( M⊙) | Total bulge mass | 1 | 1 | 12 | 12 |
| Number of particles | 45 056 | 45 056 | 540 672 | 540 672 | |
| (M⊙) | Mass of individual particles | 2.22 | 2.22 | 2.22 | 2.22 |
| (kpc) | Gravitational softening length | 0.07 | 0.07 | 0.07 | 0.07 |
| ETG-LTG | ETG | LTG | 1st closest approach | ||||
|---|---|---|---|---|---|---|---|
| (kpc) | (km s-1) | (kpc) | (km s-1) | (kpc) | (km s-1) | (Gyr) | |
| E-L | 0, 0, 0 | 0, 0, 0 | 1200, 265, 0 | 200, 0, 0 | 94.3 | 495.6 | 4.75 |
| EH-L | 0, 0, 0 | 0, 0, 0 | 1200, 265, 0 | 200, 0, 0 | 94.4 | 494.8 | 4.75 |
| EH-LH | 0, 0, 0 | 0, 0, 0 | 1200, 265, 0 | 200, 0, 0 | 94.8 | 495.5 | 4.75 |
2.1. Density Profiles
We first present the specific form of the density profile adopted for each component of our galaxy models (refer to Barnes & Hibbard 2009 for more details; see also Paper I).
Both star and gas disks in the LTG models follow an exponential surface density profile and a sech2 vertical profile:
| (1) |
where the subscript “” stands for either “” for the star disk component or “” for the gas disk component; represents the cylindrical radius ; is the mass of the star or gas disk; and are the radial scale length and the vertical scale height of the disk, respectively; and is chosen to be 2.5 times larger than (Table 1).
The dark matter (DM) halo in all of our models has has a NavarroFrenkWhite (NFW) profile (Navarro et al. 1996). Because the cumulative mass of the profile diverges at large radii, we apply an exponential taper at radii larger than :
| (2) |
where is the radial scale length of the DM halo, and is the mass within .
Two of our models (LH and EH) possess a nonsingular isothermal gas halo with a taper:
| (3) |
where is the radius of the inner core with a constant density, is the radius of taper, and is the mass of the gas halo. The isothermal profile is chosen because it is similar to the profile that is commonly used to fit the hot gas observed in galaxy clusters.
The mass density of the bulge in all models follows a Hernquist (1990) profile with truncation at large radii from (Table 1):
| (4) |
where is the radial scale length of the bulge; is the bulge mass. The bulge consists of stars only.
With the above density profiles, the -body realizations of our galaxy models are made by using the ZENO programs. We have run each model in isolation to check the stability before performing simulations of distant encounters. In Appendix A, we present the evolution of model LH, which possesses both a gas disk and a gas halo.
2.2. LTG Models
The total mass of each LTG model is set to (Table 1), similar to that of the Milky Way Galaxy.
Model L consists of the four components: stellar disk, gas disk, DM halo, and bulge. The mass of each component in units of is , , , and , respectively (Table 1). The total disk mass is thus . The gas fraction in the disk, defined as , is 0.12. The number of star or gas particles distributed in each component is , , , and .
Model LH has an additional component of a gaseous halo. The gas halo component has and . Because the DM halo mass is set to , the total halo mass is , equal to that of model L. The halo gas fraction is = 0.01. The gas halo is twice more massive than the gas disk in this model. The mass of a single gas particle (either in the disk or in the halo) is the same at the initial time.
Both star and gas disks in the LTG models have an exponential surface density profile and a sech2 vertical profile (Equation (1)). The radial and vertical scale lengths of the star disk are set to kpc and kpc, respectively. Those of the gas disk are set to kpc and (Moster et al. 2011). The mass distribution of the DM halo follows the NFW profile (Equation (2)). Its radial scale is kpc, which is adopted from McMillan & Dehnen (2007). For the bulge, the Hernquist profile (Equation (4)) is chosen with the length scale of kpc (McMillan & Dehnen 2007). The gas halo included in model LH follows the isothermal density profile (Equation (3)) with the core radius of kpc.
The disk gas particles in models L and LH are set to rotate in the clockwise direction with the local circular velocities without any motion in the vertical direction at the initial time. For the disk star particles in both models, velocity dispersions are added to the local circular velocities, as described in Barnes & Hibbard (2009).111 In Paper I, the dispersions were added to the disk star particles in the models of type DH, but were not applied in the models of type D.
The temperatures of the disk gas particles in both models are set to K. For the halo gas particles in model LH, the initial temperatures are determined in accordance with the hydrodynamic equilibrium of the halo gas.222The temperature distribution of the halo gas particles of model LH is statistically the same as that of model DHi in Paper I. Compared with the models in Paper I, we use a larger number of particles for this work and accordingly adopt smaller gravitational softening lengths in all components. Except for the particle numbers and the dispersions of disk stars, all of the other key model parameters, such as scale length, truncation/tapering radius, and core radius, remain unchanged.
2.3. ETG Models
The ETG models E and EH do not have a disk component. The total mass of each ETG model is set to (Table 1), twice more massive than that of the LTG models.
Model E consists of two components, a DM halo with and a bulge with (Table 1). The number of particles distributed in each component is and . The masses of a particle in the DM halo and in the bulge of model E are equal to those of model L.
Model EH has a gas halo in addition to a DM halo and a bulge. The gas halo mass is with the halo gas fraction = 0.01. The number of halo gas particles is . The mass of the DM halo is . The total (DM + gas) halo mass and the bulge mass are equal to those of model E.
In the ETG models, the DM halo and the bulge follow the NFW profile (Equation (2)) and the Hernquist profile (Equation (4)), respectively, as in the LTG models. The scale length of the DM halo () and the core radius of the gas halo () are equal to those of model LH (Table 1). The scale length of the bulge component () is set to 2.8 kpc.
3. Simulation code and the parameters
To perform simulations of interactions between the galaxy models, we use an early version of the GADGET-3 TreeSPH code (originally described in Springel 2005). Gravitational force is calculated by means of the tree algorithm (Barnes & Hut 1986), and the hydrodynamic force is computed with the smoothed particle hydrodynamics (SPH) method in the entropy conservative formulation (Springel & Hernquist, 2002). The code includes radiative cooling and heating for a primordial mixture of hydrogen and helium by photoionization (Katz et al. 1996). Star formation and supernova feedback in the interstellar medium (ISM) are implemented using the effective multiphase model of Springel & Hernquist (2003). A thermal instability operates for gas at high density over a threshold value of , and the ISM is treated as a statistical mixture of cold clouds and ambient hot medium. Star formation occurs in dense regions consuming the cold clouds. The consumption timescale is chosen to match the observations (Kennicutt, 1998). Among the newly formed stars, the mass fraction of massive stars () is given by the parameter . The massive stars die instantly as supernovae releasing energy as heat to the ambient diffuse medium. Some cold clouds are also evaporated inside the supernova bubbles returning material to the ambient gas. We do not include the galactic winds associated with star formation in this work. We also do not consider active galactic nucleus feedbacks.
For the parameters related to star formation and the feedbacks, we use standard values of the multiphase model in all of our simulations: the star formation timescale is Gyr, and the mass fraction of massive stars is . The “supernova temperature” is K, and the temperature of cold clouds is K. The parameter value for supernova evaporation is . In the code, the mass of a gas particle involving star formation is chosen to be divided in two: a new star particle has half of the original gas mass, and the mass of the gas particle decreases by half. Thus, the total number of particles in each model increases as star formation occurs.
We set the gravitational softening length for the DM halo particles to kpc in all simulations. The value is about an order of magnitude smaller than the average distance between the DM particles in our models. Then we set the maximum acceleration experienced by a particle (, with the initial mass) to be equal in each component. For example, in the simulations of model LH in isolation and in interaction with model EH, the softening lengths for the gas (both halo gas and disk gas), disk star, and bulge particles are determined accordingly to be 0.04, 0.07, and 0.07 kpc, respectively. The softening lengths for disk gas and disk star particles are comparable to the average distances between particles in the components.
To achieve better accuracy in the force computation, we chose the value of the parameter , which controls the accuracy of the relative cell-opening criteria (Springel 2005), to be in all simulations, which is about an order of magnitude smaller than the values popularly used in galactic-scale simulations. We set the opening angle to , which is used for the first force computation.
4. Results of distant encounters
4.1. Orbital Parameters and Trajectories
We run three simulations of distant encounters between the ETG and the LTG to examine the effects of the hot gas halo. They are the E-L, EH-L, and EH-LH runs. Their initial conditions are listed in Table 2. In all runs, the mass ratio of the ETG to LTG is 2:1 (Table 1). (We have also considered the E-LH case. This run is presented in Appendix B.)
In each run, the ETG is initially placed at the origin and the LTG is positioned at ( with the initial relative velocity of ( toward the ETG. The initial position (initial impact parameter) of the LTG is chosen so that the closest approach distance becomes about 100 kpc. (Throughout this paper, we consider the position of the center of mass of the bulge of each galaxy as the center position of the total galactic system.) The disks of all LTGs are initially set in the plane without tilt and have clockwise directional spin when viewed from the positive axis.
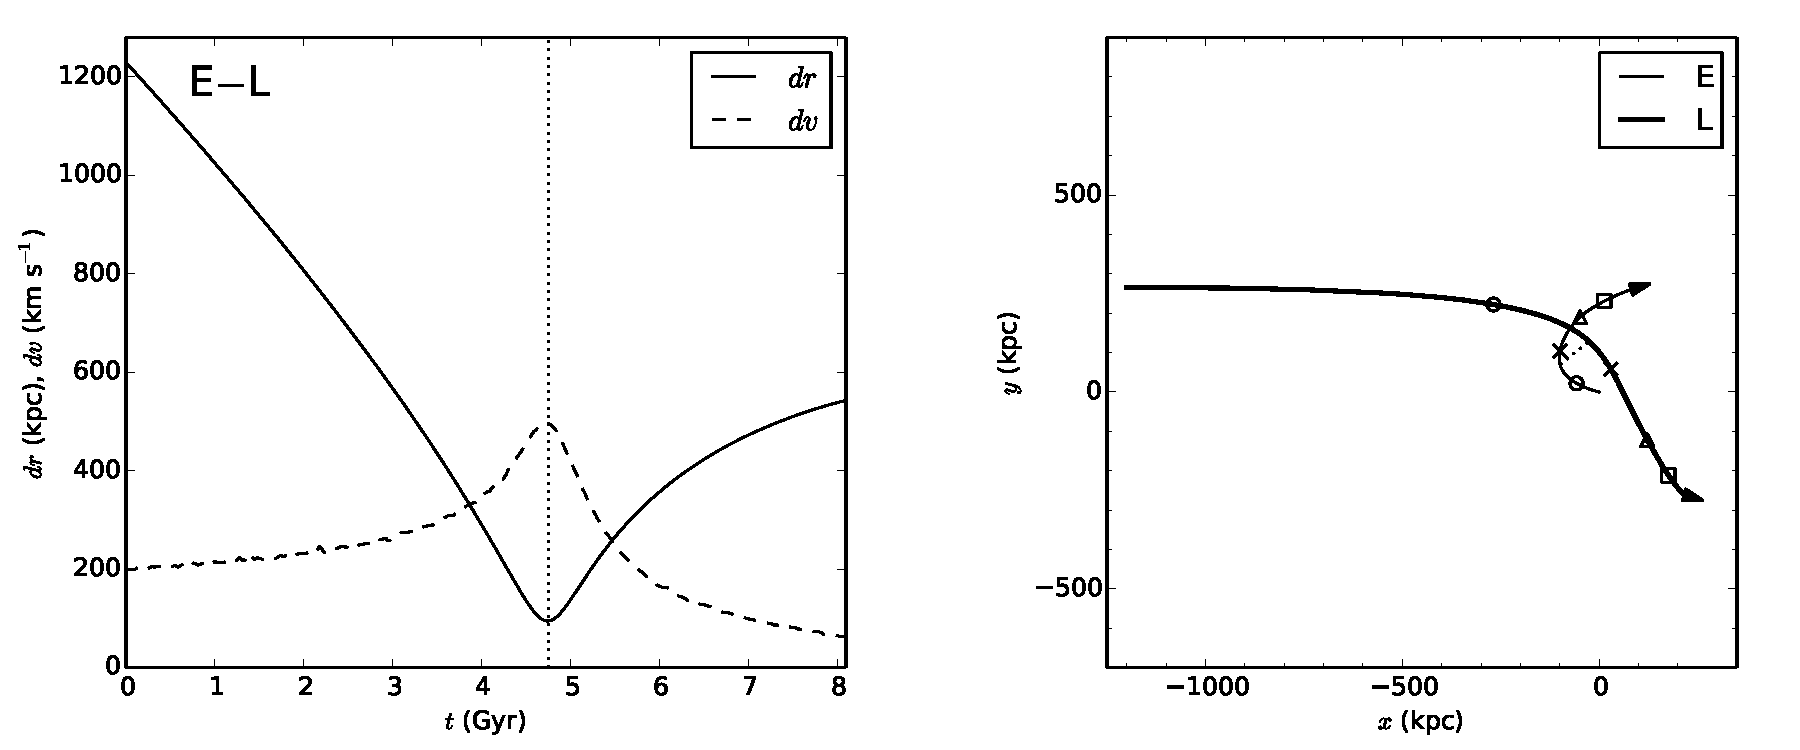
The three simulations are run for over 8 Gyr. In the left panel of Figure 1, the distance between the LTG and the ETG, , and the relative velocity of the LTG, , in run E-L are plotted as a function of time. The two galaxies encounter most closely at Gyr with kpc. (In this paper, time represents the time elapsed since the start of the simulation, if not otherwise specified. The projected distance between the galaxies onto the plane is close to the three-dimensional distance throughout the run because the galaxies move mostly in the plane.) In the right panel of Figure 1, the orbital trajectories of the late-type (thick solid line) and the early-type (thin solid line) galaxies in run E-L are presented. The positions of the two galaxies at 4, 5, 6, and 7 Gyr are marked on their trajectories with circles, crosses, triangles, and squares, respectively.
As for runs EH-L and EH-LH, the orbital trajectories of the galaxies are almost the same as those in run E-L (see Table 2 for the closest approach events).
4.2. Evolution of Run E-L
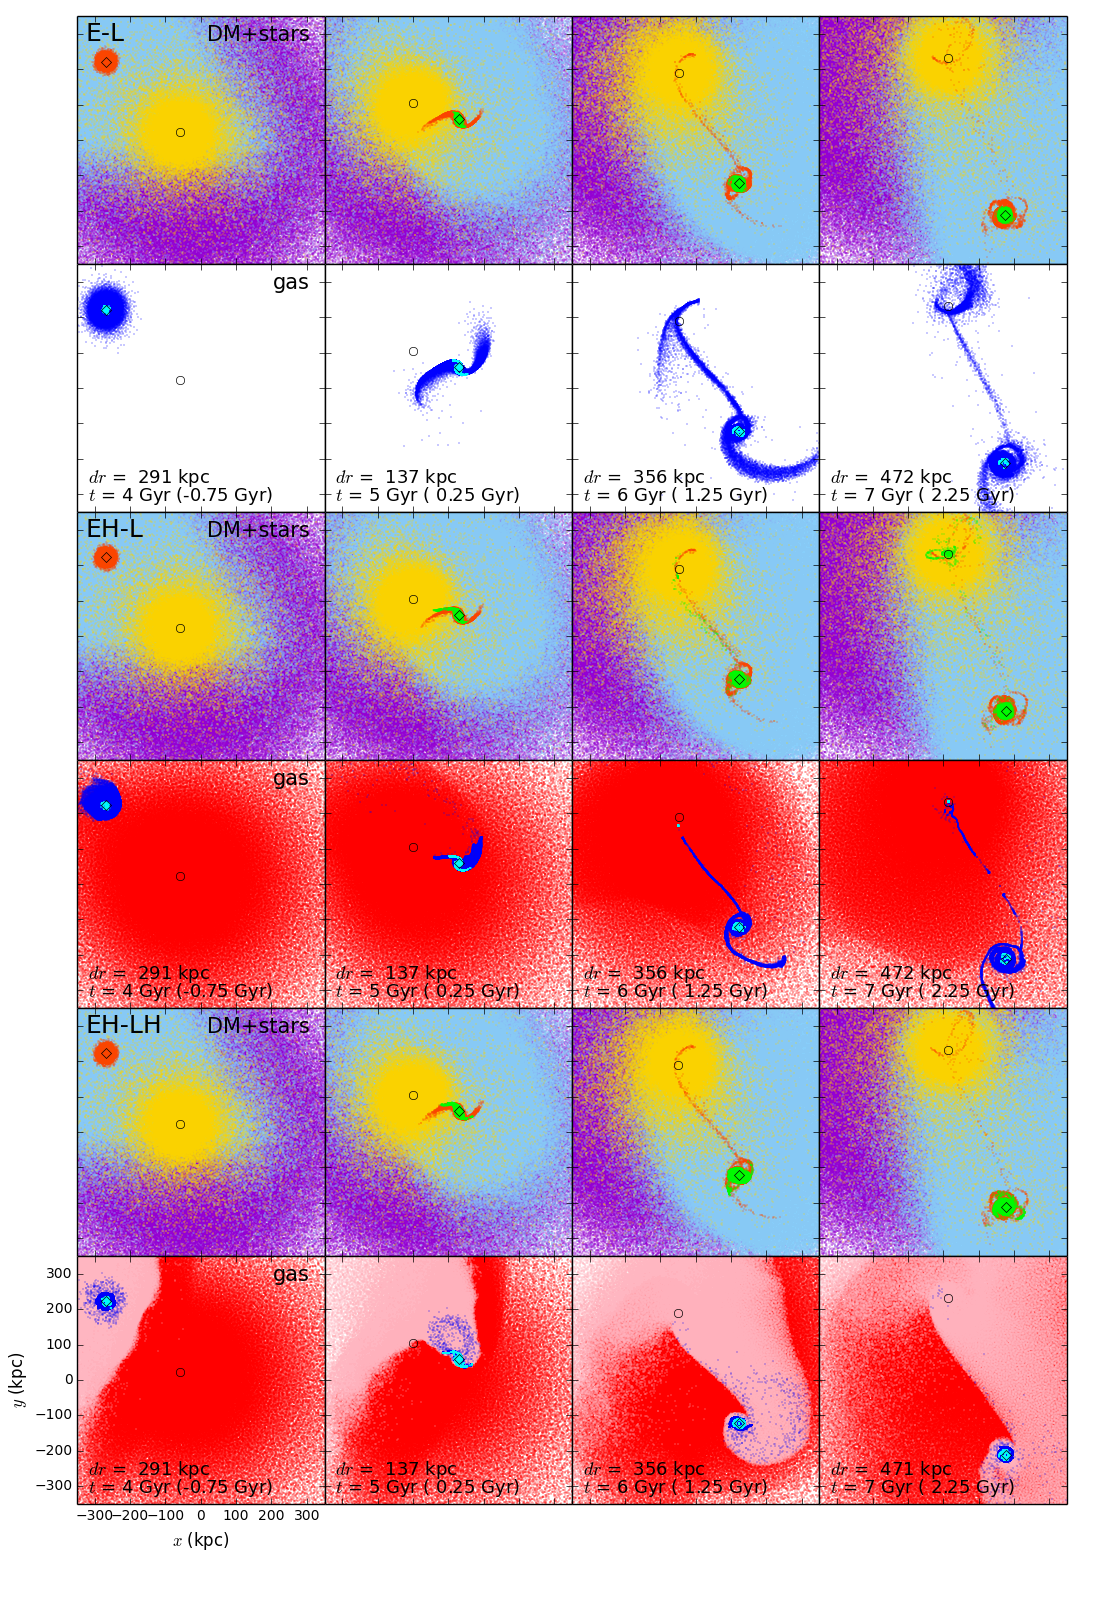
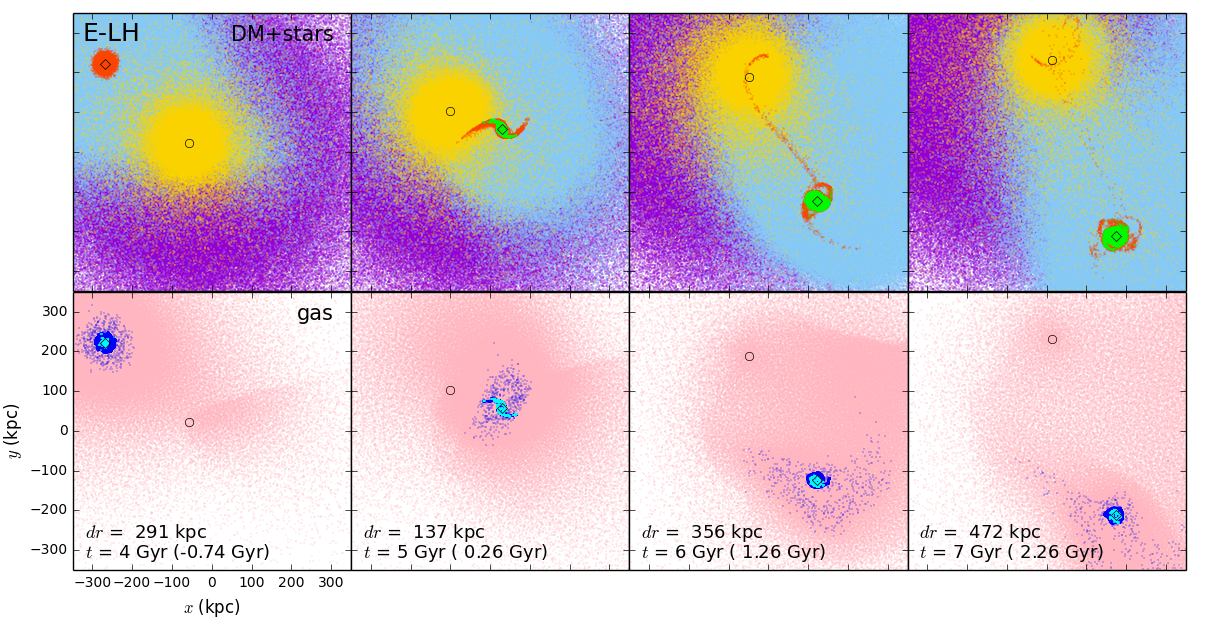
Figure 2 (top two rows) shows the snapshots taken at 4, 5, 6, and 7 Gyr. The closest approach is at Gyr. The time measured from the closest approach (written in the parentheses) and the three-dimensional separation between the two galaxies, , at each time are given in the lower panels.
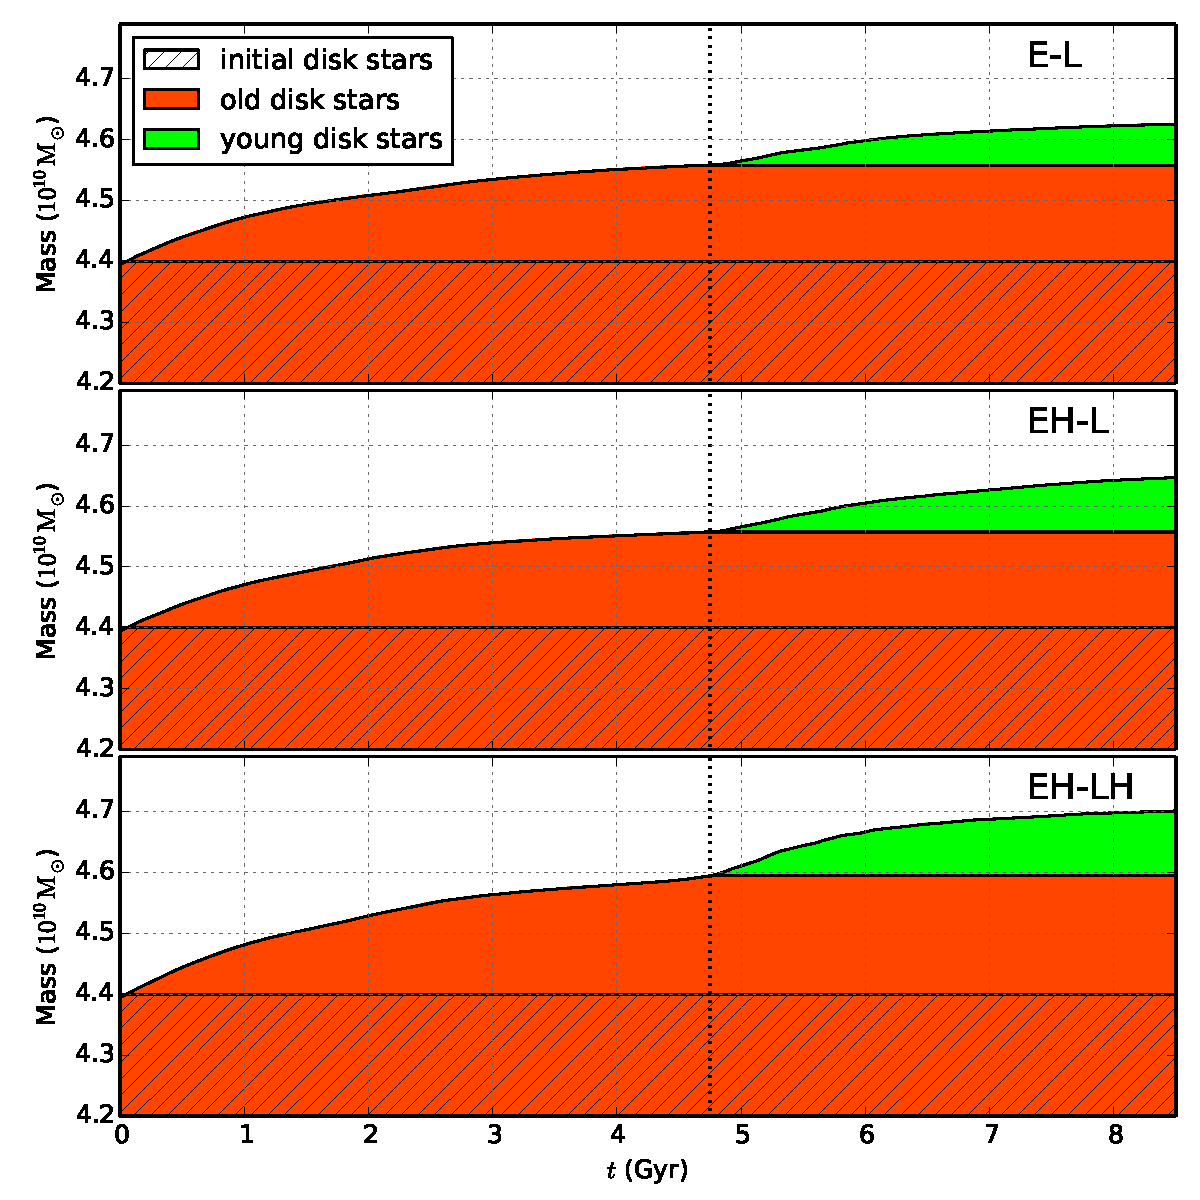
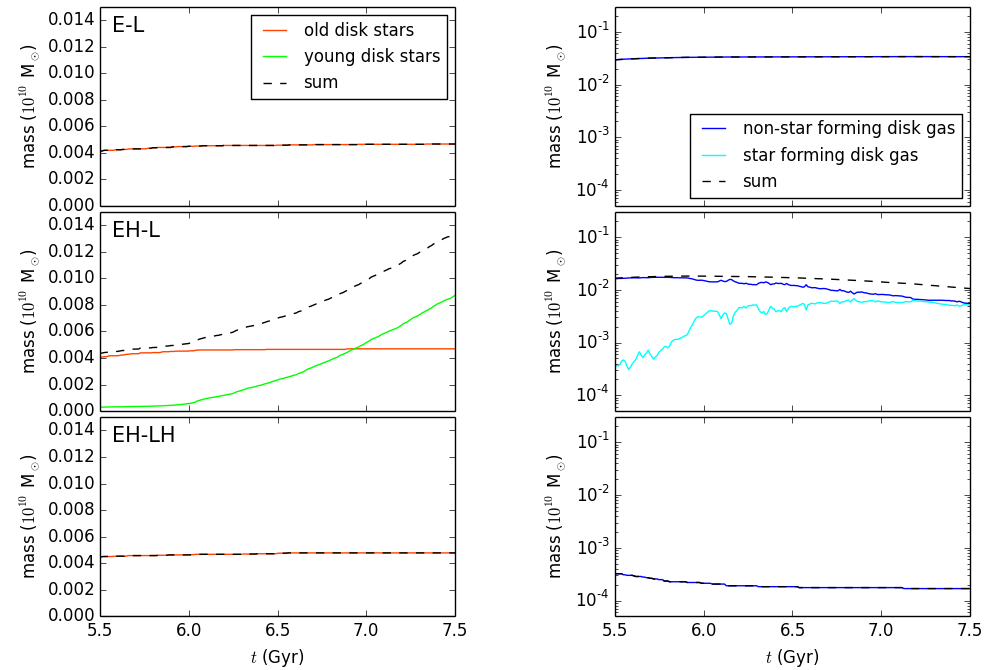
The second snapshot shows early development of a tidal bridge and a tail out of the stellar and the gas disks of L shortly after the closest approach. The third snapshot shows that non-star-forming disk gas (blue points) and “old” disk stars (orange points; the disk stars existed before the closest approach) are transferred from L to E. The cold non-star-forming gas flows through the tidal bridge and dynamically follows the motion of the accreted old stars. However, none of the green points, which represent the stars formed out of the gas since the closest approach (hereafter, “young” (disk) stars), nor any of the cyan points, which represent the gas particles having positive values of SFR at that instant, i.e. star-forming gas, are transferred to E in this run. In the last snapshot, the accreted cold gas and the old stars appear to orbit around the center of E. (Throughout this paper, we refer to the particles by their original setup, if not otherwise specified. For example, “disk star particles of the LTG” mean the particles initially set as the disk star particles of the LTG. Similarly, “disk gas particles” mean the particles initially set as the disk gas and those have not turned into stars by the time.) The total mass of the old and young disk stars is shown in Figure 3 (top panel).
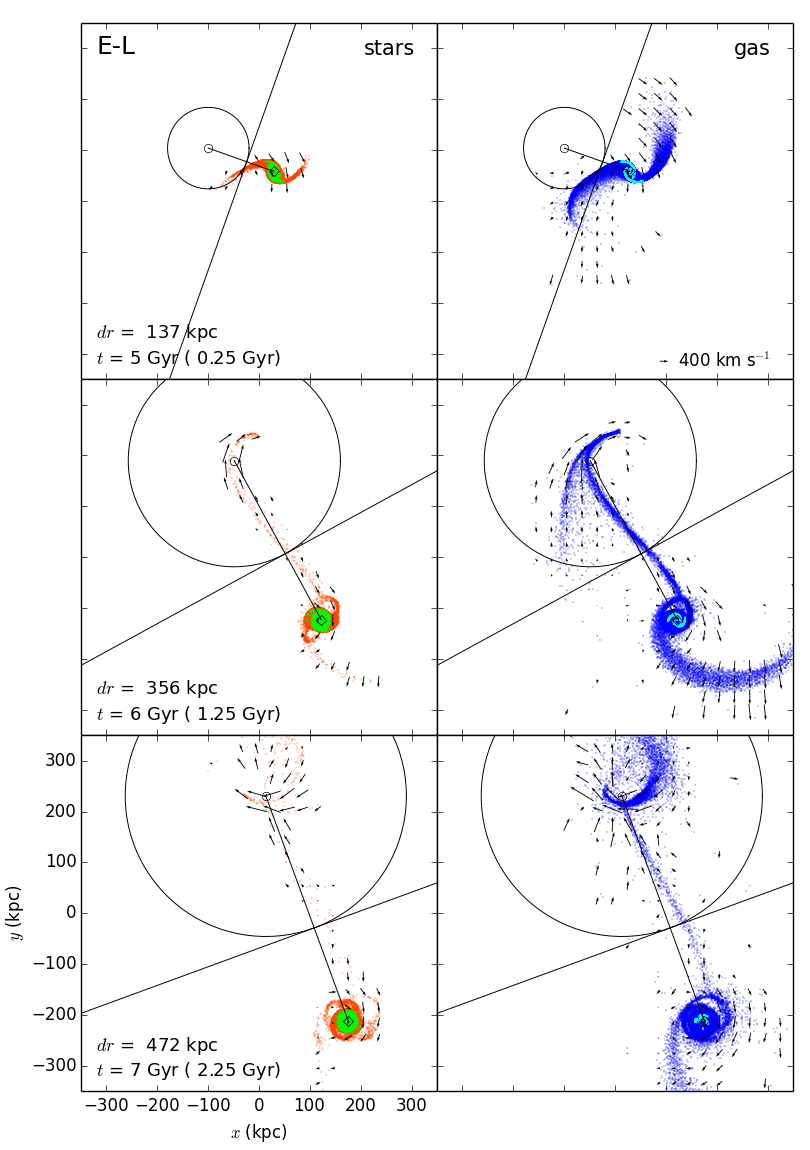
To show the mass transfer from L to E more clearly, we display in Figure 4 the disk particles of L together with the velocity vectors in a reference frame centered on the center of the ETG projected onto the plane. The disk star and gas particles move toward E through the bridges in a dynamically similar fashion. To estimate the amount of the disk particles transferring to E, we use a sphere centered on E with the radius to the point where the net local gravitational acceleration becomes zero along the line connecting the centers of E and L, assuming each galaxy as a point mass. At 6 Gyr, some of the old disk stars (orange points) and a relatively large number of cold non-star-forming disk gas (blue points) are transferring to E, seen within the sphere; however, none of the young stars (green points) nor any of the star-forming disk gas (cyan points) are found within the sphere. By Gyr, old disk stars and cold disk gas have continued to transfer to E. Those materials captured by E move around the center of E. The star and gas bridges begin to fade away. Figure 5 (top panels) presents the total mass of the disk materials enclosed within the spheres with respect to time after the closest approach (for Gyr). At = 6 Gyr, about of old disk stars and of non-star-forming disk gas are accreted onto E. The amount of the transferred cold gas is about 5% of the original cold disk gas mass. The accreted materials do not include young disk stars or star-forming gas in this run.
4.3. Evolution of Run EH-L
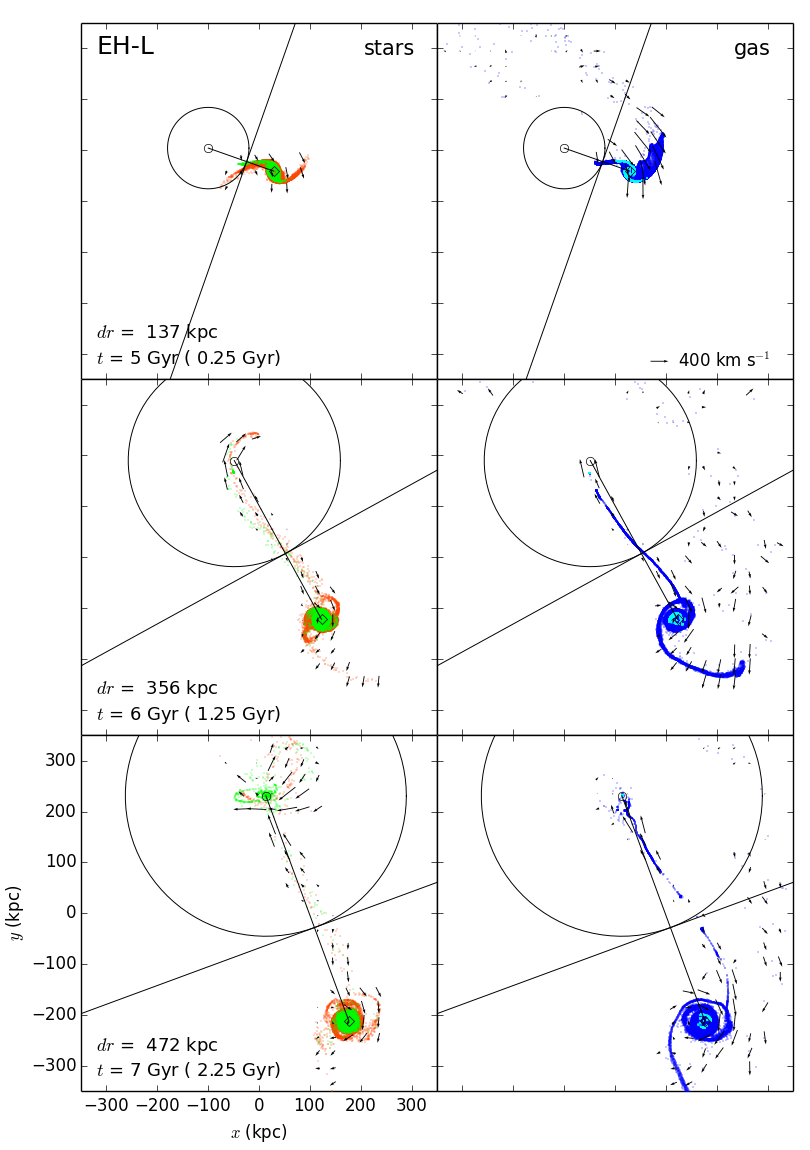
As shown in the snapshots in Figure 2 (third and fourth rows), the distribution of the old disk stars (orange points in the upper panels) is generally the same as that in the E-L run throughout the simulation. However, the young disk stars (green points) and the disk gas (blue points) show very different configurations. In the first snapshot at Gyr, the gas disk forms a bow-like front as it moves against the halo gas included in EH (red points in the lower panels), and some disk gas at the other side is stripped. In the next snapshot, at 0.25 Gyr after the closest approach, the gas bridge develops nearly straightly, while the stellar bridge consisting of the old disk stars bends below the gas bridge. There is a burst of star formation (green points) in the shock-compressed gas along the gas bridge right after the closest approach. The offset between those young stars and the old stars reflects the strength of the shock. The gas bridge, including some of star-forming gas (cyan points), continues to extend almost radially to the center of EH. The last snapshot shows that the accreted old and young stars orbit around EH with different orbits. Some young stars and cold gas accumulate at the center of EH. It should be noted that, in the previous run E-L, no young stars manage to transfer to the ETG (see the top two rows in Figure 2). The middle panel of Figure 3 shows overall more production of young stars (including those transferred to EH) in the EH-L run than in the E-L run.
The disk particles are displayed separately in Figure 6. The total masses of the disk gas and disk star particles transferred to EH are shown in Figure 5 (middle row). Compared to run E-L, a similar amount of the old disk stars but less than half the amount of non-star-forming cold gas is transferred to EH within the large spheres drawn in Figure 6. At = 5 Gyr (top row in Figure 6), the young stars (green points) and the star-forming gas (cyan points) are seen over a wider area along the bridges compared to those in run E-L; some of them are located beyond the line of the zero gravity toward EH. At later times, EH is able to accrete the star-forming gas and some of the young stars to its center. In addition, some non-star-forming gas particles accumulated at the center of EH later turn into stars in this run.
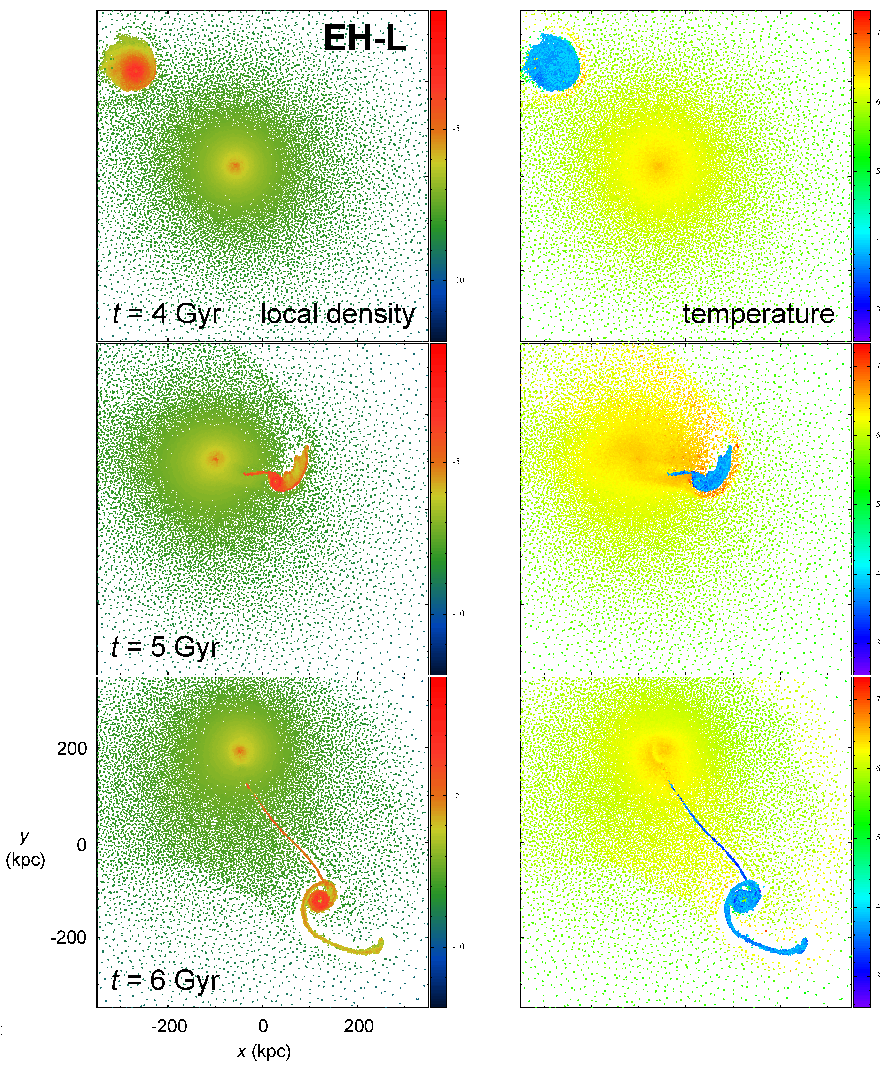
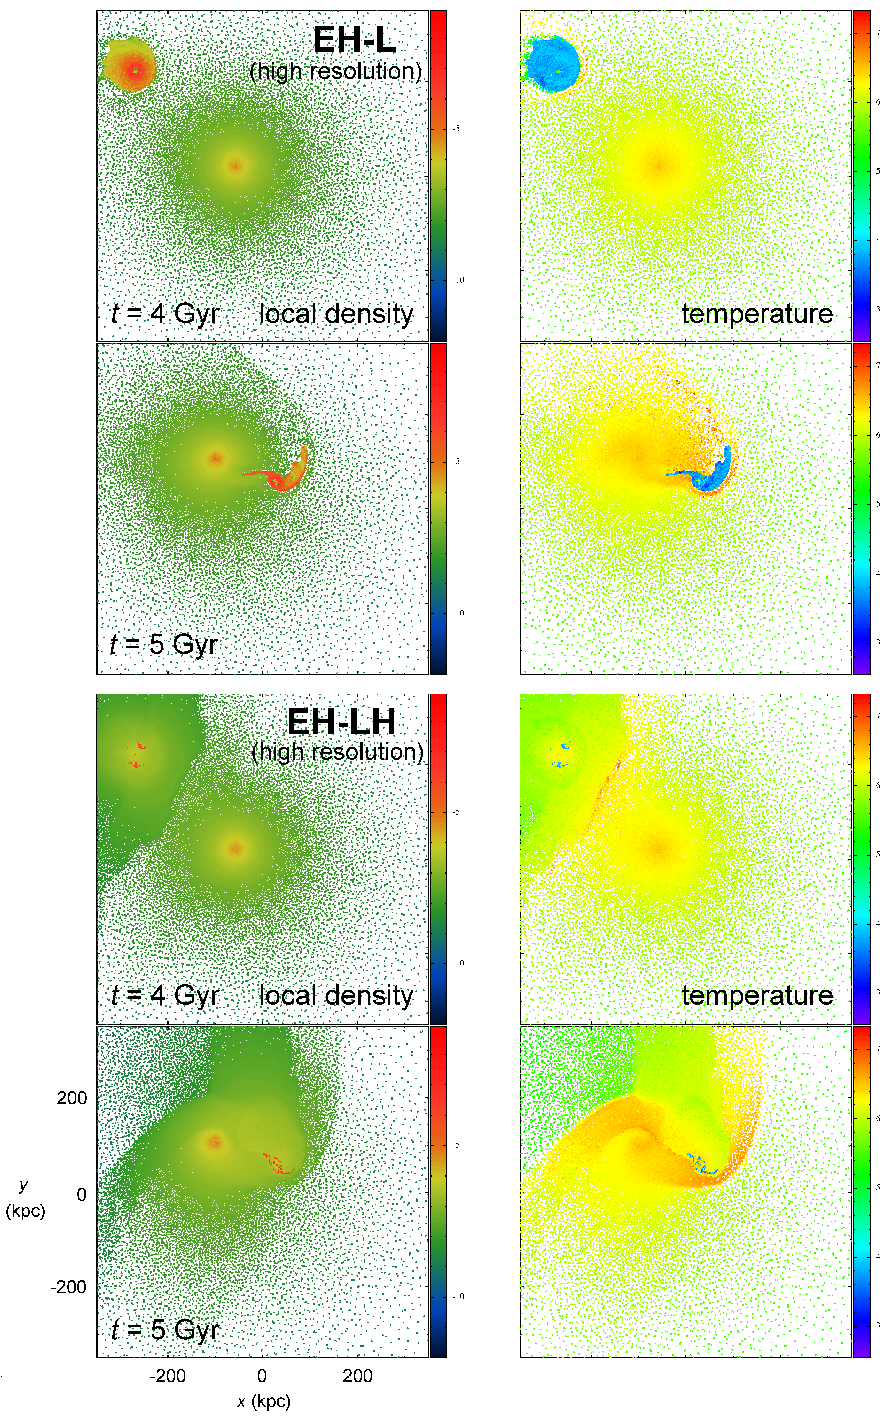
In Figure 7, we present the local density and the temperature of the gas particles located near the orbital plane (within kpc) to show how cold disk gas is affected by hot halo gas through the hydrodynamic interaction. As the gas disk approaches the gas halo (top row), the gas density at the leading side of the disk rises, and some halo gas piles up along the bow-like front of the disk. The piled gas has higher temperatures due to the shock heating. Shortly after the closest approach (middle row), a channel for the cold gas toward the center of E is created. This channel is seen between the inner trailing shock wound around EH taken over by the supersonic motion of L and the preceding shock that appears due to the cold gas tidal bridge. The cold gas can flow though this channel and is not blocked by shocks because the shocks exist parallel to the cold gas bridge. (We have checked that the positions of the shocks in this run and in run EH-LH, which strongly determine the subsequent evolution, are unchanged in different-resolution runs. We present the high-resolution simulations in Appendix C.)
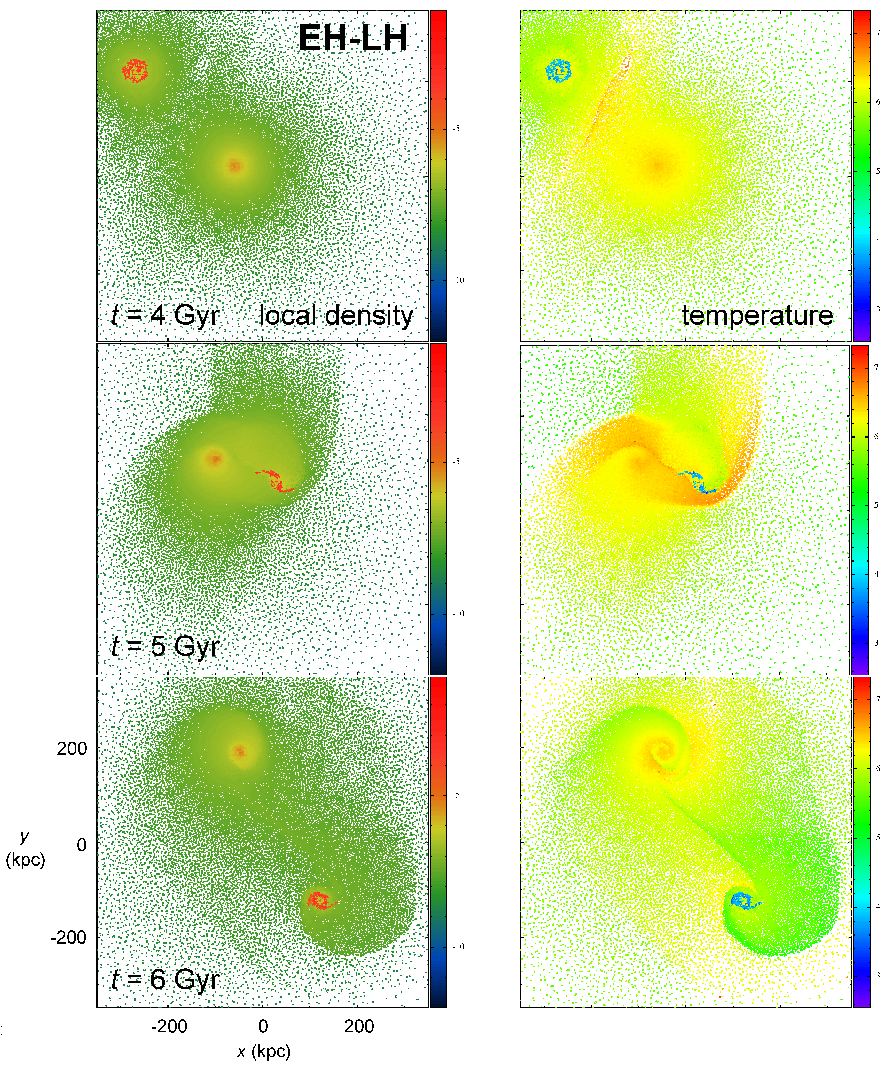
4.4. Evolution of Run EH-LH
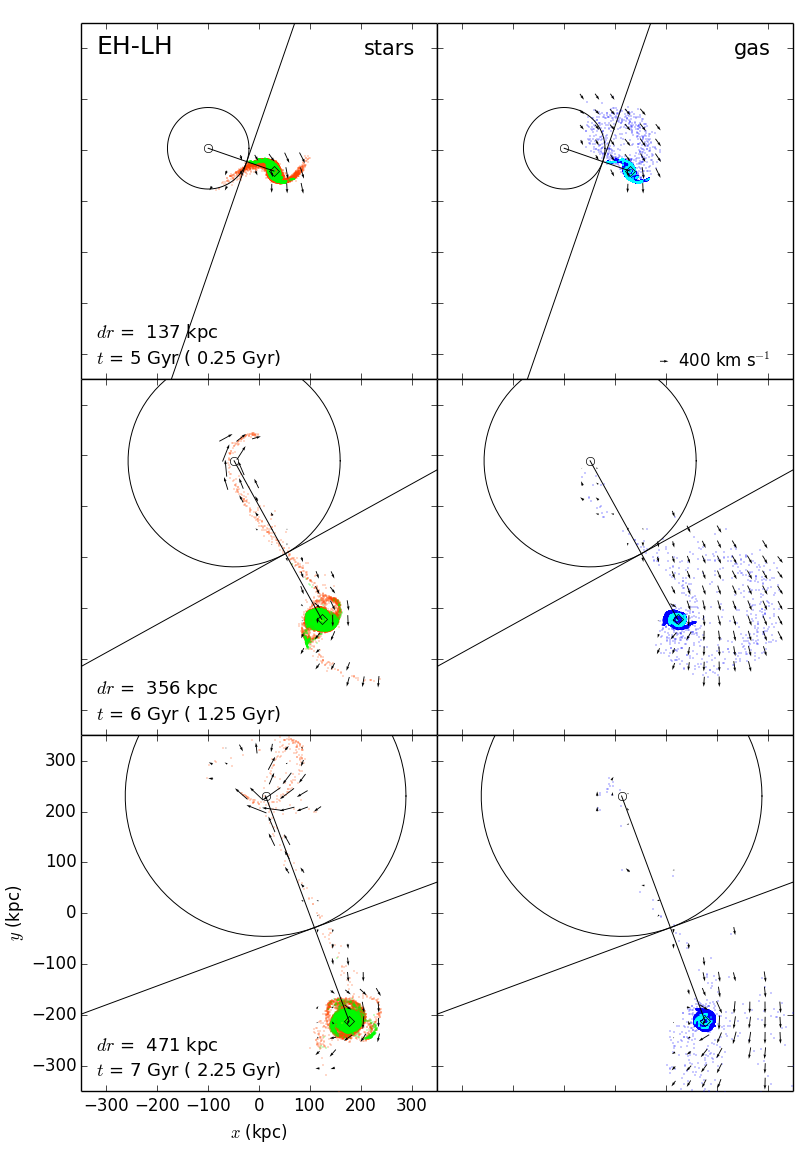
Figure 2 (bottom two rows) shows the four snapshots from run EH-LH, where both ETG and LTG possess hot gas in their surrounding halos (red and pink points, respectively). The old disk stars evolve in the same way as in the two previous runs at all times, but the cold gas evolves in a unique way, being affected by the gas halos. At Gyr, a large-scale shock is formed between the two hot gas halos (bottom-left panel). By this time, some disk gas at the outskirt has been ionized and scattered into the halo because of the hot halo gas of its own galaxy. In addition, the gas disk in this run has dissipated more quickly than the other two runs and produced more stars because of the compression exerted by its halo (see Paper I for more details), before the gas halo of LH is affected by the collision with the gas halo of EH. At later times ( = 5 through 7 Gyr), the gas disk does not develop a strong bridge as in the other runs, and almost no cold gas is transferred to EH.333The strength of a gas bridge will vary in different settings. For example, in the case of closer encounters, a gas bridge might develop more strongly to the neighboring galaxy. Some halo gas particles of LH cool down to the disk and then turn into stars. The total mass of these stars formed out of the original halo gas of LH is less than 1 % of that of the stars generated out of the original disk gas; they are found at the central part of the disk. Figure 3 (bottom panel) shows that the total mass of the young stars increases rapidly near the closest approach but slows down after a couple of gigayears. These young stars are all found on the disk of LH, not within EH.
Figure 8 displays the distribution of the disk particles. At 5 Gyr, the young stars formed since the closest approach (green points) appear along the bridge, but are less extended compared to run EH-L; the gas bridge does not grow beyond the line of zero gravitational acceleration. At 6 and 7 Gyr, some old stars (orange points) are seen transferred to EH. However, no young stars and only a little non-star-forming gas (blue points) are captured by EH. The total masses of the star and gas particles transferred to EH are presented in Figure 5 (bottom row). The amount of the old stars transferred to the early-type neighbor is similar to (a little bit more than) those in the previous runs. But the total mass of the cold gas moved to EH is much less than that in the other two runs.
The local gas density and the gas temperature are shown in Figure 9. The discontinuities of the gas quantities are seen at the shock. As LH turns around EH (middle row), the inner trailing shock propagates toward the center of EH before the cold gas tidal bridge starts to extend toward EH, blocking its motion to the center of EH. While the cold disk has been already dissipated a lot by this time through star formation, the blocking by the shock further hinders the growth of the cold gas bridge and ionizes it. The shock is later completely wound around EH and makes a spiral pattern in the hot halo gas (bottom row).
4.5. Star Formation Activities
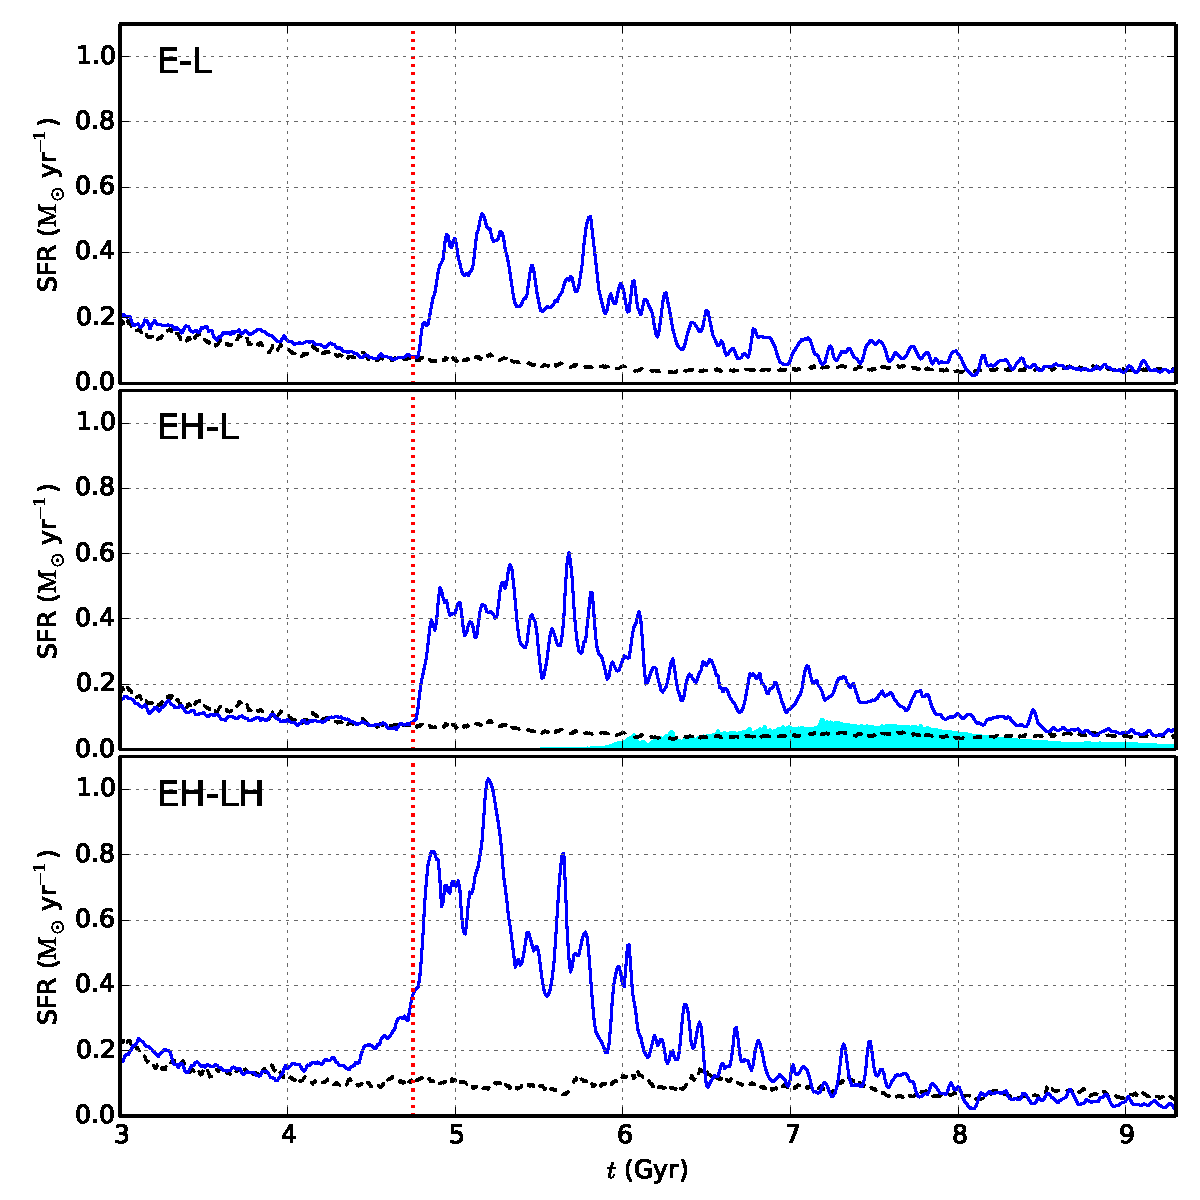
We present the SFRs in the three runs in Figure 10. In run E-L (top panel), the SFR (blue solid line), which is the sum of the SFRs from all gas particles originally set as the disk gas, rapidly increases right after the closest approach at Gyr (marked by a vertical dotted line). This compares with a gradual decline of SFR of the corresponding isolated L (black dashed line). The value at the first peak of the blue line at = 4.95 Gyr is 0.46 , which is about six times the value of the isolated galaxy at the same instant. The excess of the SFR lasts until 8 Gyr.
In run EH-L (middle panel), the SFR (blue line) also abruptly exceeds that of the isolated galaxy L (black line) right after the closest approach. The excess is a little greater and lasts longer than that in run E-L. The SFR at the first peak is 0.5 at Gyr, which is about seven times that of the isolated galaxy L. (We neglect the SFRs of the halo gas particles of the ETG model EH because they are very small, although not always zero, with a maximum value of 0.018 ). This implies that the enhanced star formation in this run is due to the compression of the gas disk through the collision with the gas halo of EH. Although some of the disk gas particles are heated and stripped, the compression by the shock initiated during the collision is mainly responsible for the cold gas having a higher SFR. Among the star-forming gas particles of L, some are captured by EH after the encounter. The total SFR of the gas particles transferred to EH is shown with the cyan shade for . Some non-star-forming disk gas transferred to EH also turns into star-forming gas particles later, when they gather densely enough to satisfy the conditions for star formation. These particles lead to the increase of the shaded region around = 7 Gyr.
In run EH-LH (bottom panel),
the SFR (blue line) also exceeds
that of the isolated galaxy LH (black line)
but much more greatly than in the other two runs,
with the SFR of 0.81
at the first peak at Gyr.
The maximum value of the SFR reaches to
1.033 at Gyr.
Unlike in the others,
the excess (over the black line)
begins earlier at about = 4 Gyr, somewhat before
the closest approach,
from the onset of the collision between the two gas halos.
The shock-compressed gas halo of the LTG
consequently delivers the effects onto the cold disk,
raising the SFR since 4 Gyr.
The great excess on the SFR near the closest approach
indicates the strong compression from the shock generated by the collision.
Compared with the SFR of the isolated L,
the SFR of the isolated LH is generally higher,
mainly due to the compression exerted by the gas halo of LH;
the direct contribution from the original halo gas particles of LH
to the total SFR
is small (at most about or less in the total SFR of LH).
5. SUMMARY AND DISCUSSION
Using -body/SPH simulations, we studied distant encounters between an ETG and an LTG for a case of the closest approach distance of about 100 kpc with the mass ratio of the ETG to LTG of 2:1. We performed three comparison simulations that adopt galaxy models having or not having a hot gas halo, keeping all of the other parameters fixed. We summarize our key findings in each run as follows, focusing on the mass transfer of the disk materials to the ETG and the star formation enhancement that is due to the encounter.
1. E-L Case
A large amount of cold gas is transferred from L to E,
but it does not contain star-forming gas.
The cold gas flows through the gas bridge and
dynamically follows the motion of accreted old disk stars.
Because there is no compression of the cold gas by shock,
no new stars form along the tidal bridge.
Thus, the ETG accretes cold gas and old disk stars
but no young stars nor star-forming gas out of the LTG.
The accreted cold gas and old disk stars
orbit around the center of E.
The SFR of L in run E-L increases abruptly
right after the closest approach.
2. EH-L Case
Near the closest approach,
a shock forms along the cold disk gas tidal bridge, and
new stars form along the bridge.
The strength of this shock is seen from the offset
between the tidal bridge that consists of the old disk stars
and that consisting of the young stars and the cold gas.
A very important feature of this type of interaction is that
a channel for the cold gas toward the center of EH is created
right after the closet approach.
This channel is developed between
the inner trailing shock wound around EH
taken over by the supersonic motion of L
and the preceding shock that appears due to the cold gas tidal bridge.
The cold gas can flow almost radially through this channel
and is not blocked by shocks
because the shocks exist parallel to the cold gas tidal bridge.
The cold gas flowing to EH contains some star-forming gas.
Some of the non-star-forming gas transferred to EH
later turns into stars as well.
As a result,
EH can accrete the cold disk gas, including some star-forming gas,
at its center in this particular run,
and also accrete the old and young disk stars
around the center.
Some of the young stars are found at the center, as well.
The SFR of L in this run also increases rapidly
right after the closest approach.
The increase is greater than that in run E-L.
Then, the SFR decreases most slowly among all three runs
mainly because the accreted cold gas turns into stars later
at the center of EH.
3. EH-LH Case
As LH approaches EH, a shock is formed between the two hot gas halos.
The cold disk gas is compressed by the hot halo and produces more stars than
the other two runs before the closest approach.
The dissipation of the cold gas occurs much more effectively
than the accretion of the halo gas onto the disk.
When LH swings around EH near the closest approach,
the inner trailing shock propagates toward the center of EH
before the tidal bridge develops
out of the gas disk, which has already been largely dissipated,
toward EH and blocks its motion to the center of EH and ionizes it.
Therefore, only the old disk stars flow along the tidal bridge,
and there is no burst of star formation within the cold
gas that can be accreted to EH.
The result of the interaction is mostly the old disk star
accretion from LH to EH. The SFR of this run arises somewhat before the closest approach
because of the shock between the two gas halos.
The maximum value of the SFR after the closest approach
is much greater than that in the other two runs,
but it decreases rapidly because of the lack of the cold gas.
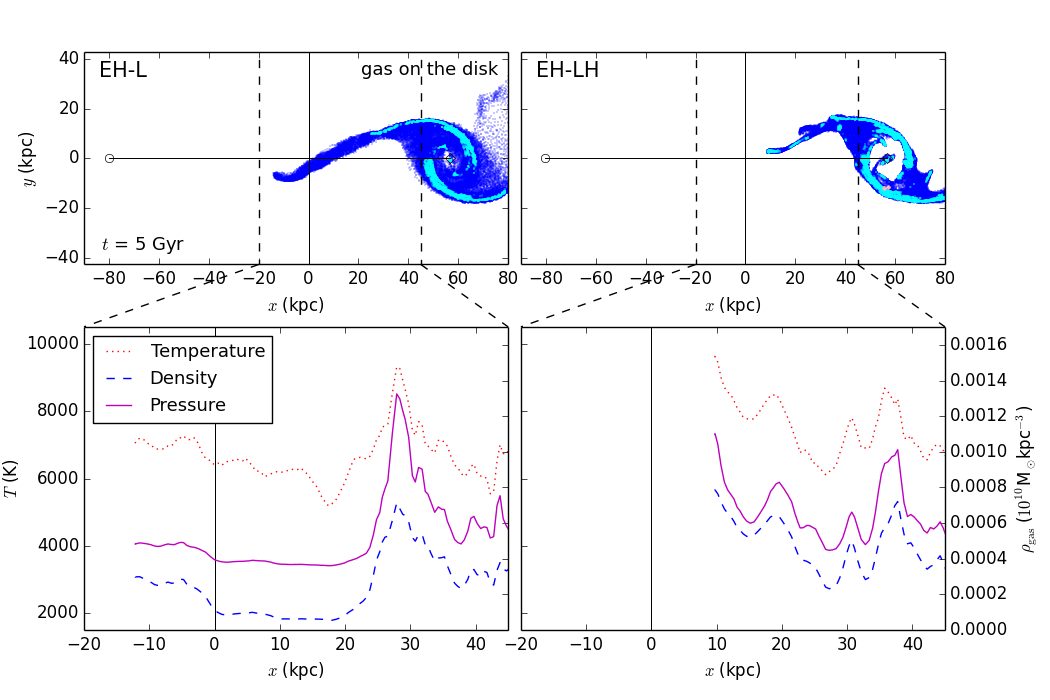
The almost no gas accretion from the LTG to the ETG in run EH-LH, unlike in run EH-L, is hinted at in the snapshots taken shortly after the closest approach when the gas bridge develops. We show in Figure 11 the gas bridges in runs EH-L and EH-LH at = 5 Gyr more closely. In the top panels, the gas particles within the disks are displayed444 The original disk gas particles that are stripped off or scattered into the halo are not plotted. Those particles that joined the halo are easily distinguished on the plane, as explained in Paper I. on a new plane that has an axis along the line connecting the centers of the two galaxies and a zero point at the position where the net local gravitational acceleration is zero. The gas bridge in run EH-L (left panel) develops toward the ETG, well beyond the = 0 line at the time. However, in run EH-LH (right panel), the gas bridge does not grow well, reaching behind the = 0 line. In order to transfer some gas to the ETG in run EH-LH, the gas bridge should have grown beyond the zero-gravity line before it is blocked by the shock. In addition, the pressure of the gas particles, shown in the bottom-right panel (magenta solid line), rises near the end of the bridge. This implies that those particles feel the net force (gravity plus pressure gradient force) toward the LTG and will not be able to flow to the ETG at later times.
The above results would vary in different situations. For example, in a case where LH encountered with EH more closely (keeping the other orbital parameters unchanged), the gas tidal bridge might be able to grow more strongly to the ETG before being blocked by the shock. Then, some gas will manage to flow to the ETG despite the shock. The materials transferring through the gas and stellar bridges might include star-forming gas and young stars in run EH-LH, as in run EH-L. It is also possible for the non-star-forming cold gas to flow to the ETG for a while through the gas bridge and turn into stars there when they become dense enough. The gas bridge is expected to vanish more quickly in run EH-LH after all, compared with the gas bridge in run EH-L, because the shock would still cross the gas bridge and ionize it. In the case of EH-L, the SFR might start to increase before the closest approach, as in run EH-LH, when they encountered each other more closely. Finally, in run E-L we expect that the disk materials captured by the ETG will hardly include star-forming gas and young stars, even in somewhat closer encounters because there is still no compression of the cold gas by shock. The materials transferring to E through the star and gas bridges would also more likely orbit around the center of E and rarely settle down at the center, unless all of the model and orbital parameters were matched to cancel out the transverse component of the velocities of the particles, leaving only the radial component. Some cold gas transferred to E might be able to turn into stars later when it becomes dense enough in closer encounters.
Overall, our simulations show that the cold gas flow and the star formation activity depend strongly on whether or not the hot gas halo is included in the ETG and/or the LTG, whereas the amount of the old disk stars accreted to the ETG and their dynamics are almost the same in all runs. Therefore, we claim that it is necessary to include hot halo gas properly in galaxy interaction simulations in order to more accurately study the transient phenomena.
APPENDIX A
EVOLUTION OF MODEL LH IN ISOLATION
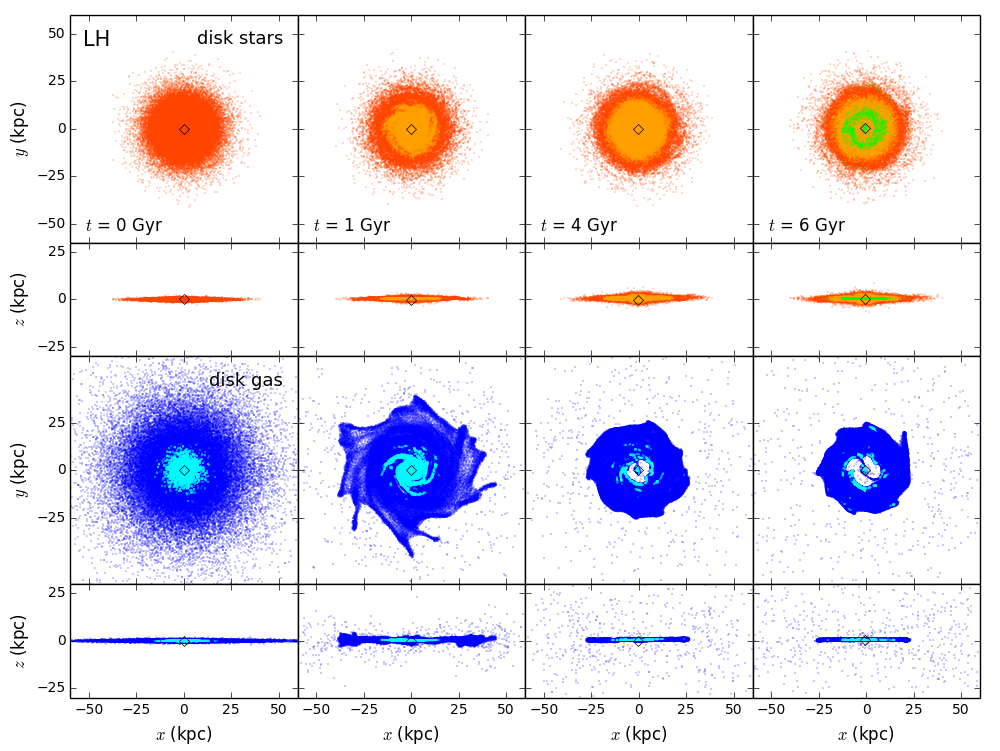
In order to check the stability of our galaxy models, we have run each of our galaxy models in isolation for about 7 Gyr. Figure 12 presents the distribution of the star (top two rows) and gas (bottom two rows) particles on the disk at = 0, 1, 4, and 6 Gyr. As time passes, some gas particles turn into stars, and spiral patterns and a central bar develop in the disk (the bar is seen in a more close-up view that is not included in this paper). At later times, the gas on the disk becomes dissipated. This is primarily because the gas has been continuously consumed by star formation, and also some of the disk gas has been heated by hot halo gas and joined the halo (see the blue points detached from the disk), while gas accretion from the halo occurs not very actively. The amount of the newly formed stars out of the original halo gas particles compared to that out of the original disk gas particles is less than 1 %. Among the star-forming gas particles (cyan points), the percentage of the original halo gas particles that cooled down onto the disk is less than 1 %, as well. Compared to model L without a gas halo, the star formation and the gas dissipation in the disk in model LH occur more actively over the course of the simulation because of the pressure on the gas disk exerted by the gas halo, despite of the gas heating. As shown in the figure, the centers of both the star and gas disks stay at the origin throughout the simulation. We have also checked whether the total energy of the model system is conserved while it evolves. The maximum variation of the total kinetic and potential energies is less than 0.9 % and 0.4 % of the initial values, respectively. The maximum change of the total internal energy of all of the gas particles is less than 7.0 % of the initial value.
APPENDIX B
EVOLUTION OF RUN E-LH
We have considered the encounter between E and LH, where only the less massive LTG has a gas halo, for comparison and completeness of our study. All of the initial orbital and simulation parameters are fixed as in the other three runs. In run E-LH, the closest approach occurs at = 4.74 Gyr with a separation between the galaxies of 94.5 kpc. Figure 13 shows the snapshots of this run at the same times as those in Figure 2. The distribution of the old disk stars (orange points) is almost identical to that in the other three runs. At the second snapshot, the newly formed stars since the closest approach (green points) along the bridge appear less prominently compared with run EH-L, where the cold disk collides directly with the hot halo of EH. In this run, many young stars are found in the disk because of the compression by the gas halo of LH, as in run EH-LH. The SFR rises as high as in run EH-LH (see the bottom panel in Figure 10), but it increases abruptly right after the closest approach. As shown in the bottom panels of Figure 13, the halo gas of the LTG (pink points) is strongly disturbed by the gravitational pull of the more massive ETG. The initial disk gas particles that have detached from the disk follow the motion of the nearby halo gas of the galaxy.
APPENDIX C
HIGH-RESOLUTION RUNS
We have performed our simulations with a higher resolution as well, in order to check particularly whether the shock features previously seen in runs EH-L and EH-LH were properly resolved. In the high-resolution runs, we use the LTG models with a four times greater number of particles, keeping all of the other model and orbital parameters unchanged. (For efficient computing performance, we used the same number of particles for the ETG models.) Figure 14 presents the local density and the temperature of the gas particles near the orbital plane (within kpc) from the high-resolution runs. As seen in the figure, the shocks occurring between the gas disk and the gas halo in run EH-L and between the two gas halos in run EH-LH are almost identical to those in Figures 7 and 9. Because the shocks strongly lead the rest of the evolution, the main results of our simulations remain consistent in different resolution runs.
References
- Barnes (2011) Barnes, J. E. 2011, Astrophysics Source Code Library, record ascl:1102.027
- Barnes & Hernquist (1992) Barnes, J. E., & Hernquist, L. 1992, ARA&A, 30, 705
- Barnes & Hibbard (2009) Barnes, J. E., & Hibbard, J. E. 2009, AJ, 137, 3071
- Barnes & Hut (1986) Barnes, J., & Hut, P. 1986, Nature, 324, 446
- Cox (2008) Cox, T. J., Jonsson, P., Somerville, R. S., Primack, J. R., & Dekel, A. 2008, MNRAS, 384, 386
- Genel et al. (2008) Genel, S., Genzel, R., Bouché, N., Sternberg, A., Naab, T., Schreiber, N. M. F., Shapiro, K. L., Tacconi, L. J., Lutz, D., Cresci, G., Buschkamp, P., Davies, R. I., & Hicks, E. K. S. 2008, ApJ, 688, 789
- Hernquist (1990) Hernquist, L. 1990, ApJ, 356, 359
- Hwang & Park (2009) Hwang, H. S., & Park, C. 2009, ApJ, 700, 791
- Hwang et al. (2013) Hwang, J.-S., Park, C., & Choi, J.-H. 2013, JKAS, 46, 1 (Paper I)
- Katz et al. (1996) Katz, N., Weinberg, D. H., & Hernquist, L. 1996, ApJS, 105, 19
- Kennicutt (1998) Kennicutt, R. C. Jr. 1998, ApJ, 498, 541
- L’Huillier et al. (2015) L’Huillier, B., Park, C., & Kim, J. 2015, MNRAS in press (arXiv:1505.00788)
- McMillan & Dehnen (2007) McMillan, P. J., & Dehnen, W. 2007, MNRAS, 378, 541
- Moster et al. (2011) Moster, B. P., Macciò, A. V., Somerville, R. S., Naab, T. & Cox, T. J. 2011, MNRAS, 415, 3750
- Moster et al. (2012) Moster, B. P., Macciò, A. V., Somerville, R. S., Naab, T. & Cox, T. J. 2012, MNRAS, 423, 2045
- Naab et al. (2009) Naab, T., Johansson, P. H., & Ostriker, J. P. 2009, ApJ, 699, 178
- Navarro et al. (1996) Navarro, J. F., Frenk, C. S., & White, S. D. M. 1996, ApJ, 462, 563
- Park & Choi (2009) Park, C., & Choi, Y.-Y. 2009, ApJ, 691, 1828
- Park et al. (2008) Park, C., Gott, J. R., & Choi, Y.-Y. 2008, ApJ, 674, 784
- Park & Hwang (2009) Park, C., & Hwang, H. S. 2009, ApJ, 699, 1595
- Price D. J. (2007) Price, D. J. 2007, PASA, 24, 159
- Sinha & Holley-Bockelmann (2012) Sinha, M., & Holley-Bockelmann, K. 2012, ApJ, 751, 17
- Smith et al. (2007) Smith, B. J., Struck, C., Hancock, M., Appleton, P. N., Charmandaris, V., & Reach, W T. 2007, AJ, 133, 791
- Springel (2005) Springel, V. 2005, MNRAS, 364, 1105
- Springel et al. (2005) Springel, V., Di Matteo, T., & Hernquist, L. 2005, ApJ, 620, 79
- Springel & Hernquist (2002) Springel, V., & Hernquist, L. 2002, MNRAS, 333, 649
- Springel & Hernquist (2003) Springel, V., & Hernquist, L. 2003, MNRAS, 339, 289
- Struck (2006) Struck, C. 2006, in Astrophysics Update 2, ed. J. W. Mason (Springer Praxis: Chichester), 115
- Toomre & Toomre (1972) Toomre, A., & Toomre, J. 1972, ApJ, 178, 623
- York et al. (2000) York, D. G., Adelman, J., Anderson, J. E., et al. 2000, AJ, 120, 1579