Instituto de Astrofísica de Andalucía-CSIC, Apdo. 3004, 18080 Granada, Spain2323institutetext: Department of Physics and Astronomy, Uppsala University, Box 516, SE-751 20 Uppsala, Sweden2424institutetext: Astrophysics Research Institute, Liverpool John Moores University, 146 Brownlow Hill, Liverpool L3 5RF, United Kingdom2525institutetext: Centro de Astrofísica, Universidade do Porto, Rua das Estrelas, 4150-762 Porto, Portugal 2626institutetext: Departamento de Física e Astronomia, Faculdade de Ciências, Universidade do Porto, Rua do Campo Alegre, 4169-007 Porto, Portugal
The Gaia-ESO Survey: Insights on the inner-disc evolution from open clusters.††thanks: Based on observations collected with the FLAMES spectrograph at VLT/UT2 telescope (Paranal Observatory, ESO, Chile), for the Gaia-ESO Large Public Survey (188.B-3002).
Abstract
Context. The inner disc, linking the thin disc with the bulge, has been somehow neglected in the past because of intrinsic difficulties in its study, due, e.g., to crowding and high extinction. Open clusters located in the inner disc are among the best tracers of its chemistry at different ages and distances.
Aims. We analyse the chemical patterns of four open clusters located within 7 kpc of the Galactic Centre and of field stars to infer the properties of the inner disc with the Gaia-ESO survey idr2/3 data release.
Methods. We derive the parameters of the newly observed cluster, Berkeley 81, finding an age of about 1 Gyr and a Galactocentric distance of 5.4 kpc. We construct the chemical patterns of clusters and we compare them with those of field stars in the Solar neighbourhood and in the inner-disc samples.
Results. Comparing the three populations we observe that inner-disc clusters and field stars are both, on average, enhanced in [O/Fe], [Mg/Fe] and [Si/Fe]. Using the idr2/3 results of M67, we estimate the non-local thermodynamic equilibrium (NLTE) effect on the abundances of Mg and Si in giant stars. After empirically correcting for NLTE effects, we note that NGC 6705 and Be 81 still have a high [/Fe].
Conclusions. The location of the four open clusters and of the field population reveals that the evolution of the metallicity [Fe/H] and of [/Fe] can be explained within the framework of a simple chemical evolution model: both [Fe/H] and [/Fe] of Trumpler 20 and of NGC 4815 are in agreement with expectations from a simple chemical evolution model. On the other hand, NGC 6705, and at a lower level Berkeley 81, have higher [/Fe] than expected for their ages, location in the disc, and metallicity. These differences might originate from local enrichment processes as explained in the inhomogeneous evolution framework.
Key Words.:
Galaxy: abundances, open clusters and associations: general, open clusters and associations: individual: Trumpler 20, NGC 4815, NGC 6705, Berkeley 81, Galaxy: disk1 Introduction
Open clusters are among the best tracers of the chemical evolution of the Galactic thin disc (see, e.g., Friel 1995; Bragaglia & Tosi 2006) from the very distant outskirts (e.g. Sestito et al. 2008; Yong et al. 2012) to the inner regions, close to the Galactic bulge (see, e.g., Magrini et al. 2010, 2014). In particular, the clusters in the so-called inner disc, i.e. the part of the Galactic thin disc located at Galactocentric distances 8 kpc111In the whole paper the adopted is 8 kpc (see Malkin 2013), have been so far relatively little explored: indeed, few clusters are known and spectroscopically observed (e.g Carretta et al. 2005, 2007; Sestito et al. 2007; Magrini et al. 2010; Carraro et al. 2014a, b, c; Magrini et al. 2014). This is due both to observational limits, i.e., high reddening and crowding towards the Galactic Centre, as well as to high mortality of clusters in regions where the density of stars is higher (Freeman 1970; van der Kruit 2002). However, this region is of great importance because it constitutes a connection between the properties of the bulge and of the thin/thick disc.
The Gaia-ESO Survey (Gilmore et al. 2012; Randich et al. 2013) is providing high-resolution spectroscopy with FLAMES@VLT and homogeneous stellar parameters and abundances for a large sample of Galactic open clusters. The sample includes clusters located throughout the disc, at different distances from the Sun, and with ages ranging from their initial phases (with the exception of the embedded ones), i.e., a few Myr after their formation, up to several Gyr (Randich et al., in prep.). The selection of targets to be observed within clusters is as uniform as possible: briefly, Gaia-ESO observes unbiased samples of cluster candidates with GIRAFFE, i.e. their selection is based only on their location of the colour-magnitude diagrams and no other information, as radial velocity, is used to ensure their membership, and more secure cluster members with UVES (see Bragaglia et al., in preparation for more details).
Observations for several clusters were completed in the first 18 months of the Gaia-ESO Survey. Analysis is now completed and the products have been released to the consortium as Internal Data Release 2, hereafter idr2/3. The sample includes four very interesting intermediate-age/old clusters in the inner disc: NGC 6705, Trumpler 20, NGC 4815, and Berkeley 81. The first three have been discussed in a series of previous paper using Gaia-ESO idr1 recommended values (e.g., Magrini et al. 2014; Tautvaišienė et al. 2015). In the present paper, we not only consider the updated idr2/3 analysis, with important differences in the determination of the final parameters with respect to idr1 (see Smiljanic et al. 2014, for details), but we add to the sample Berkeley 81 (hereafter Be 81), which is the innermost cluster in the idr2/3 sample. We aim at comparing its abundance pattern with both field stars located in the Solar neighbourhood and toward the Galactic centre, and with the other three clusters located in the inner disc.
Be 81 is an intermediate-age cluster located at approximately 6 kpc from the Galactic centre (l=34.505, b=-2.068). It has been recently studied by Donati et al. (2014a), who, comparing observed and synthetic colour-magnitude diagrams, found an age close to 1 Gyr, a large reddening 0.9, a distance modulus of 12.4, and a metallicity close to Solar. Previous literature data on Be 81 are quite scarce: BVI photometry of a portion of Be 81 was obtained by Sagar & Griffiths (1998), from which they derived an age of 1 Gyr and a reddening 1. The only determination of the metallicity of this cluster is by Warren & Cole (2009) through calcium triplet spectroscopy. They obtained a rather uncertain sub-solar metallicity ([Fe/H]=-0.110.15 dex), somewhat unusual for its internal location in the Galactic disc. This is likely related to the limiting magnitude of Warren & Cole (2009) that did not allow them to reach stars as faint as the cluster giant branch and so they likely were not able to identify any of the cluster member stars.
The paper is structured as follows: in Section 2 we describe the analysis of Be 81 in idr2/3. In Section 3 we derive its fundamental parameters, whereas in Section 4 we compare the chemical patterns of field and cluster populations. In Section 5 we discuss the chemical patterns, and in particular the -enhancement, in the context of our current knowledge of the disc’s evolution. In Section 6 we give our summary and conclusions.
2 Sample and analysis of Be 81
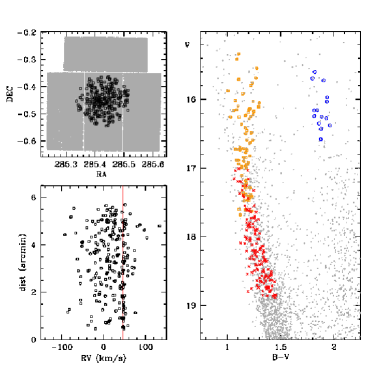
In Be 81, 14 stars were observed with UVES using the setup U580 (R=47000, 4800-5800 Å); 266 stars were instead targeted with GIRAFFE using HR15N (R=17000, 6470-6790 Å) and HR09B (R=25900, 5143-5356 Å) (16, 80, and 170 stars observed with both setups, HR09B only, and HR15N only, respectively). In Figure 1 (right panel) we show the colour-magnitude diagram of the inner 6 arcmin of the cluster. The UVES targets are candidate red clump giant stars, while the candidate main sequence stars were observed with GIRAFFE. In the upper left panel, the field of view of the photometric data in Donati et al. (2014a) obtained with the Large Binocular Camera at the Large Binocular Telescope (LBC@LBT) is presented. Finally in the lower left panel, we show the distribution of the radial velocities versus distance from the cluster centre.
The spectrum analysis of the Gaia-ESO data is organised in several working groups (WGs) that provide astrophysical parameters and element abundances. In particular, the analysis of the UVES and GIRAFFE spectra discussed in the present paper was performed by three WGs: one dedicated to FGK-type stars observed with UVES (WG11– see Smiljanic et al. (2014) for details), one for the same type of stars targeted with GIRAFFE (WG10– Recio-Blanco et al., in prep.), and another one devoted to warmer stars observed with both UVES and GIRAFFE setups (WG13– Blomme et al., in prep.).
The atmospheric parameters obtained by the different WGs were then combined by a WG dedicated to the homogenisation (WG 15) that provides a final set of recommended parameters (Hourihane et al., in prep). More specifically, the homogenisation process compares the results of the different WG for common targets and calibrators and, based on that, derives and applies offsets to obtain a common scale for all the Gaia-ESO Survey results. We mention that the idr2/3 WG 15 homogenisation process has not affected the recommended values of effective temperature (Teff), surface gravity ( g) and microturbolent velocity (), while it has derived and applied offsets in metallicity [Fe/H] and in radial velocity (RV). Also, so far, the homogenisation flow of idr2/3 does not involve the homogenisation of the elemental abundances through different WG. Therefore, the elemental abundances used in the present work are those provided as recommended values by WG11 (Smiljanic et al. 2014).
All the targets observed in Be 81 field have recommended atmospheric parameters and radial velocities in the final table of WG 15. The UVES targets also have element abundance determinations from WG11. In Table 1 we report the information about the UVES stars: namely, we provide their identification names (Cname)222the Cname is an ID used in the Gaia-ESO Survey to univocally identify an object with its coordinates and id333id of the original photometric catalogue of Donati et al. (2014a), available also the CDS, equatorial coordinates, radial velocities, stellar parameters with associated errors, RV from Hayes & Friel (2014) with associated errors, and membership flag (described in the Section 2.2). The idr2/3 RVs are in good agreement with those of Hayes & Friel (2014). In Table 2 we show the information about confirmed members (based on their RV) observed with GIRAFFE and analysed by WG10 (see Section 2.2 for the membership probability definition). Their stellar parameters are obtained with spectral indices (Damiani et al. 2014) and thus the microturbulent velocity is not determined. Stellar parameters of WG 13 are not used here because of their large uncertainties, and therefore they are not presented in Table 2.
2.1 The field comparison sample
The Solar neighbourhood
For the MW field stars, used as comparison in the present work, we considered the analysis of WG 11. Specifically, the UVES Solar neighbourhood sample aims at obtaining an unbiased sample of 5000 G-stars within 2 kpc from the Sun in the turn-off phase (see Gilmore et al. in prep. for a description of the samples). The final purpose is to quantify the local elemental abundance distribution functions in detail. For this paper we used the whole sample of 861 Milky Way solar neighbourhood stars with recommended parameters.
The bulge and inner disc.
UVES stars observed in parallel with the GIRAFFE targets dedicated to the study of the Galactic Bulge are expected to be evolved stars belonging to both bulge and inner-disc populations. During the first 18 months of the Gaia-ESO Survey, 80 stars of the bulge/inner-disc were observed and are included in the present discussion.
| Cname | ID | R.A. | Dec. | RV | Teff | g | [Fe/H] | RVHF14 | Mem. | |||||||
|---|---|---|---|---|---|---|---|---|---|---|---|---|---|---|---|---|
| J2000.0 | (km/s) | (km/s) | (K) | (K) | (km/s) | (km/s) | ||||||||||
| 19013537-0028186 | 32696 | 285.397384 | -0.471833 | 46.66 | 0.40 | 4966 | 88 | 3.09 | 0.17 | 0.3 | 0.1 | 1.49 | 0.12 | - | - | m |
| 19013631-0027447 | 47682 | 285.401294 | -0.462442 | 46.94 | 0.40 | 4911 | 105 | 2.98 | 0.13 | 0.23 | 0.13 | 1.45 | 0.13 | 47.1 | 0.7 | m |
| 19013651-0027021 | 33913 | 285.402107 | -0.450607 | 48.0 | 0.40 | 5082 | 93 | 3.42 | 0.36 | 0.43 | 0.14 | 1.4 | 0.16 | 49.1 | 1.6 | m? |
| 19013910-0027114 | 33770 | 285.412921 | -0.453194 | 48.12 | 0.40 | 5015 | 42 | 3.04 | 0.12 | 0.15 | 0.04 | 1.48 | 0.09 | 48.2 | 0.8 | m |
| 19013997-0028213 | 47704 | 285.416526 | -0.472581 | 47.73 | 0.40 | 4880 | 73 | 2.66 | 0.2 | 0.23 | 0.22 | 1.48 | 0.07 | 47.5 | 1.2 | m |
| 19014004-0028129 | 47688 | 285.416856 | -0.470245 | 48.0 | 0.40 | 4963 | 78 | 3.08 | 0.41 | 0.25 | 0.1 | 1.45 | 0.19 | - | - | m |
| 19014127-0026444 | 46427 | 285.421947 | -0.44569 | 46.28 | 0.40 | 4938 | 47 | 3.05 | 0.07 | 0.33 | 0.11 | 1.53 | 0.17 | 46.8 | 1.1 | m |
| 19014194-0028172 | 47703 | 285.424747 | -0.471459 | 47.52 | 0.40 | 4929 | 74 | 2.86 | 0.14 | 0.21 | 0.07 | 1.54 | 0.11 | - | - | m |
| 19014228-0027388 | 46358 | 285.426169 | -0.460778 | 47.72 | 0.40 | 4907 | 57 | 2.8 | 0.15 | 0.22 | 0.08 | 1.53 | 0.12 | 47.2 | 0.7 | m |
| 19014498-0027496 | 46477 | 285.437428 | -0.463783 | 47.41 | 0.40 | 4769 | 70 | 2.82 | 0.18 | 0.22 | 0.08 | 1.47 | 0.12 | 47.8 | 0.7 | m |
| 19014525-0023580 | 46431 | 285.438563 | -0.399437 | 48.73 | 0.40 | 5022 | 12 | 3.04 | 0.09 | 0.2 | 0.08 | 1.48 | 0.09 | 48.1 | 1.3 | m |
| 19014769-0025108 | 47674 | 285.448698 | -0.419671 | 47.37 | 0.40 | 4827 | 58 | 2.81 | 0.26 | 0.14 | 0.06 | 1.48 | 0.19 | 47.2 | 0.6 | m |
| 19015261-0025318 | 35423 | 285.469182 | -0.425509 | 47.85 | 0.40 | 5015 | 83 | 3.14 | 0.18 | 0.29 | 0.14 | 1.46 | 0.11 | 48.2 | 1.0 | m |
| 19015978-0028183 | 75596 | 285.499139 | -0.471749 | 46.38 | 0.40 | 4771 | 38 | 2.44 | 0.08 | -0.33 | 0.07 | 1.45 | 0.09 | 46.6 | 1.3 | nm |
| Cname | Object | R.A. | Dec. | RV | SETUP | Teff | g | [Fe/H] | ||||
|---|---|---|---|---|---|---|---|---|---|---|---|---|
| J2000.0 | (km/s) | (km/s) | (K) | (K) | ||||||||
| 19012975-0027170 | 42246 | 285.373896 | -0.454711 | 48.79 | 1.39 | HR15N | 6811 | 174 | 3.24 | 0.33 | -0.38 | 0.18 |
| 19013178-0028535 | 32235 | 285.382405 | -0.481533 | 45.63 | 0.41 | HR15N | 7253 | 150 | 4.09 | - | - | - |
| 19013240-0023593 | 43014 | 285.385012 | -0.399756 | 47.83 | 0.87 | HR15N | 6458 | 150 | 4.28 | - | - | - |
| 19013287-0031312 | 41319 | 285.386942 | -0.525359 | 44.74 | 0.51 | HR15N | 6751 | 150 | 4.21 | - | - | - |
| 19013372-0025163 | 24010 | 285.390467 | -0.421222 | 46.22 | 3.12 | HR15N | 6628 | 142 | 3.97 | 0.28 | 0.00 | 0.12 |
| 19013495-0028320 | 32504 | 285.395616 | -0.475558 | 45.51 | 0.72 | HR15N | 6637 | 150 | 4.24 | - | - | - |
| 19013809-0027105 | 33782 | 285.408736 | -0.452932 | 46.92 | 0.79 | HR15N | 6751 | 150 | 4.21 | - | - | - |
| 19013886-0026309 | 34394 | 285.411909 | -0.441952 | 48.29 | 3.29 | HR15N | 6545 | 184 | 4.35 | 0.38 | 0.10 | 0.14 |
| 19014212-0025400 | 35245 | 285.425515 | -0.427794 | 48.0 | 2.24 | HR15N | 6840 | 126 | 4.36 | 0.24 | 0.32 | 0.11 |
| 19014417-0025115 | 45739 | 285.434035 | -0.419915 | 47.76 | 2.2 | HR15N | 6618 | 142 | 4.87 | 0.31 | 0.23 | 0.11 |
| 19014443-0026202 | 42487 | 285.43514 | -0.438959 | 46.77 | 0.81 | HR15N | 6562 | 91 | 4.23 | 0.21 | 0.66 | 0.07 |
| 19014532-0026401 | 44710 | 285.438867 | -0.444473 | 47.02 | 0.49 | HR15N | 6637 | 150 | 4.24 | - | - | - |
| 19014637-0024287 | 24366 | 285.443198 | -0.407997 | 45.48 | 0.61 | HR15N | 6751 | 150 | 4.21 | - | - | - |
| 19014728-0025559 | 35009 | 285.447001 | -0.432221 | 42.74 | 2.32 | HR15N | 6605 | 167 | 5.44 | 0.40 | -0.17 | 0.15 |
| 19014772-0027550 | 22999 | 285.448838 | -0.465302 | 46.76 | 1.14 | HR15N | 6011 | 212 | 4.65 | 0.56 | -0.44 | 0.18 |
| 19014982-0028078 | 22921 | 285.45759 | -0.468819 | 43.66 | 3.45 | HR15N | 6528 | 160 | 4.7 | 0.35 | 0.16 | 0.12 |
| 19015195-0023078 | 45059 | 285.466451 | -0.385517 | 44.37 | 0.92 | HR15N | 6676 | 90 | 4.63 | 0.2 | 0.60 | 0.08 |
| 19015300-0022239 | 25196 | 285.470846 | -0.373304 | 44.58 | 0.88 | HR15N | 6947 | 150 | 4.17 | - | - | - |
2.2 Membership
The determination of the RVs for GIRAFFE and UVES spectra, respectively, can be found in Koposov et al. (in preparation) and (Sacco et al. 2014). We have used the recommended radial velocity of the UVES and GIRAFFE sample to define the cluster systemic velocity.
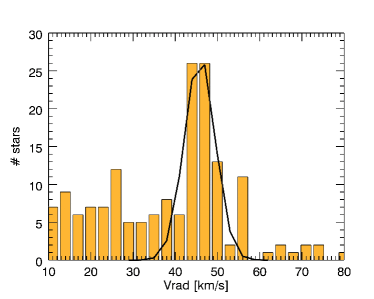
The resulting RV distribution, including both GIRAFFE and UVES targets, is shown in Fig. 2. A gaussian fit of the peak of the distribution, identifying the cluster signature with respect to the field stars, gives a central velocity of 45.8 km s-1 and a Full Width Half Maximum (FWHM) of 3.1 km s-1. To avoid a large contamination by field stars, we define a star as RV cluster member if it has a RV within 1- from the average cluster radial velocity. By doing so we identify 56 RV members, 14 observed with UVES and 42 targeted with GIRAFFE (5 observed with both HR09B and HR15N, 11 with HR09B, 9 with HR15N and analysed by WG13, and 18 others observed with HR15N and analysed by WG10). In summary, 20% of the observed targets (almost 100% for UVES and 16% for GIRAFFE) have a RV consistent with membership. For UVES, the contamination by field stars has been alleviated by observing high probability member stars whose radial velocity were obtained by Hayes & Friel (2014) to assist Gaia-ESO observations. For GIRAFFE, the low fraction of recovered cluster members is due to the location of the cluster towards the Galactic Center where a large contamination by field stars is expected.
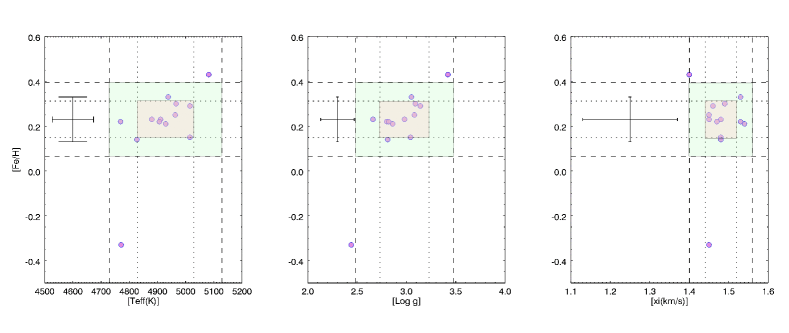
In Fig. 3 we show [Fe/H] versus atmospheric parameters of the UVES stars. We remind the reader that stars observed with UVES are selected to be red giant stars in the clump (RC). They were, thus, expected to have similar atmospheric parameters. The average error (as given in the recommended value table) is plotted on the left side of each panel. The 1- and 2- around the median value 444 is the median absolute deviation (MAD), computed with the Robust sigma routine of IDL areas are also marked. We note that the star with the lowest metallicity (19015978-0028183) is beyond 1- from the median Teff and 2- from the median g, likely being a non-member with radial velocity consistent with the cluster systemic velocity. This is not surprising given the expected high contamination of field stars. The most metal rich star (19013651-0027021) is also somewhat deviant and might be a non-member star as well. In the next sections we discuss the chemical homogeneity of cluster member stars and how it can help to disentangle member versus non-member stars.
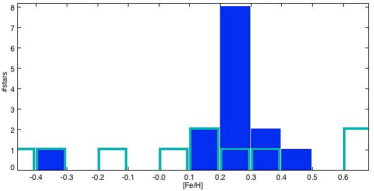
In Fig. 4 we plot the histogram of the Gaia-ESO recommended metallicities, [Fe/H], of the RV member stars observed with UVES and GIRAFFE. The two distributions are compatible: the median of the UVES stars is [Fe/H]=0.230.08 dex, whereas for the GIRAFFE stars is 0.160.44 dex. The UVES metallicities are much more concentrated in the bin centred at 0.25 dex, while the GIRAFFE metallicities are more dispersed due to the lower resolution and smaller spectral range. Note that the errors in Table 2 are based on a single determination of stellar parameters, while the errors in Table 1 are computed with the MAD of typically ten determinations. Thus the errors on stellar parameters and metallicities of the GIRAFFE stars are likely underestimated.
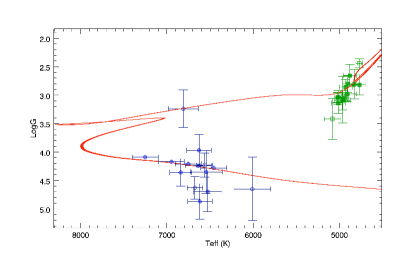
In Fig. 5 we present the HR diagram of the candidate member stars based on RV with a PARSEC isochrone (Bressan et al. 2012) suitable for the age and metallicity of Be 81 (see next Section). We show with different colours the UVES and GIRAFFE stars. The most metal poor UVES star is located in the upper part of the plot, quite far away from the location of the other clump stars. The most metal rich star is located just below the main locus of the clump stars. The GIRAFFE targets were selected among main sequence (MS) stars. Several members follow, within the errors, the PARSEC isochrone, while other stars have very uncertain parameters and are not in agreement with the isochrone.
3 The fundamental parameters of Be 81
3.1 The chemical properties of Be 81
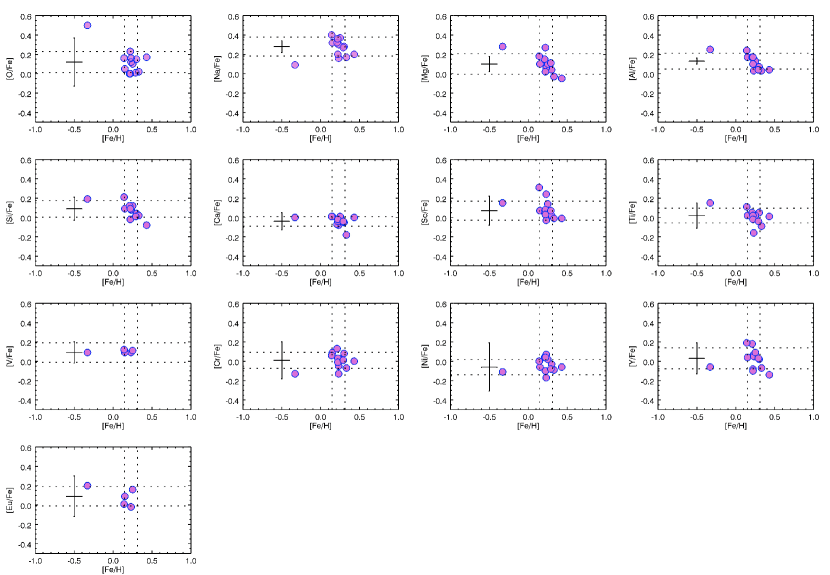
The high-resolution and high-quality UVES spectra allow WG 11 to determine the detailed composition of the stars of Be 81. In Table 3 we report the elemental abundances of the UVES stars. These are graphically presented in Fig. 6, where we show [El/Fe] of each individual UVES star. Their median values, computed excluding the metal-poor non-member star are shown in Table 4. The abundances are scaled consistently to the Solar abundances obtained in the analysis of WG 11. The adopted iron abundances are those listed in the [Fe/H] column of idr2/3 table of recommended parameters555[Fe I/H] and [Fe II/H] abundances are available as well in the idr2/3 table, but not for all stars of each cluster.. In Table 5 we show the atmospheric parameters and elemental abundances obtained for the selected Solar spectrum. For elements without a WG 11 determination, we scaled with the Solar abundance of Grevesse et al. (2007).
The abundance distribution interestingly confirms the compactness of the cluster in most abundance ratios, whereas the most metal-poor star has a different chemical pattern. This is demonstrated in Fig. 6, which shows the dispersions around the median values (dashed lines) computed with the Robust sigma IDL routine and indicated with in Table 4, as well as the typical error bar (black crosses in the left part of each panel and indicated with ) computed as the average of the individual stellar errors. The error on the parameters and abundances of each star are discussed in Smiljanic et al. (2014), where they have been estimated with the method-to-method dispersion. For most elements these two quantities are comparable indicating a high degree of chemical homogeneity of the cluster, as already noticed for NGC 6705, Tr 20 and NGC 4815 with idr1 data by Magrini et al. (2014). Be 81 is slightly enhanced in some of the -elements and in one of the neutron capture elements, having [O/Fe], [Mg/Fe], [Si/Fe] and [Eu/Fe] 0.1 dex, while it has [Ti/Fe] and [Ca/Fe] close to zero. In this context, the most metal poor star is clearly distinguishable not only for its lower [Fe/H] but also for differing more than 1- in several elemental abundances, such as [O/Fe], [Na/Fe], [Mg/Fe], [Al/Fe], [Si/Fe], [Ti/Fe], [Cr/Fe], and [Eu/Fe]. Taken altogether these chemical signatures indicate a clear non-membership of 19015978-0028183, while the most metal rich star (19013651-0027021) is consistent within 1- in all panels with the median values of the cluster and thus can be considered a bona fide member star.
| Cname | O i | Na i | Mg i | Al i | Si i | Ca i | Sc i |
|---|---|---|---|---|---|---|---|
| 19013537-0028186 | 9.110.05 | 6.860.31 | 8.050.29 | 6.820.09 | 7.800.12 | 6.540.13 | 3.540.04 |
| 19013631-0027447 | 9.010.05 | 6.810.07 | 8.050.08 | 6.830.02 | 7.810.15 | 6.450.08 | 3.690.15 |
| 19013651-0027021 | 9.260.05 | 6.910.05 | 8.090.15 | 6.920.03 | 7.810.18 | 6.720.10 | 3.640.17 |
| 19013910-0027114 | 8.860.05 | 6.750.06 | 7.960.02 | 6.770.06 | 7.700.09 | 6.450.10 | 3.440.17 |
| 19013997-0028213 | 9.050.05 | 6.670.26 | 8.000.17 | 6.710.19 | 7.770.14 | 6.440.07 | 3.420.15 |
| 19014004-0028129 | 9.010.05 | 6.900.06 | 8.060.01 | 6.830.06 | 7.830.11 | 6.550.10 | 3.610.08 |
| 19014127-0026444 | 9.010.05 | 6.780.35 | 8.010.10 | 6.810.03 | 7.810.12 | 6.440.13 | 3.540.20 |
| 19014194-0028172 | 8.870.05 | 6.810.05 | 8.070.13 | 6.830.01 | 7.790.11 | 6.430.07 | 3.490.12 |
| 19014228-0027388 | 8.880.05 | 6.860.06 | 8.200.01 | 6.840.01 | 7.770.12 | 6.470.07 | 3.520.19 |
| 19014498-0027496 | 9.110.05 | 6.700.29 | 7.950.09 | 6.770.02 | 7.660.13 | 6.490.09 | 3.470.21 |
| 19014525-0023580 | 8.960.05 | 6.810.13 | 7.960.14 | 6.830.09 | 7.750.09 | 6.500.07 | 3.460.08 |
| 19014769-0025108 | 8.960.05 | 6.820.04 | 8.030.07 | 6.830.03 | 7.810.19 | 6.440.05 | 3.670.11 |
| 19015261-0025318 | 8.960.05 | 6.840.29 | 8.110.01 | 6.780.08 | 7.760.12 | 6.540.09 | 3.580.15 |
| 19015978-0028183 | 8.830.05 | 6.040.06 | 7.660.01 | 6.370.07 | 7.320.08 | 5.960.10 | 3.040.11 |
| Cname | Ti i | V i | Cr i | Ni i | Y ii | Eu ii | |
| 19013537-0028186 | 5.270.18 | - | 5.990.14 | 6.520.29 | 2.530.12 | - | |
| 19013631-0027447 | 5.180.11 | 4.210.11 | 5.790.22 | 6.550.25 | 2.510.16 | 0.730.26 | |
| 19013651-0027021 | 5.360.17 | - | 6.040.17 | 6.620.32 | 2.500.22 | - | |
| 19013910-0027114 | 5.090.11 | 4.130.11 | 5.850.23 | 6.340.21 | 2.400.32 | 0.760.13 | |
| 19013997-0028213 | 4.990.16 | - | 5.710.23 | 6.310.34 | 2.490.12 | - | |
| 19014004-0028129 | 5.190.09 | 4.25 0.11 | 5.880.19 | 6.520.26 | 2.550.16 | 0.93 0.21 | |
| 19014127-0026444 | 5.160.13 | - | 5.870.16 | 6.490.19 | 2.470.23 | - | |
| 19014194-0028172 | 5.180.13 | - | 5.950.23 | 6.500.24 | 2.600.19 | - | |
| 19014228-0027388 | 5.160.18 | - | 5.860.20 | 6.510.25 | 2.350.14 | - | |
| 19014498-0027496 | 5.120.11 | - | 5.820.16 | 6.370.29 | 2.330.22 | - | |
| 19014525-0023580 | 5.170.11 | 4.18 0.12 | 5.840.17 | 6.460.22 | 2.440.28 | 0.690.06 | |
| 19014769-0025108 | 5.170.13 | 4.15 0.17 | 5.810.20 | 6.390.24 | 2.540.11 | 0.670.10 | |
| 19015261-0025318 | 5.170.10 | - | 5.910.16 | 6.460.25 | 2.530.19 | - | |
| 19015978-0028183 | 4.740.10 | 3.65 0.22 | 5.150.13 | 5.810.18 | 2.320.26 | 0.390.27 |
| Element | Abundance | ||
|---|---|---|---|
| Fe/H | 0.23 | 0.08 | 0.10 |
| O/Fe | 0.12 | 0.11 | 0.05 |
| Na/Fe | 0.30 | 0.10 | 0.06 |
| Mg/Fe | 0.10 | 0.08 | 0.03 |
| Al/Fe | 0.15 | 0.10 | 0.08 |
| Si/Fe | 0.09 | 0.09 | 0.12 |
| Ca/Fe | -0.02 | 0.05 | 0.09 |
| Sc/Fe | 0.07 | 0.10 | 0.15 |
| Ti/Fe | 0.02 | 0.08 | 0.13 |
| V/Fe | 0.09 | 0.01 | 0.11 |
| Cr/Fe | 0.02 | 0.08 | 0.19 |
| Ni/Fe | -0.03 | 0.08 | 0.25 |
| Y/Fe | 0.03 | 0.10 | 0.16 |
| Eu/Fe | 0.09 | 0.10 | 0.21 |
| Teff | g | |
|---|---|---|
| (K) | km | |
| 577735 | 4.430.13 | 1.040.16 |
| Element | Abundance (idr2/3) | Abundance (G07) |
| Fe | 7.530.06 | 7.450.05 |
| O | - | 8.660.05 |
| Na | 6.280.02 | 6.170.04 |
| Mg | 7.710.06 | 7.530.09 |
| Al | 6.450.04 | 6.370.06 |
| Si | 7.460.04 | 7.510.04 |
| Ca | 6.290.03 | 6.310.04 |
| Sc | 3.220.04 | 3.170.10 |
| Ti | 4.980.02 | 4.900.06 |
| V | 3.890.05 | 4.000.02 |
| Cr | 5.610.06 | 5.640.10 |
| Ni | 6.150.14 | 6.230.04 |
| Y | 2.080.11 | 2.210.02 |
| Eu | - | 0.520.06 |
Abundances expressed in 12(El/H) form.
3.2 Age, distance and reddening of Be 81
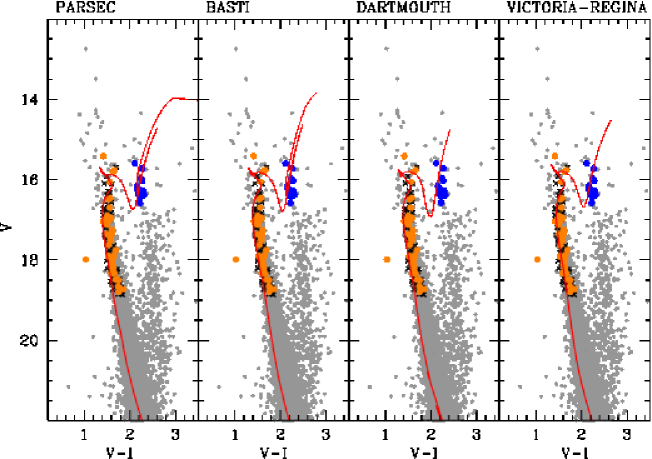
Thanks to accurate metallicity measurements and membership based on RV determinations, we are able to derive an improved age, distance, and average reddening for Be 81 by using the classical approach of isochrone fitting. As done for the open cluster Trumpler 20 (see Donati et al. 2014b), we chose four different sets of isochrones to take into account how the results change by adopting different models and quantify the effect of different input physics on the derived parameters: PARSEC (Bressan et al. 2012), BASTI (Pietrinferni et al. 2004), Dartmouth (Dotter et al. 2008), and Victoria-Regina (VandenBerg et al. 2006). We adopted the , , and photometric catalogue described in Donati et al. (2014a). The accurate spectroscopic analysis of the cluster metallicity from the UVES spectra clearly indicates a super-solar chemical mixture for Be 81, in contrast to previous findings which were based only on Ca-triplet spectra. Using this information, we are able to select a more appropriate set of isochrones and thus to obtain a more accurate determination of the cluster evolutionary status, reddening, and distance modulus.
The best-fitting isochrone is chosen by visual examination as the one which can describe at the same time the main age-sensitive evolutionary phases: the luminosity and colour of the main sequence turn-off (MSTO), red hook (RH), and red clump (RC), defined in Donati et al. (2014a), in two different photometric colours ( and , adopting , , and taken from Cardelli et al. (1989) and O’Donnell (1994)). We started by using the metallicity resulting from the UVES spectroscopic estimate, i.e. [Fe/H] dex (see Section 2.2), and we converted it to Z taking into account the different solar abundances of the four sets of isochrones. The difference in luminosity between the MSTO and RC is adopted as the most reliable constraint on the cluster age. In fact, while the colour difference between the same two indicators is related to age as well, it is used here as secondary age indicator because colour properties are more affected by theoretical uncertainties, like colour transformations and the super-adiabatic convection, while luminosity constraints are more reliable. The errors on the estimated cluster parameters are mainly due to the uncertainties in the definition of the age indicators because of the heavy contamination by field interlopers, while the photometric error does not have a significant impact on the error budget (see Donati et al. 2014a). We make use of the RV to select the most probable cluster members among the many stars observed in order to highlight the most probable cluster sequences in the CMD and to have more stringent constraints on the best-fitting models. Moreover, we tweak the age determination looking for the best-fitting isochrone in the theoretical plane , g by using the RC star parameters of the UVES targets (see Table 1).
For the PARSEC set (see Fig. 7, left panel), for which Z, we adopted Z=0.025. The luminosity and colour of the RC are well reproduced as are those of the RH and upper MS. In Fig. 5 we show, as an example, the isochrone fit in the theoretical plane which, together with the photometric data, was used to determine the best age, i.e. 1.00.1 Gyr. We note that in the case of the CMD the RC and MS colours of the model are slightly bluer than observations, and this is evident also in the best-fit with the three other isochrones. As mentioned above, this effect may be due to uncertainties in the temperature-colour transformations or to the differences in chemical mixtures between models and observations or, finally, to small systematics in the and photometry that in principle might have a larger impact on colours, of the order of some hundredths of magnitude. Considering, however, that metallicity is fixed by spectroscopy and age by the difference in luminosity between RC and TO, we actually used and photometry to adjust the distance modulus and reddening, and deemed this fit quite satisfying and the small mismatch of the RC colour acceptable. In the case of the BASTI isochrones (Z=0.03), the best-fit is obtained for a younger age of Gyr. The Dartmouth isochrones and the Victoria-Regina isochrones do not include the evolved phases after the RGB for the age of Be 81 and thus the cluster’s parameters for these two models are more loosely constrained. We proceeded by choosing the best-fitting solution as the one that best matches the MS and MSTO morphologies (see Fig. 7, right panel). We used models with [Fe/H]=0.23 for both sets of isochrones. The results obtained with the four sets are given in Table 6, where we indicate age, distance modulus, reddening, distance from the Sun and the Galactocentric distance from the Galactic plane, and mass of the stars at the MSTO. The cluster’s centre coordinates are taken from Donati et al. (2014a): RA=19:01:42.8 and Dec=-0:27:07.7.
Since from spectroscopic analysis it turned out that Be 81 stars show an -enhanced chemical pattern ([/Fe]+0.2, see Section 3.1), we look also at the model predictions when an -enhanced mixture is taken into account. Slightly younger ages are obtained. The results are reported in Table 6.

| Model | age | z | |||||
|---|---|---|---|---|---|---|---|
| (Gyr) | (mag) | (mag) | (kpc) | (kpc) | (pc) | () | |
| PARSEC | 0.1 | 0.1 | 0.02 | 3.50 | 5.45 | -152.18 | 2.2 |
| BASTI | 0.1 | 0.1 | 0.02 | 3.72 | 5.33 | -161.57 | 2.3 |
| BASTIa | 0.1 | 0.1 | 0.02 | 3.55 | 5.42 | -154.30 | 2.3 |
| Dartmouth | 0.15 | 0.1 | 0.04 | 3.50 | 5.45 | -152.18 | 2.2 |
| Dartmoutha | 0.15 | 0.1 | 0.04 | 3.47 | 5.47 | -150.79 | 2.2 |
| Victoria-Regina | 0.15 | 0.1 | 0.04 | 3.50 | 5.42 | -154.30 | 2.3 |
-enhanced models: [/Fe] dex in the case of BASTI (we chose the models with [Fe/H]=0.16 dex, the closest metallicity to the spectroscopic derivation) and [/Fe]=+0.2 dex ([Fe/H]=0.23 dex) in the case of Dartmouth.
4 A comparison with inner disc clusters and field stars
| Name | RA | dec | l | b | Age | RGC(a) | Ref. | |
|---|---|---|---|---|---|---|---|---|
| J2000.0 | deg. | deg. | (Gyr) | (kpc) | ||||
| Be 81 | 19:01:36 | -00:31:00 | 34.505 | -2.07 | 0.85 | 0.980.1 | 5.45 | present work |
| NGC 6705 | 18:51:05 | -06:16:12 | 27.31 | -2.78 | 0.43 | 0.300.05 | 6.3 | idr1, Cantat-Gaudin et al. (2014) |
| Tr 20 | 12:39:32 | -60:37:36 | 301.48 | +2.22 | 0.33 | 1.500.15 | 6.88 | idr1, Donati et al. (2014b) |
| NGC 4815 | 12:57:59 | -64:57:36 | 303.63 | -2.10 | 0.72 | 0.570.07 | 6.9 | idr1, Friel et al. (2014) |
(a) computed with R⊙= 8 kpc.
The large variety of available chemical elements, belonging to different nucleosynthesis channels, allows us to compare, in a fully consistent way, the detailed chemical patterns of open clusters and of field stars observed and analysed homogeneously by the Gaia-ESO Survey. Besides Be 81, three other old/intermediate-age clusters are available in idr2/3. For all of them, namely Tr 20, NGC 6705, and NGC 4815, the stellar parameters, abundances, and radial velocities, were also provided in the first data release, idr1, and analysed in several papers: Donati et al. (2014b) derived membership, age, distance, and reddening of Tr 20; Friel et al. (2014) derived the parameters of NGC 4815 and studied its chemical composition; Cantat-Gaudin et al. (2014) studied the properties of NGC 6705 and searched for possible inhomogeneities in its chemical composition; finally Magrini et al. (2014) searched for unique signatures in the chemical patterns of the three clusters as possible indication of their birthplace. Their CNO abundances have been discussed by Tautvaišienė et al. (2015) using idr2/3 results. Their main parameters are summarised in Table 7.
Here we use the idr2/3 stellar parameters and abundances of NGC 4815, NGC 6705, and Tr 20 to compare their chemical patterns with Be 81 and with field stars. Although shown in Fig. 6, in the following we do not discuss Al and Na in terms of Galactic chemical evolution. They are indeed potentially interesting elements for comparison with the field samples and deduction of the chemical evolution of the inner disc. However, the abundances derived in idr2/3 are all computed in local thermodynamic equilibrium (LTE), and those elements are affected by relevant non-local thermodynamic equilibrium (NLTE) effects. All stars observed with UVES in Be 81 are in the same evolutionary phase (RC), so that the internal dispersion in abundance is not affected by this problem. However, the absolute value of Na and Al abundances and the comparison with stars of different parameters could be unreliable without these corrections. Furthermore, both Na and Al are subject to (extra-)mixing processes in stars of the mass involved here (see, e.g., Charbonnel & Lagarde 2010; Karakas & Lattanzio 2014). These elements will be discussed in a forthcoming paper (Smiljanic et al., in prep) and will not be used.
As is well known, the ratio of -elements to iron, [/Fe], is commonly used to trace the star-formation timescale in a system, because it is sensitive to the ratio of SNII (massive stars) to SNIa (intermediate mass binary systems with mass transfer) that have occurred in the lifetime of the system. However, the so-called -elements, that are generally associated with the explosion of massive stars, do not have exactly the same place of production, and some of them, as Si, Ca, and Ti, have also a significant contribution from SNIa. In addition, there are also differences in the way these elements are produced in massive stars: O and Mg are produced during the hydrostatic He burning, and their yields are not expected to be significantly affected by the SNII explosion conditions, while Si, Ca and Ti are mostly produced during the SNII explosion. This distinction is also seen in the observations (e.g., Fulbright et al. 2007), where Si, Ca and Ti usually track one another, but O and Mg often show different trends with [Fe/H]. The ”pure” -elements (O, Mg) are produced almost entirely by massive stars, and thus in shorter time-scales. In the bulge, the observed Mg overabundances and the general -enhancement agree with the predictions of the chemical evolution models of Matteucci & Brocato (1990) and Grieco et al. (2012) and they are explained with a rapid formation time scale for the bulge. A summary of the place of production and of the contribution of SNII and SNIa is shown in Table 8. The Table is computed using the information given in Woosley et al. (2002) and in Iwamoto et al. (1999, model W7) and summarises the origin of the main isotope of each element.
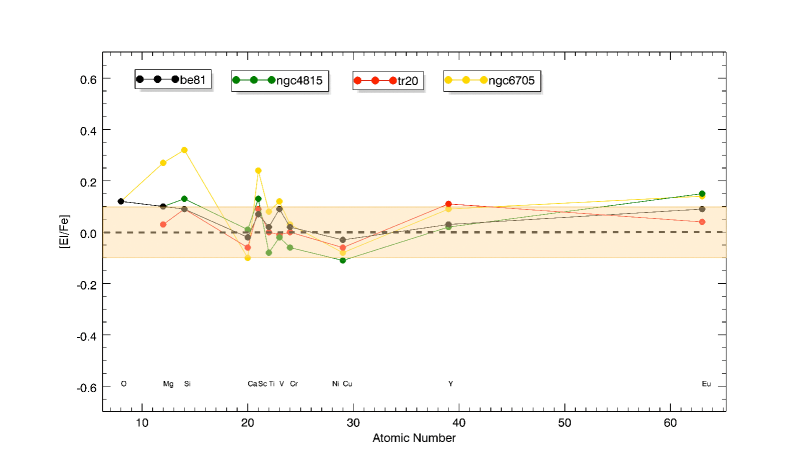
In Figure 9 we show the median [El/Fe] abundance ratios versus the atomic number in the four old/intermediate-age clusters located within 7 kpc from the Galactic Centre, whereas in Figure 10 we show the chemical pattern of the four clusters compared to the median abundance ratios of stars with 0.10[Fe/H]0.33 dex in the solar neighbourhood [382 stars] and in the inner-disc/bulge [42 stars] samples, i.e., embracing the maximum metallicity range of the four clusters within 1-. We have excluded all stars with errors on [Fe/H] larger than 0.15 dex.
In both figures, the available elements include the -elements (O, Mg, Si, Ca, Ti), the refractory elements (Sc, V), the iron-peak elements (Cr, Ni), and the neutron capture elements (Y, Eu). From Fig. 9, we can make some general considerations on the similarities in the chemical patterns of the inner clusters.
Considering the errors that affect the abundance ratios, we define an element as enhanced with respect to Solar if [El/Fe]0.1 dex. Also, we consider that the abundance of an element is globally enhanced in the inner cluster sample if at least three of the four clusters have [El/Fe]0.1 dex for that element.
NGC 6705, NGC 4815, and Be 81 have enhanced abundances of the -elements O, Mg, and Si, with NGC 6705 having the highest abundance ratios of [Mg/Fe] and [Si/Fe] while [O/Fe] does not exceed a 0.1 dex enhancement. The group of elements from Ca to Ni shows Solar abundance and they have similar values in the four clusters. Y and Eu are very similar in all clusters, close to Solar value for [Y/Fe] and slightly super-solar for [Eu/Fe]. From Fig. 10, we find that the chemical pattern of Be 81 is nearly identical to that of inner-disc/bulge stars: both populations show similar -enhancements for the lower atomic number elements (O, Mg, and Si), while Ca, Ti and iron-peak elements, are almost solar. For comparison, the Solar neighbourhood stars in the same metallicity range are plotted: they all have [Mg/Fe], [Si/Fe] and [O/Fe] close to zero.
| Element | Main Production Site | mechanism | yield(SN Ia/SN II) |
|---|---|---|---|
| 16O | Massive Stars | Helium burning | 8% |
| 24Mg | Massive Stars | C, Ne burnings | 10% |
| 28Si | Massive Stars | explosive and non-explosive O burning | 60% |
| 40Ca | Massive Stars | explosive and non-explosive O burning | 67% |
| 45Sc | Massive Stars | C, Ne burnings, and -wind (neutrino-powered wind) | 49% |
| 48Ti | Massive Stars and SNIa | explosive Si burning and SNIa with He detonation | 63% |
| 51V | Massive Stars and SNIa | explosive Si and O burnings, SNIa with He detonation, and and | 88% |
| 52Cr | Massive Stars and SNIa | explosive Si burning, SNIa with He detonation, and | 84% |
| 56Fe | Massive Stars and SNIa | explosive Si burning and SNIa | 88% |
| 58Ni | Massive Stars (and SNIa) | (-rich freeze-out from nuclear statistical equilibrium) and SNIa | 75% |
| 50Y | Massive Stars | He-burning s-process, and -wind | – |
| 153Eu | Massive Stars, compact binary merger | -wind | – |
5 The inner clusters and the disc evolution
For the first time, thanks to the Gaia-ESO Survey, we have at our disposal a significant number of open clusters together with field stars, homogeneously analysed and for which elements from different nucleosynthesis channels are available. They allow us to analyse the typical chemical patterns in different regions of the disc of our Galaxy. Clusters are unique tools because their distances and ages can be derived with great accuracy, allowing reliable placement in space and time in our Galaxy. The family of clusters here described belongs to an important but poorly investigated region of our Galaxy: the inner disc.
There are two main results:
-
1.
As noticed in Magrini et al. (2014), there are ’real’ differences in the abundance patterns of the clusters even if they are located at similar distances from the Galactic centre. One very noticeable difference is the higher -enhancement of NGC 6705, that might suggest an inner birthplace for this cluster, or, as we see in next sections, possibly an episode of local enrichment.
-
2.
Despite the small but ’real’ differences, a common behaviour of the family of old/intermediate-age clusters analysed so far can be seen: they are almost solar in most of the iron-peak and heavy -elements, while they are enhanced in the light -elements O, Mg, and Si. We discuss in the next sections how much this enhancement is real or due to Non-Local Thermodynamical Equilibrium (NLTE) effects.
5.1 Is the -enhancement seen in the inner clusters real?
Three of the clusters of our inner disc sample have [O/Fe], [Si/Fe], and [Mg/Fe]0.1 dex. [Si/Fe] is very high in NGC 6705, while it is around 0.1 dex for the remaining two clusters. First, it is necessary to investigate if the O, Mg, and Si enhancements are real or related to other effects, such as NLTE. All stars analysed in the four clusters are indeed giant stars, and thus NLTE might affect the abundance of some elements. If the NLTE effect is large, the comparison between the giant stars in clusters and the Sun or the Milky Way field solar-neighbourhood dwarf stars can be misleading. We clarify that our ’definition’ of NLTE is totally empirical: in the following we indicate as a ’NLTE effect’ the sum of all un-modelled physics plus potential model biases.
Oxygen. In Be 81, as well as in the other clusters and field stars, oxygen abundance was determined from the forbidden [O I] line at 6300.31 Å, as described in detail by Tautvaišienė et al. (2015). Lines of [O I] are considered as very good indicators of oxygen abundances because they are not only insensitive to NLTE effects, but also give similar oxygen abundance results with 3D and 1D model atmospheres (cf. (Asplund et al. 2004); (Pereira et al. 2009)). Thus, the comparison of giants and dwarfs should not be affected by any such bias.
Magnesium. Mg is less affected than the other -elements by model dependent differences in the yields of SN II with progenitors of different masses. Therefore it constitutes one of the best tracers of the evolutionary timescales of the Galaxy. However, the NLTE effects in Mg are not easily quantifiable. From the theoretical point of view, Merle et al. (2011) computed the Mg I abundance corrections for several lines in the optical interval as functions of atmospheric parameters for cool evolved stars. Their NLTE corrections are computed as a function of stellar parameters and metallicity. At solar metallicity for a star with Teff=5000 K and g=2 the NLTE corrections of different Mg I lines vary from -0.03 to 0.18 dex. From the observational point of view, several works in the literature have analysed dwarf and giant stars in the same cluster to investigate if there is any difference in the abundance ratios related to the type of the star analysed. A study of dwarf and giant stars in the Hyades open cluster (Schuler et al. 2009) showed that Mg abundances are overabundant by 0.2-0.5 dex in the giants relative to the dwarfs. Such large enhancements are not predicted by stellar models, and they explained them as likely due to NLTE effects, significantly larger than those available in the literature. A similar result was obtained by Yong et al. (2005) comparing abundances in dwarf and giant stars in M 67. However, Pasquini et al. (2004) and by Blanco-Cuaresma et al. (2015) found contrary results for the open cluster IC 4651 ([Fe/H] = 0.11).
Silicon. The few studies on its NLTE behaviour indicate strong effects only in low metallicity stars. Recently, Bergemann et al. (2013) found that the effect of NLTE is a reduction of the number densities of atoms in a minority ionisation stage, thus, for a given abundance, the line equivalent width is smaller than that given by LTE. This effect is larger in metal-poor stars. At solar metallicity, the opposite behaviour is encountered, showing negative NLTE effects such that the LTE abundance is higher than the NLTE one.
In order to better investigate the issue for Si and Mg, we test the nature of the -enhancement in our results using the results for one of the Gaia-ESO calibrator open clusters (see Pancino et al. in prep.), M 67. The data for M 67 are, indeed, perfectly suited because they contain stars belonging to different evolutionary phases that have been analysed with the same tools and methods as the inner-disc clusters and field stars of idr2/3.
In Fig. 11, we show [Mg/Fe] and [Si/Fe] vs Teff in member stars of M 67 analysed in idr2/3. The 1- and 2- regions from the average are shown. The sample of stars with T5700 K includes TO, MS, and SG stars. The stars with T5700 K are instead giant stars with g ranging from 2.97 to 3.46. We note that for both elements a slight overabundance in giants is present with respect to TO, MS, and SG stars. The average [Mg/H] for stars with T5700 K is 0.040.02 and for [Si/H] is 0.080.01, while the stars with T5700 K have average values of -0.090.04 and -0.030.03 from [Mg/H] and [Si/H], respectively. We can use these differences to roughly estimate the amount of NLTE effects: 0.13 dex and 0.11 dex for [Mg/H] and [Si/H], respectively. If we consider the abundances with respect to iron, the amount of NLTE effects is 0.12 dex and 0.09 dex for [Mg/Fe] and [Si/Fe], respectively.
It is worth mentioning that M 67 has been used by Önehag et al. (2014) to study the effect of selective atomic diffusion of chemical elements in stars in different evolutionary phases. More specifically, they investigated the detailed chemical composition of 14 stars located on the main sequence, at the turn-off point, and on the early sub-giant branch, finding that the heavy-element abundances are reduced in the TO and main sequence, by typically 0.05 dex, when compared to the abundances of the sub-giants (even lower for ratios of metals). We note that the effect of diffusion in our data is circumscribed in the area.
We finally mention that Blanco-Cuaresma et al. (2015) study the differences in the abundance ratios in cluster giant and dwarf member stars. They show the chemical differences between dwarfs and giants in several clusters, including IC 4651, M 67, NGC 2447, and NGC 3680. They find that, on average, [Mg/Fe] and [Si/Fe] are enhanced in giant stars by 0.06 dex and 0.10 dex with respect to dwarfs. In particular, for M 67, the effect they measured is 0.07 and 0.10 dex in [Mg/Fe] and [Si/Fe], respectively, thus comparable with what we find with Gaia-ESO recommended values.
In conclusion, for oxygen, no NLTE has to be applied, and the three clusters for which this element has been measured show a [O/Fe]0.1 dex. The enhancement in [Mg/Fe] and [Si/Fe] observed in the inner-disc/bulge population and in Be 81, Tr 20, and NGC 4815 with respect to the Solar neighbourhood dwarf population can be related to different evolutionary phases of the observed stars (see Figs.9 and 10). On the other hand, [Mg/Fe] and [Si/Fe] are remarkably higher in NGC 6705 than in the other inner-disc clusters and in the field populations. We can evidently exclude that this enhancement is due solely to NLTE effects. The abundance ratios of NGC 6705 clearly indicate an -enhanced population whose origin needs to be investigated.
5.2 Comparing the inner clusters with high- metal-rich population
Once shown that the enhancements of [O/Fe], [Si/Fe] and [Mg/Fe] in NGC 6705 are genuine, we can try to compare its chemical pattern with those of a population that presents similar chemical characteristics, the high- metal-rich stars (HAMR) with [Fe/H]=0.030.12.
The HAMR stars–whose -enhancement, computed with Mg, Si, and Ti, is in the range 0-0.2 dex– are rare objects in the solar neighbourhood, and their exact nature is still under debate. Adibekyan et al. (2011) identified these stars and suggested that they may form a distinct family, based on a “gap” in metallicity between HAMR and classical thick disc stars. Other authors also confirmed the existence of the -enhanced metal-rich stars but with different conclusions on their origin (e.g. Gazzano et al. 2013; Nissen et al. 2014; Bensby et al. 2014; Adibekyan et al. 2014). A comparison of the main physical properties of HAMR stars with those from the simulations of Roškar et al. (2012) suggests that the HAMR stars might have their origin in the central part of the Galaxy, within about 2 kpc (Adibekyan et al. 2013). Looking at Figs. 9 and 10, one would claim that stars in Be 81 and in the inner-disc clusters are similar to the -enhanced metal-rich stars discovered in the solar neighbourhood. They have indeed solar or super solar [Fe/H] (see Magrini et al. 2014, and Table 4 for Be 81) and they are, in general, enhanced in the light -elements, as O, Mg, and Si. At a first glance, the chemical patterns of Be 81 shown in Fig. 9 pretty much resemble the metal rich -enhanced population identified in the solar neighbourhood. Note that HAMR stars studied by Adibekyan et al. (2011) have T 4900 K and only 5 stars have g3.8 dex, therefore their sample is essentially composed of dwarf stars. If confirmed, the existence of HAMR stars in an open cluster at 5-7 kpc from the Galactic Centre, might put important constraints on the stellar migration and in the birthplace of HAMR stars.
However, we should consider that there are important differences between HAMR stars and the inner disc clusters. First, there is a large difference in age between the two populations. The age of HAMR stars in the solar neighbourhood is not precisely determined. However, they are on average believed to be quite old. Adibekyan et al. (2011) showed that the HAMR and thick disc family stars have almost the same age, being on average older than thin disc stars by about 3 Gyr. At the same time, they found that HAMR stars are quite different from the thick disc stars being more metal-rich and with different chemical patterns. They also show properties in common with metal-rich bulge stars (e.g., Fulbright et al. 2007; Bensby et al. 2014; Ness et al. 2013). On the other hand, the age and distance of NGC 6705 are well known by isochrone fitting (see Table 7), and it is much younger.
Second, in a ’classical’ chemical evolution view of the Milky Way disc (e.g. Tosi 1988; Matteucci & Francois 1989; Chiappini et al. 1997, 2000; Portinari et al. 1998; Boissier & Prantzos 1999) we do not expect that relatively young stars born in the inner disc to show an -enhancement. It is instructive to use a recent and simple chemical evolution model that does not include the effect of radial migration to study the most likely birthplace of the HAMR stars. In Fig. 12 we show a plot of [Fe/H] and [/Fe] vs. RGC in the chemical evolution model of Magrini et al. (2009). The three curves show the prediction for [Fe/H] and [/Fe] as a function of RGC at present, 5 Gyr ago and 10 Gyr ago. The model predicts that the formation of a family of -enhanced metal-rich stars is very limited in space and in time. They formed in the inner part of the disc and during the first epochs of disc formation (black curve), then the contribution of SNIa decreased the [/Fe] ratio to solar values. Thus, further stellar populations have higher [Fe/H] but lower [/Fe] than the oldest ones. Similar results can be obtained even with more sophisticated models, as those by Minchev et al. (2013), where the combination of high [/Fe] and young ages is not predicted. For instance, in Figure 2 of Minchev et al. (2013), stars with [O/Fe]=0.2 are older than 7 Gyr, whatever their birth location. Stars with slightly smaller [O/Fe] can be younger at the condition that they are born in the very outer disc, but then they would be metal poor.
We plot also [Fe/H] and [/Fe] for the four clusters and for the solar neighbourhood and inner-disc samples in the same metallicity range of the clusters. We compute [/Fe] considering [O/Fe], [Mg/Fe] and [Si/Fe]–the latter two corrected for the NLTE effects. For the field populations we assumed a distance of 81 kpc for the Solar neighbourhood stars, and of 52 kpc for the inner-disc sample. The uncertainties on the x-axes reflect their interval of distances.
The four clusters are in good agreement with the model prediction in the [Fe/H] vs. RGC plane, however in the [/Fe] vs. RGC plane NGC 6705 is displaced with respect to what is expected for its age. Stars with the age of 0.3 Gyr, indeed, should have solar or sub-solar [/Fe] given their age and place of birth (blue curve of Fig. 12) and thus their -enhancement is totally unexpected. Also the location of Be 81 is a bit surprising: as we discussed above, this cluster does not have a high [/Fe] ‘per se’. However, if we consider its [/Fe] in conjunction with its [Fe/H], we find it a bit higher than expected. On the other hand, [/Fe] in Tr 20 and NGC 4815 are consistent, within the errors, with the model curves (in between red and blue curve of Fig. 12).
Therefore, the stars in NGC 4815 and Tr 20 have a [/Fe] that is fully consistent with their age and location in the disc as indicated by the predictions of the chemical evolution model of Magrini et al. (2009). Be 81 has a slightly higher [/Fe] than expected for its [Fe/H] and RGC, However, the most striking case is that of NGC 6705, which shows a genuine enhancement [/Fe] unlikely related to the HAMR stellar population in the solar neighbourhood, since they were born in a completely different epoch. Due to the young age of NGC 6705, its -enhancement cannot be simply explained by disc chemical evolution, and also the hypothesis of Magrini et al. (2014) of radial migration from the inner disc is unlikely due to the young age of this cluster.
Very recently, several studies revealed the presence of relatively young -enhanced stars. Chiappini et al. (2015) report the discovery of a group of apparently young CoRoT red-giant stars exhibiting enhanced [/Fe] abundance ratios. These stars are more numerous in their inner-disc sample. Also Martig et al. (2014) analysing a sample of giants with seismic parameters from Kepler found a small percentage of stars with [/Fe]0.2 dex and ages below 4 Gyr. As in the case of our inner disc clusters, the existence of this kind of star cannot be explained in the framework of standard chemical evolution models of the Milky Way. Their presence might indicate that the chemical-enrichment history of the Galactic disc is more complex. Chiappini et al. (2015) analyse some possible interpretations of the nature of these stars: i) they might have been formed close to the end of the Galactic bar, near co-rotation where gas stays inert for longer times and where the mass return from older inner-disc stellar generations is expected to be highest with the net effect of in-situ gas dilution; ii) they might originate from a recent gas-accretion event. However, there is a substantial difference between the stars discussed in Chiappini et al. (2015) and the inner-disc open clusters: Chiappini’s stars tend to be more metal poor than our clusters, with [Fe/H] ranging from 0.6 to 0.1 dex, and they are on average older (4 Gyr). Might the inner-disc open cluster be a younger tail of the ”young’ metal poor -enhanced population? Is the high [/Fe] of both populations related to their place of birth, near to co-rotation?
In the next section, we try to estimate another possibility: the effect of a very local enrichment in the molecular cloud from which NGC 6705 was born to explain its chemical pattern.
5.3 The local enrichment hypothesis: the effect of a supernova explosion
Can a single SNII explosion explain the chemical pattern of NGC 6705 with its high [/Fe]? Using Gaia-ESO data, Bergemann et al. (2014) found a large scatter of [Fe/H] and [Mg/Fe] of stars at each age towards the inner disc. Malinie et al. (1993) explained the observed scatter at each Galactocentric radius and age as due to the fact that the disc contains chemical inhomogeneities that can avoid remixing long enough. This allows the activation of the star formation process in both enriched and unenriched portions, with typical timescales of 108-109 yr. Gilmore et al. (1990) suggested that the scatter could be a consequence of self-enrichment in giant molecular cloud complexes. Their lifetime is short compared to the time scale of Galactic evolution, but much larger than the lifetime of the massive stars. Therefore, self-enrichment could occur inside a giant molecular cloud, and after the disruption of the cloud the metallicity inhomogeneity survives. It spreads only through a Galactic annulus, but it can be easily detected if the cluster formed from the molecular cloud is still observable.
Starting from the assumption that the interstellar medium from which NGC 6705 was born had a mass comparable to its present time mass (3500 M⊙, Cantat-Gaudin et al. 2014), we compute the enrichment due to the explosion of a massive star of 15, 18 or 25 M⊙ (yields from Woosley & Weaver (1995)) in the hypothesis of a uniform and instantaneous recycling of the medium. The enrichment has been computed assuming Solar initial composition (Grevesse et al. 2007).
In Table 9, we present the results of this calculation: the explosion of a massive star with a mass 15-18 M⊙ might be able to explain the local enrichment of NGC 6705. The yields of Woosley & Weaver (1995) can also explain the higher enrichment in [Si/Fe] with respect to the other elements. The hypothesis of local enrichment is supported also by Roy & Kunth (1995) where characteristic timescales for homogenisation are short, 106-108 yr on scales of 100-1000 pc. The number of stars with a mass in the range 15-18 M⊙ computed with the initial mass function of Cantat-Gaudin et al. (2014) in the whole area of the cluster is about 2. Given the present total mass of NGC 6705, the expected number of stars with 15 MMM⊙ is thus consistent with an early enrichment by one or more type II supernovae with such massive progenitors. However, the hypothesis that the SN was a cluster member implies at least three assumptions; namely, i) a prolonged star formation (at least 107 Myr : timescales of SNII with progenitors of 15 MMM⊙), where massive stars have formed first and have enriched the medium from which the lower mass stars have subsequently formed; ii) that the explosion of the SN has not dissipated the gas from which the low mass stars have formed; iii) that no low mass stars have formed from the pristine (not yet enriched) gas, or that those stars have escaped the clusters. Similar problems are faced also in globular cluster formation and in their self-enrichment.
| Mass | [O/Fe] | [Mg/Fe] | [Si/Fe] |
|---|---|---|---|
| (M⊙) | |||
| 15 | 0.09 | 0.03 | 0.23 |
| 18 | 0.16 | 0.09 | 0.27 |
| 25 | 0.39 | 0.19 | 0.49 |
6 Summary and conclusions
We analyse the Gaia-ESO results (idr2/3) for four inner disc clusters, including the old cluster Be 81 which has not been studied in the Gaia-ESO survey so far. Using the improvements obtained in the metallicity measurement and the membership with RV determinations, we derive age, distance, and average reddening of Be 81 by using the classical approach of isochrone fitting. The best-fit isochrone gives an age of 1 Gyr, a reddening 0.83 and a Galactocentric distance of 5.45 kpc. We compare the chemical pattern of Be 81 and of the other three old open clusters of idr2/3 with the solar-neighbourhood and inner-disc/bulge stars. We find that the inner-disc/bulge giant stars and three open clusters show an enhancement in the light -elements (O, Si, Mg). We use the calibrator cluster M 67 to infer how much of this enhancement is related to NLTE effects, finding that the enhancement of [Mg/Fe] and [Si/Fe] in giants with respect to dwarfs is 0.10 dex. Applying these empirical NLTE corrections to the chemical patterns of open clusters, we find that Tr 20, NGC 4815, and Be 81 do not show any remarkable -enhancement. On the other hand, NGC 6705 still shows an uncommon pattern, with a significant -enhancement. We compare the cluster [/Fe] with those of the HAMR stars, finding that they belong to very different epochs of the lifetime of the Galaxy. We relate them also to the recently discovered population of young (age4 Gyr) and -enhanced stars ((Martig et al. 2014), (Chiappini et al. 2015)) mainly located towards the Galactic Centre. The inner-disc clusters, with ages between 0.3 to 1.5 Gyr, and the ”young” -enhanced stars might belong to an evolutionary sequence of the same population, born in the inner part of the disc. The common chemical features of some of the clusters with the ”young” -enhanced stars might indicate peculiar conditions for the star formation near to the co-rotation. In our discussion, we also tentatively explain the very high [O/Fe], [Mg/Fe], and [Si/Fe] in NGC 6705 with an episode of local enrichment due to a type II supernova in the mass range 15-18 M⊙, as, e.g., contemplated by Malinie et al. (1993) to explain the observed inhomogeneities at each Galactocentric radius.
Acknowledgements.
The Authors thank an anonymous referee whose comments and suggestions improved the quality of the paper. The results presented here benefited from discussions in three Gaia-ESO workshops supported by the ESF (European Science Foundation) through the GREAT (Gaia Research for European Astronomy Training) Research Network Program (Science meetings 3855, 4127 and 4415). This work was partially supported by the Gaia Research for European Astronomy Training (GREAT-ITN) Marie Curie network, funded through the European Union Seventh Framework Programme [FP7/2007-2013] under grant agreement n. 264895. We acknowledge the support from INAF and Ministero dell’Istruzione, dell’Universitá e della Ricerca (MIUR) in the form of the grant ”Premiale VLT 2012” and The Chemical and Dynamical Evolution of the Milky Way and Local Group Galaxies (prot. 2010LY5N2T). V.A. acknowledges the support from the Fundação para a Ciência e a Tecnologia, FCT (Portugal) in the form of the fellowship SFRH/BPD/70574/2010. S.V. gratefully acknowledges the support provided by Fondecyt. reg. 1130721. T.B. was supported by the project grant “The New Milky” from the Knut and Alice Wallenberg foundation. U.H. acknowledges support from the Swedish National Space Board (SNSB/Rymdstyrelsen). G.T. acknowledges the support from the Research Council of Lithuania (grant No. MIP-082/2015). This research has made use of the SIMBAD database, operated at CDS, Strasbourg, France.References
- Adibekyan et al. (2011) Adibekyan, V. Z., Santos, N. C., Sousa, S. G., & Israelian, G. 2011, A&A, 535, LL11
- Adibekyan et al. (2013) Adibekyan, V. Z., Figueira, P., Santos, N. C., et al. 2013, A&A, 554, AA44
- Adibekyan et al. (2014) Adibekyan, V. Z., González Hernández, J. I., Delgado Mena, E., et al. 2014, A&A, 564, LL15
- Asplund et al. (2004) Asplund, M., Grevesse, N., Sauval, A. J., Allende Prieto, C., & Kiselman, D. 2004, A&A, 417, 751
- Bensby et al. (2014) Bensby, T., Feltzing, S., & Oey, M. S. 2014, A&A, 562, AA71
- Bergemann et al. (2013) Bergemann, M., Kudritzki, R.-P., Würl, M., et al. 2013, ApJ, 764, 115
- Bergemann et al. (2014) Bergemann, M., Ruchti, G. R., Serenelli, A., et al. 2014, A&A, 565, AA89
- Bertran de Lis et al. (2015) Bertran de Lis, S., Delgado Mena, E., Adibekyan, V. Z., Santos, N. C., & Sousa, S. G. 2015, arXiv:1501.05805
- Blanco-Cuaresma et al. (2015) Blanco-Cuaresma, S., Soubiran, C., Heiter, U., et al. 2015, arXiv:1503.02082
- Boissier & Prantzos (1999) Boissier, S., & Prantzos, N. 1999, MNRAS, 307, 857
- Bragaglia & Tosi (2006) Bragaglia, A., & Tosi, M. 2006, AJ, 131, 1544
- Bressan et al. (2012) Bressan, A., Marigo, P., Girardi, L., et al. 2012, MNRAS, 427, 12739
- Cantat-Gaudin et al. (2014) Cantat-Gaudin, T., Vallenari, A., Zaggia, S., et al. 2014, A&A, 569, AA17
- Cardelli et al. (1989) Cardelli, J. A., Clayton, G. C., & Mathis, J. S. 1989, ApJ, 345, 245
- Carraro et al. (2014a) Carraro, G., Monaco, L., & Villanova, S. 2014a, A&A, 568, AA86
- Carraro et al. (2014b) Carraro, G., Giorgi, E. E., Costa, E., & Vázquez, R. A. 2014b, MNRAS, 441, L36
- Carraro et al. (2014c) Carraro, G., Villanova, S., Monaco, L., et al. 2014c, A&A, 562, AA39
- Carretta et al. (2007) Carretta, E., Bragaglia, A., & Gratton, R. G. 2007, A&A, 473, 129
- Carretta et al. (2005) Carretta, E., Bragaglia, A., Gratton, R. G., & Tosi, M. 2005, A&A, 441, 131
- Charbonnel & Lagarde (2010) Charbonnel, C., & Lagarde, N. 2010, A&A, 522, AA10
- Chiappini et al. (1997) Chiappini, C., Matteucci, F., & Gratton, R. 1997, ApJ, 477, 765
- Chiappini et al. (2000) Chiappini, C., Matteucci, F., & Padoan, P. 2000, ApJ, 528, 711
- Chiappini et al. (2015) Chiappini, C., Anders, F., Rodrigues, T. S., et al. 2015, arXiv:1503.06990
- Damiani et al. (2014) Damiani, F., Prisinzano, L., Micela, G., et al. 2014, A&A, 566, AA50
- Donati et al. (2014a) Donati, P., Beccari, G., Bragaglia, A., Cignoni, M., & Tosi, M. 2014a, MNRAS, 437, 1241
- Donati et al. (2014b) Donati, P., Cantat Gaudin, T., Bragaglia, A., et al. 2014b, A&A, 561, AA94
- Dotter et al. (2008) Dotter, A., Chaboyer, B., Jevremović, D., et al. 2008, ApJS, 178, 89
- Freeman (1970) Freeman, K. C. 1970, ApJ, 160, 811
- Friel (1995) Friel, E. D. 1995, ARA&A, 33, 381
- Friel et al. (2014) Friel, E. D., Donati, P., Bragaglia, A., et al. 2014, A&A, 563, AA117
- Fulbright et al. (2007) Fulbright, J. P., McWilliam, A., & Rich, R. M. 2007, ApJ, 661, 1152
- Gazzano et al. (2013) Gazzano, J.-C., Kordopatis, G., Deleuil, M., et al. 2013, A&A, 550, AA125
- Gilmore et al. (1990) Gilmore, G., King, I. R., van der Kruit, P. C., & Buser, R. 1990, Science, 250, 703
- Gilmore et al. (2012) Gilmore, G., Randich, S., Asplund, M., et al. 2012, The Messenger, 147, 25
- Grevesse et al. (2007) Grevesse, N., Asplund, M., & Sauval, A. J. 2007, Space Sci. Rev., 130, 105
- Grieco et al. (2012) Grieco, V., Matteucci, F., Pipino, A., & Cescutti, G. 2012, A&A, 548, AA60
- Hayes & Friel (2014) Hayes, C. R., & Friel, E. D. 2014, AJ, 147, 69
- Karakas & Lattanzio (2014) Karakas, A. I., & Lattanzio, J. C. 2014, PASA, 31, e030
- Iwamoto et al. (1999) Iwamoto, K., Brachwitz, F., Nomoto, K., et al. 1999, ApJS, 125, 439
- Magrini et al. (2009) Magrini, L., Sestito, P., Randich, S., & Galli, D. 2009, A&A, 494, 95
- Magrini et al. (2010) Magrini, L., Randich, S., Zoccali, M., et al. 2010, A&A, 523, A11
- Magrini et al. (2014) Magrini, L., Randich, S., Romano, D., et al. 2014, A&A, 563, AA44
- Malinie et al. (1993) Malinie, G., Hartmann, D. H., Clayton, D. D., & Mathews, G. J. 1993, ApJ, 413, 633
- Martig et al. (2014) Martig, M., Rix, H.-W., Silva Aguirre, V., et al. 2014, arXiv:1412.3453
- Matteucci & Brocato (1990) Matteucci, F., & Brocato, E. 1990, ApJ, 365, 539
- Matteucci & Francois (1989) Matteucci, F., & Francois, P. 1989, MNRAS, 239, 885
- Malkin (2013) Malkin, Z. 2013, IAU Symposium, 289, 406
- Merle et al. (2011) Merle, T., Thévenin, F., Pichon, B., & Bigot, L. 2011, MNRAS, 418, 863
- Minchev et al. (2013) Minchev, I., Chiappini, C., & Martig, M. 2013, A&A, 558, AA9
- Ness et al. (2013) Ness, M., Freeman, K., Athanassoula, E., et al. 2013, MNRAS, 432, 2092
- Nissen et al. (2014) Nissen, P. E., Chen, Y. Q., Carigi, L., Schuster, W. J., & Zhao, G. 2014, A&A, 568, AA25
- O’Donnell (1994) O’Donnell, J. E. 1994, ApJ, 422, 158
- Önehag et al. (2014) Önehag, A., Gustafsson, B., & Korn, A. 2014, A&A, 562, AA102
- Pasquini et al. (2004) Pasquini, L., Randich, S., Zoccali, M., et al. 2004, A&A, 424, 951
- Pereira et al. (2009) Pereira, T. M. D., Asplund, M., & Kiselman, D. 2009, A&A, 508, 1403
- Pietrinferni et al. (2004) Pietrinferni, A., Cassisi, S., Salaris, M., & Castelli, F. 2004, ApJ, 612, 168
- Randich et al. (2013) Randich, S., Gilmore, G., & Gaia-ESO Consortium 2013, The Messenger, 154, 47
- Portinari et al. (1998) Portinari, L., Chiosi, C., & Bressan, A. 1998, A&A, 334, 505
- Roškar et al. (2012) Roškar, R., Debattista, V. P., Quinn, T. R., & Wadsley, J. 2012, MNRAS, 426, 2089
- Roy & Kunth (1995) Roy, J.-R., & Kunth, D. 1995, A&A, 294, 432
- Sestito et al. (2007) Sestito, P., Randich, S., & Bragaglia, A. 2007, A&A, 465, 185
- Sestito et al. (2008) Sestito, P., Bragaglia, A., Randich, S., et al. 2008, A&A, 488, 943
- Sacco et al. (2014) Sacco, G. G., Morbidelli, L., Franciosini, E., et al. 2014, A&A, 565, AA113
- Sagar & Griffiths (1998) Sagar, R., & Griffiths, W. K. 1998, MNRAS, 299, 1
- Salpeter (1955) Salpeter, E. E. 1955, ApJ, 121, 161
- Schuler et al. (2009) Schuler, S. C., King, J. R., & The, L.-S. 2009, ApJ, 701, 837
- Smiljanic et al. (2014) Smiljanic, R., Korn, A. J., Bergemann, M., et al. 2014, A&A, 570, AA122
- Tautvaišienė et al. (2015) Tautvaišienė, G., Drazdauskas, A., Mikolaitis, Š., et al. 2015, A&A, 573, AA55
- Tosi (1988) Tosi, M. 1988, A&A, 197, 33
- VandenBerg et al. (2006) VandenBerg, D. A., Bergbusch, P. A., & Dowler, P. D. 2006, ApJS, 162, 375
- van der Kruit (2002) van der Kruit, P. C. 2002, The Dynamics, Structure and History of Galaxies: A Workshop in Honour of Professor Ken Freeman, 273, 7
- Warren & Cole (2009) Warren, S. R., & Cole, A. A. 2009, MNRAS, 393, 272
- Woosley et al. (2002) Woosley, S. E., Heger, A., & Weaver, T. A. 2002, Reviews of Modern Physics, 74, 1015
- Woosley & Weaver (1995) Woosley, S. E., & Weaver, T. A. 1995, ApJS, 101, 181
- Yong et al. (2005) Yong, D., Carney, B. W., & Teixera de Almeida, M. L. 2005, AJ, 130, 597
- Yong et al. (2012) Yong, D., Carney, B. W., & Friel, E. D. 2012, AJ, 144, 95