Multiple magnetic transitions in the spin- chain antiferromagnet SrCuTe2O6
Abstract
Using thermodynamic measurements and density-functional band-structure calculations, we explore magnetic behavior of SrCuTe2O6. Despite being a structural sibling of a three-dimensional frustrated system PbCuTe2O6, this spin- quantum magnet shows remarkably different low-temperature behavior. Above 7 K, magnetic susceptibility of SrCuTe2O6 follows the spin-chain model with the antiferromagnetic intrachain coupling of K. We ascribe this quasi-one-dimensional behavior to the leading third-neighbor coupling that involves a weakly bent Cu–OO–Cu superexchange pathway with a short OO contact of 2.79 Å. Below 5 K, SrCuTe2O6 undergoes two consecutive magnetic transitions that may be triggered by the frustrated nature of interchain couplings. Field dependence of the magnetic transitions (phase diagram) is reported.
pacs:
75.50.Ee, 71.20.Ps, 75.10.Pq, 75.30.Kz, 75.30.Et, 75.10.JmI Introduction
Geometrically frustrated magnets are difficult to construct.Ramirez (1994); Greedan (2001) Their exotic properties rely on the fact that antiferromagnetic (AFM) couplings on a triangular loop are equal, as in the ideal kagome, hyperkagome, or pyrochlore spin lattices.Moessner and Ramirez (2006); Balents (2010) Geometrical distortions render magnetic couplings nonequivalent, thus alleviating the frustration, lifting the classical degeneracy and eventually stabilizing conventional ordered ground states. Materials featuring high crystallography symmetry and triangular-like structural features are indispensable for the field of frustrated magnetism, because multiple symmetry elements of the crystal structure ensure that the couplings on different bonds of the triangular loop are equal, and the strong magnetic frustration persists. Real-world examples of such systems are particularly rare for the case of spin-,Mendels and Bert (2010); Okamoto et al. (2007); Dally et al. (2014) where strongest quantum effects and, hence, the ultimate elimination of conventional ordered ground states is expected.
Recently, Koteswararao et al.Koteswararao et al. (2014) reported synthesis and magnetic behavior of PbCuTe2O6. This cubic material entails a hyperkagome network of Cu2+ spins connected by the second-neighbor AFM coupling. However, first-neighbor couplings forming isolated triangles and third-neighbor couplings forming spin chains are present as well, thus rendering the spin lattice highly complex. Experimental results put forward an overall AFM behavior with the Curie-Weiss temperature of 22 K, yet neither a broad maximum of the susceptibility nor a long-range ordering transition are seen above 1.2 K. Around 0.87 K, a kink in the heat capacity indicates a magnetic transition of unknown origin.
Here, we explore magnetic behavior of SrCuTe2O6,Wulff and Müller-Buschbaum (1997) which is isostructural to PbCuTe2O6.Koteswararao et al. (2014) Both Pb and Sr compounds share the same crystallographic symmetry and feature very similar lattice parameters of 12.47 Å and 12.49 Å, respectively.Wulff and Müller-Buschbaum (1997); Koteswararao et al. (2014) Given the fact that neither Sr nor Pb are directly involved in superexchange pathways, little difference between the two compounds could be envisaged. Surprisingly, we find that SrCuTe2O6 is largely dissimilar to its Pb analog and exhibits quasi-one-dimensional magnetism, which is rationalized microscopically by the dominant third-neighbor exchange. At low temperatures, two consecutive magnetic transitions are observed in zero field, and altogether three distinct phase are established in applied magnetic fields up to 9 T. They may be related to the frustrated nature of interchain couplings.
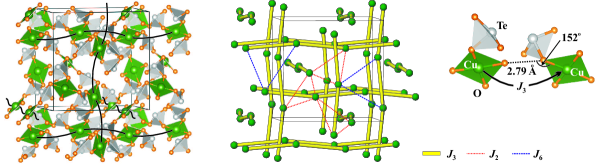
The common crystal structure of SrCuTe2O6 and PbCuTe2O6 is shown in Fig. 1. It is formed by CuO4 plaquettes and TeO3 trigonal pyramids that can be alternatively viewed as TeO3E pyramids with the lone pair E occupying one of the vertices. The lone pair originates from the electronic configuration of Te4+ and triggers a pronounced asymmetry of the Te coordination environment. The crystal structure is non-centrosymmetric, and the magnetic Cu2+ ions take the Wyckoff position on the two-fold rotation axis passing along face diagonal of the cubic unit cell.
II Methods
Synthesis of SrCuTe2O6 was purely accidental. In an attempt to synthesize the polycrystalline sample of SrCuTe2O7 by the solid-state reaction method,Yeon et al. (2011) SrCO3 (Aldrich, 99.995%), CuO (Aldrich, 99.9999%), TeO2 (Aldrich, 99.9995%), and H2TeOH2O (Alfa Aesar, 99%) were taken as initial reactants. These initial reactants were ground thoroughly in stoichiometric ratios and fired at 630 ∘C for three days in flowing argon atmosphere with two intermediate grindings. The x-ray powder diffraction (XRD) pattern was recorded at room temperature using PANalytical powder diffractometer (CuKα radiation, Å). The final product was phase-pure SrCuTe2O6 instead of SrCuTe2O7. The loss of oxygen is, presumably, related to reducing synthesis conditions, whereas annealings in air may be required to synthesize SrCuTe2O7.
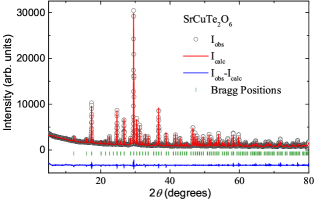
Le Bail fit of the powder XRD data was performed using FullProf software package.Rodríguez-Carvajal (1993) All peaks are consistent with the cubic structure and space group 4132 (No. 213). Figure 2 displays the powder XRD data along with the fit. The initial structural parameters were taken from Ref. Wulff and Müller-Buschbaum, 1997. The best fit was obtained with a goodness-of-fit, . The refined lattice parameters are Å, which are consistent with the previous report.Wulff and Müller-Buschbaum (1997)
Magnetization () measurements were performed as a function of temperature and magnetic field using vibrating sample magnetometer (VSM) attachment to the Physical Property Measurement System (PPMS, Quantum Design). Heat capacity data were measured with a heat capacity attachment to PPMS as a function of and on a sintered pellet using the relaxation technique.
Density-functional (DFT) band structure calculations were performed using the FPLO codeKoepernik and Eschrig (1999) and generalized gradient approximation (GGA)Perdew et al. (1996) for the exchange-correlation potential. Strong correlation effects in the Cu shell were taken into account by including a mean-field GGA+ correction with the Hubbard repulsion parameter eV and Hund’s coupling eV.Mazurenko et al. (2014); Nath et al. (2014a) All calculations were performed for the crystallographic unit cell with 120 atoms. Reciprocal space was sampled by 20 k-points in the symmetry-irreducible part of the first Brillouin zone. This sampling is already sufficient for a decent convergence of total energies and ensuing magnetic couplings, given the huge size of the unit cell in the direct space.
III Results
III.1 Magnetization
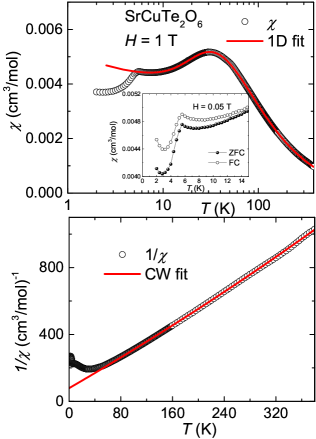
The magnetic susceptibility () measured in the temperature range K and in an applied magnetic field () of 1 T is shown in the upper panel of Fig. 3. It follows a Curie-Weiss (CW) behavior at high temperatures, as expected in the paramagnetic regime, and passes through a broad maximum at around K. This broad maximum is a hallmark of short-range-order anticipated for low-dimensional (AFM) spin systems. Its position in temperature is a measure of the exchange energy.Bonner and Fisher (1964); Eggert et al. (1994); Johnston et al. (2000) With decreasing temperature, a sharp peak is observed at K suggesting a transition toward long-range magnetic order (LRO). At very low temperatures, is increasing slightly, which is likely due to some extrinsic paramagnetic impurities or defect/dislocations present in the powder sample.
The high-temperature data were analyzed by fitting with the following expression:
| (1) |
where is the temperature-independent susceptibility including contributions of core diamagnetism and Van-Vleck paramagnetism, and the second term is the CW law with being the Curie constant and the characteristic Curie-Weiss temperature.
Our fit above 150 K (lower panel of Fig. 3) yields cm3/mol, cm3 K/mol, and K. From the value of , the effective moment () was calculated to be where is Avogadro’s number and is the Boltzmann constant. This effective moment is comparable to the spin-only value of for Cu2+ () assuming . Given the fact that the experimental moment is above the spin-only value, we anticipate , which is in the typical range for Cu2+ compounds.Nath et al. (2014a) The core diamagnetic susceptibility () of SrCuTe2O6 was calculated to be cm3/mol by adding the of the individual ions Sr2+, Cu2+, Te4+, and O2-.Selwood (1956) The Van-Vleck paramagnetic susceptibility () was calculated by subtracting from to be cm3/mol. This value of is comparable with other cuprate compounds, like Sr2CuO3,Motoyama et al. (1996) Sr2CuP2O8,Nath et al. (2005) PbCuTe2O6,Koteswararao et al. (2014) and PbCu3TeO7.Koteswararao et al. (2013) The positive value of suggests that the dominant exchange interactions between Cu2+ ions are AFM in nature.
As shown in Fig. 3, reveals a pronounced maximum at K suggesting that the spins in SrCuTe2O6 form a short-range order before entering the LRO state. Such a susceptibility maximum is expected for a variety of (mostly low-dimensional) spin models. Here, we refer to the simplest possible case of a uniform spin chain. Apart from providing an excellent fit of the experimental data, the chain model is well justified by the microscopic analysis presented in Sec. III.3 below.
To fit the bulk data, we decomposed into three components
| (2) |
where the second term is the CW law that takes into account the impurity contribution. gives information about the impurity concentration, provides an effective interaction between impurity spins, and is the expression for spin susceptibility of uniform one-dimensional (1D) Heisenberg spin- AFM chain given by Johnston et al.Johnston et al. (2000) This expression is valid over a wide temperature range. The fit of data above 7 K () by Eq. (2) is shown in the upper panel of Fig. 3. The best fit down to 7 K, where the LRO transition is approached, was obtained with the parameters cm3/mol, = 0.0034(1) cm3K/mol, imp = 1.49(3) K, = 2.156(1), and = 49.34(1) K. The low value of suggests a weak interaction among the impurity spins. Similarly, the obtained value of corresponds to of 0.74% impurity spins assuming that they have spin- nature.
Zero-field cooled (ZFC) and field-cooled (FC) susceptibilities as a function of temperature measured in the magnetic field of 0.05 T are shown in the inset of Fig. 3. Both curves showed a sharp peak at 5.5 K without any significant splitting divergence, thus ruling out the possibility of a spin-freezing/spin-glass transition at low temperatures.
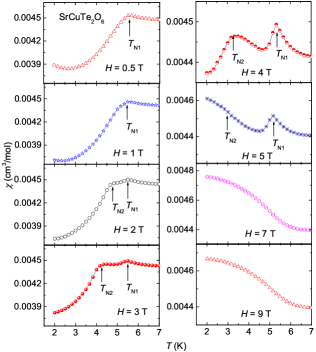
In order to probe the magnetic transition, was measured at different applied fields in the low-temperature regime (Fig. 4). At = 0.5 T, it shows a clear peak at 5.5 K. With increasing , the peak was found to broaden. At T, this broad peak transforms into two peaks at 5.5 K and 4.7 K. With further increase in , the position of remains almost unchanged, while the feature at moves to lower temperatures and broadens substantially. At = 5 T, the trend below changes, and the susceptibility increases toward low temperatures, as in the spin-flop phase of more conventional Cu2+ antiferromagnets.Janson et al. (2011) For 6 T, the feature at disappears completely, whereas the feature at turns into a bend of the susceptibility curve that is reminiscent of the magnetic transition in canted antiferromagnets. We also tried to detect magnetic transitions by plotting , but no extra features could be seen there.
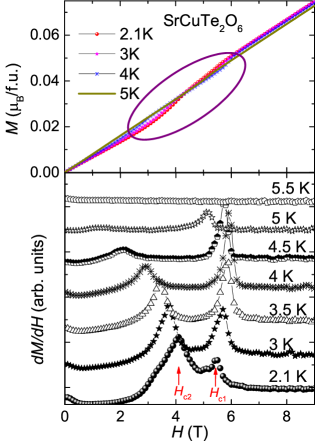
In order to gain additional insight into the nature of magnetic transitions observed in , we measured magnetization isotherms at different temperatures. In polycrystalline samples, spin-flop transition manifests itself by kinks of magnetization curves. Indeed, in our case, we observed such kinks in the magnetization isotherms measured at 5 K (Fig. 5, upper panel). Transition fields are determined from field derivatives of the magnetization curves plotted in the lower panel of Fig. 5. At = 2.1 K, two clear peaks are observed at the critical fields marked as and . As we increase the temperature, moves rapidly towards lower magnetic fields, whereas increases slightly till K, where it starts decreasing and then disappears completely for K, the temperature that nearly coincides with . On the other hand, the temperature evolution of is clearly reminiscent of the field evolution of (see also Fig. 4).
III.2 Heat capacity
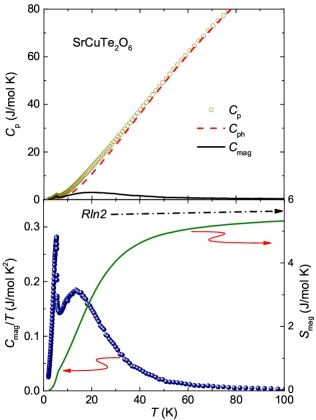
In magnetic insulators, has two principal contributions: phononic part and magnetic part. Figure. 6 shows the heat capacity as a function of temperature measured in zero field. At high temperatures, it is completely dominated by the phonon contributions and then shows a lambda-type anomaly at 5.4 K followed by a bend in the vicinity of . To obtain the phononic part of the heat capacity (), the raw data at high temperatures were fitted by a linear combination of five Debye functions:Nath et al. (2008); *Nath2008a
| (3) |
Here, is the universal gas constant, the coefficients represent groups of distinct atoms in the crystal, and are the corresponding Debye temperatures. The magnetic part of the heat capacity () was obtained by subtracting from the total heat capacity . The subtraction procedure was verified by calculating the magnetic entropy through the integration of / that yields 5.4 J mol-1 K-1 at 150 K (lower panel of Fig. 6). This value is not far from the expected full magnetic entropy for spin-: = 5.76 J mol-1 K-1.
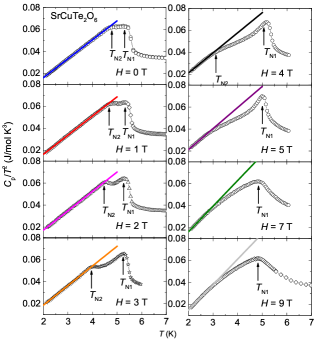
Figure 7 shows the plot of / as a function of measured at different applied fields from 0 to 9 T. At = 0 T, two transitions are clearly visible at and . With increase in , shows a very weak effect, while moves towards low temperatures. For 4 T, the peak associated with broadens and eventually disappears. At , follows a behavior that indicates 3D spin-wave dispersions in the ordered state.Nath et al. (2014b)
III.3 Microscopic magnetic model
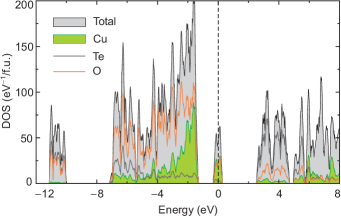
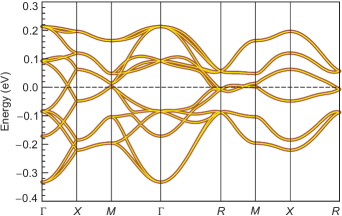
The quasi-1D behavior of SrCuTe2O6 is, at first glance, perplexing, given the 3D nature of the crystal structure (Fig. 1). In order to rationalize this behavior, we evaluated individual exchange couplings in SrCuTe2O6. Two complementary procedures, the model analysis and total-energy calculations, were used. The model analysis rests upon a tight-binding fit of the GGA band structure (Fig. 8). In GGA, strong correlation effects are largely neglected and should be, hence, taken into account on a model level by supplying the GGA-based tight-binding Hamiltonian with the Hubbard term, where eVJanson et al. (2011); Rousochatzakis et al. (2015) stands for an effective Coulomb repulsion in the Cu–O bands. This way, AFM parts of the exchange couplings are calculated as , where are tight-binding (hopping) parameters.
| 4.55 | 11 | 1 | 0.3 | |
|---|---|---|---|---|
| 5.52 | 27 | 8 | 4 | |
| 6.29 | 71 | 45 | ||
| 8.96 | 4 | 2 |
Hopping parameters were calculated by constructing Wannier functions for the isolated 12-band complex at the Fermi level (Fig. 9). These 12 bands originate from states of 12 Cu atoms in the unit cell. Here, the and axes are directed along the Cu–O bonds, and the magnetic orbital lies in the CuO4 plane, similar to the majority of cuprates. The hopping parameters listed in Table 1 reveal the leading third-neighbor AFM coupling , whereas the couplings between first, second, and sixth neighbors are about order of magnitude smaller. Other couplings, including those between fourth and fifth neighbors, yield meV, hence K.
The results of the model analysis were verified by a direct calculation of exchange integrals from total energies of collinear spin configurations obtained in GGA+, where correlation effects are directly included in the self-consistent DFT procedure.111This calculation resulted in a band gap of about 3.0 eV for the lowest-energy AFM spin configuration. These exchange integrals are in excellent agreement with those obtained from the model analysis. The dominant interaction is K in good agreement with the experimental K. The leading interchain couplings are and .
Let us now consider the topology of the spin lattice. According to Ref. Koteswararao et al., 2014, forms isolated triangles that are basically irrelevant to the physics of SrCuTe2O6 because is nearly zero. The second-neighbor coupling forms a hyperkagome network (Fig. 1, middle). The leading coupling forms perpendicular chains running along the , , and directions (Fig. 1). Finally, forms another complex network that also frustrates the lattice, because each atom of a given chain is coupled to two neighboring atoms of another chain (Fig. 1, middle). We thus find that SrCuTe2O6 is a spin-chain compound with a complex and strongly frustrated network of interchain couplings.
Remarkably, none of the exchange couplings in SrCuTe2O6 entails a direction connection between the CuO4 plaquettes, and even those plaquettes that are connected via TeO3 pyramids reveal a weak coupling K only. The leading interaction runs between third neighbors despite the fact that the respective CuO4 plaquettes lack any obvious structural connectivity (Fig. 1, right). Nevertheless, these plaquettes are arranged in such a way that two Cu–O bonds are directed toward each other, the OO distance is about 2.79 Å, and the resulting Cu–OO–Cu pathway is only weakly bent with the Cu–OO angle of 152∘ compared to 180∘ for the linear pathway. This configuration triggers a sizable exchange coupling of nearly 50 K for the Cu atoms that are more than 6 Å apart, similar to other cuprate materials, where individual CuO4 units are structurally disconnected. By contrast, shorter Cu–Cu distances observed for and feature strongly bent Cu–OO–Cu pathways and turn out to be inefficient for the superexchange.
IV Discussion and summary
When probed above , SrCuTe2O6 is, at first glance, indistinguishable from a conventional spin- Heisenberg chain antiferromagnet. It is a quantum spin system showing broad maxima in the magnetic susceptibility and magnetic specific heat. The positions of these maxima and the absolute values at the maxima are, in general, consistent with the quantum spin-chain model. The maximum value of ( 0.359) is higher than in typical two-dimensional and three-dimensional frustrated spin systems and lower than in a non-frustrated two-dimensional quantum antiferromagnet,Bernu and Misguich (2001); Hofmann et al. (2003) thus indicating the 1D nature of the spin lattice. The curve above follows the specific heat of a uniform quantum spin- chain (Fig. 10),Johnston et al. (2000) although we had to re-normalize the exchange coupling to K compared to K from the susceptibility fit. The origin of this discrepancy is not entirely clear. The shift of the specific heat maximum toward lower temperatures may be due to enhanced quantum fluctuations arising from frustrated nature of the interchain couplings. However, we cannot completely exclude artifacts related to the data analysis and to the subtraction of the phonon contribution.
At low temperatures, the majority of spin-chain systems undergo a single magnetic transition toward the long-range-ordered antiferromagnetic state. Disregarding the geometry of interchain couplings, transition temperature can be determined from the expression proposed by Schulz:Schulz (1996)
| (4) |
where is an effective interchain coupling, and four interchain couplings per Cu2+ ion are assumed. Taking 5.5 K and 49.3 K, we arrive at 2.2 K, which is, remarkably, of the same magnitude as the interchain couplings and derived from our microscopic analysis (Table 1). A more advanced approach of Ref. Yasuda et al., 2005 yields a very similar value of 2.5 K. Therefore, we expect that the frustration of interchain couplings in SrCuTe2O6 has little influence on the value of , but it may be responsible for the presence of two transitions and for the unusual temperature-field phase diagram (Fig. 11).

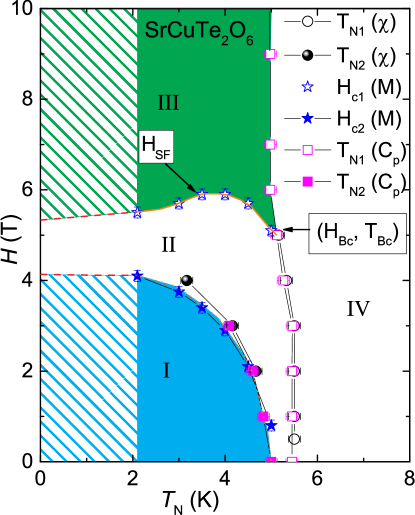
Our data suggest that the magnetic order sets in below . The -type anomaly of the specific heat indicates a conventional second-order transition. The second transition at (also tracked by ) manifests itself by a hump in the specific heat and could be a spin-reorientation transition. Yet another transition takes place in the magnetic field of T at . The weak field dependence of the respective line on the phase diagram (Fig. 11) is reminiscent of a spin-flop transition in conventional antiferromagnets. Similar to the spin-flop transition, this line ends at a bicritical point where the magnetic ordering transition at is reached. Altogether, our data identify three distinct ordered phases of SrCuTe2O6 (I, II, and III) on the phase diagram up to 9 T (Fig. 11). Additional phases could be present at higher fields. From K, the saturation field as high as T should be expected.
Although SrCuTe2O6 is a quasi-1D spin-chain compound, its phase diagram is reminiscent of the behavior of triangular-lattice antiferromagnets,Seabra et al. (2011); Gvozdikova et al. (2011) where the antiferromagnetic order, which is the ground state of the Heisenberg antiferromagnet on the triangular lattice,Capriotti et al. (1999); *White2007 competes with the so-called up-up-down () phase. The phase is stabilized by the magnetic field that introduces axial (Ising) anisotropy and disfavors the non-collinear order. Thermal fluctuations may also stabilize the collinear phase in zero field. This results in two zero-field transitions, with the phase formed below and the order formed below , as in Ba3(Mn,Co)Nb2O9.Lee et al. (2014a, b) Other triangular antiferromagnets reveal the phase in applied magnetic fields only.[Forexample:][]Smirnov2007; *Hwang2012 At higher fields, yet another, 0-coplanar or canted phase, is stabilized.Seabra et al. (2011); Gvozdikova et al. (2011); Yamamoto et al. (2015) The transition between the and 0-coplanar phases is typically weakly field-dependent, so it can be paralleled to the II–III transition line in Fig. 11.
Whilst being a useful reference point, the scenario of multiple magnetic transitions in triangular-lattice antiferromagnets cannot be directly applied to SrCuTe2O6. First, the spin lattice of SrCuTe2O6 is not triangular. It is primarily 1D, whereas interchain couplings form an intricate network that, despite being built of triangles, can not be considered as a standard triangular lattice. Second, the physics of triangular antiferromagnetic materials is often influenced by the single-ion anisotropy that vanishes for the genuine spin- Cu2+ ion. Therefore, other sources of anisotropy, such as Dzyaloshinsky-Moriya couplings allowed by the chiral symmetry of the crystal structure, may be important. A direct investigation of the ordered phases of SrCuTe2O6 with neutron scattering and resonance techniques would be very interesting. To the best of our knowledge, multiple magnetic transitions in zero field and the non-trivial phase diagram are unique for SrCuTe2O6 among the broad family of quasi-1D antiferromagnets with uniform, non-frustrated spin- chains. Several magnetic transitions have been observed in -TeVO4, but no information on the nature of ordered phases is presently available,Savina et al. (2011) and even the topology of spin chains has been disputed.Saúl and Radtke (2014) LiCuVO4 is another famous example of a quasi-1D system with multiple field-induced phases,Büttgen et al. (2012); *Banks2007; Schrettle et al. (2008) yet it features only one magnetic transition in zero field, whereas the complex high-field behavior may be heavily influenced by helical correlations induced by the frustration of intrachain ferromagnetic and antiferromagnetic couplings.
In summary, we have shown that SrCuTe2O6 is a quasi-1D chain antiferromagnet that reveals non-trivial physics at low temperatures with two ordered phases in zero field and altogether three distinct phases in the phase diagram studied in magnetic fields up to 9 T. The behavior above the magnetic ordering temperature can be well understood in the framework of the Heisenberg spin- chain model. The spin chains are formed by the exchange couplings between third neighbors, whereas interchain couplings are strongly frustrated. SrCuTe2O6 is, thus, surprisingly different from its structural sibling PbCuTe2O6, where first-, second- and third-neighbor couplings, all having similar magnitude, form a three-dimensional frustrated spin lattice and suppress the magnetic order below 1 K. SrCuTe2O6 enters the magnetically ordered phase at a somewhat higher temperature of K in zero field and reveals an unexpectedly complex phase diagram that calls for further experimental investigation. It is worth noting that the crystal structure of SrCuTe2O6 is non-centrosymmetric, although non-polar. Nevertheless, ferroelectricity may be induced by the magnetic order and magnetic field, similar to LiCuVO4 and other frustrated-chain magnets.Schrettle et al. (2008) This possibility should be explored in future studies.
Acknowledgements.
NA and RN would like to acknowledge Department of Science and Technology, India for financial support. AT was funded by the ESF (Mobilitas grant MTT77), PUT733 grant of the Estonian Research Council, and by the Sofja Kovalevskaya Award of Alexander von Humboldt Foundation.References
- Ramirez (1994) A. P. Ramirez, Ann. Review Mater. Sci. 24, 453 (1994).
- Greedan (2001) J. Greedan, J. Mater. Chem 11, 37 (2001).
- Moessner and Ramirez (2006) R. Moessner and A. P. Ramirez, Physics Today 59, 24 (2006).
- Balents (2010) L. Balents, Nature 464, 199 (2010).
- Mendels and Bert (2010) P. Mendels and F. Bert, J. Phys. Soc. Jpn. 79, 011001 (2010).
- Okamoto et al. (2007) Y. Okamoto, M. Nohara, H. Aruga-Katori, and H. Takagi, Phys. Rev. Lett. 99, 137207 (2007).
- Dally et al. (2014) R. Dally, T. Hogan, A. Amato, H. Luetkens, C. Baines, J. Rodriguez-Rivera, M. J. Graf, and S. D. Wilson, Phys. Rev. Lett. 113, 247601 (2014).
- Koteswararao et al. (2014) B. Koteswararao, R. Kumar, P. Khuntia, S. Bhowal, S. K. Panda, M. R. Rahman, A. V. Mahajan, I. Dasgupta, M. Baenitz, K. H. Kim, and F. C. Chou, Phys. Rev. B 90, 035141 (2014).
- Wulff and Müller-Buschbaum (1997) L. Wulff and H. Müller-Buschbaum, Z. Naturforsch. B 52, 1341 (1997).
- Yeon et al. (2011) J. Yeon, S.-H. Kim, M. A. Hayward, and P. S. Halasyamani, Inorg. Chem. 50, 8663 (2011).
- Rodríguez-Carvajal (1993) J. Rodríguez-Carvajal, Physica B: Condensed Matter 192, 55 (1993).
- Koepernik and Eschrig (1999) K. Koepernik and H. Eschrig, Phys. Rev. B 59, 1743 (1999).
- Perdew et al. (1996) J. P. Perdew, K. Burke, and M. Ernzerhof, Phys. Rev. Lett. 77, 3865 (1996).
- Mazurenko et al. (2014) V. V. Mazurenko, M. V. Valentyuk, R. Stern, and A. A. Tsirlin, Phys. Rev. Lett. 112, 107202 (2014).
- Nath et al. (2014a) R. Nath, K. M. Ranjith, J. Sichelschmidt, M. Baenitz, Y. Skourski, F. Alet, I. Rousochatzakis, and A. A. Tsirlin, Phys. Rev. B 89, 014407 (2014a).
- Bonner and Fisher (1964) J. C. Bonner and M. E. Fisher, Phys. Rev. 135, A640 (1964).
- Eggert et al. (1994) S. Eggert, I. Affleck, and M. Takahashi, Phys. Rev. Lett. 73, 332 (1994).
- Johnston et al. (2000) D. C. Johnston, R. K. Kremer, M. Troyer, X. Wang, A. Klümper, S. L. Bud’ko, A. F. Panchula, and P. C. Canfield, Phys. Rev. B 61, 9558 (2000).
- Selwood (1956) P. W. Selwood, Magnetochemistry, 2nd ed. (Wiley-Interscience, New York, 1956) p. p. 78.
- Motoyama et al. (1996) N. Motoyama, H. Eisaki, and S. Uchida, Phys. Rev. Lett. 76, 3212 (1996).
- Nath et al. (2005) R. Nath, A. V. Mahajan, N. Büttgen, C. Kegler, A. Loidl, and J. Bobroff, Phys. Rev. B 71, 174436 (2005).
- Koteswararao et al. (2013) B. Koteswararao, R. Kumar, J. Chakraborty, B.-G. Jeon, A. V. Mahajan, I. Dasgupta, K. H. Kim, and F. C. Chou, J. Phys.:Condens. Matter 25, 336003 (2013).
- Janson et al. (2011) O. Janson, A. A. Tsirlin, J. Sichelschmidt, Y. Skourski, F. Weickert, and H. Rosner, Phys. Rev. B 83, 094435 (2011).
- Nath et al. (2008) R. Nath, A. A. Tsirlin, H. Rosner, and C. Geibel, Phys. Rev. B 78, 064422 (2008).
- Nath et al. (2010) R. Nath, V. O. Garlea, A. I. Goldman, and D. C. Johnston, Phys. Rev. B 81, 224513 (2010).
- Nath et al. (2014b) R. Nath, K. M. Ranjith, B. Roy, D. C. Johnston, Y. Furukawa, and A. A. Tsirlin, Phys. Rev. B 90, 024431 (2014b).
- Rousochatzakis et al. (2015) I. Rousochatzakis, J. Richter, R. Zinke, and A. A. Tsirlin, Phys. Rev. B 91, 024416 (2015).
- Note (1) This calculation resulted in a band gap of about 3.0\tmspace+.1667emeV for the lowest-energy AFM spin configuration.
- Bernu and Misguich (2001) B. Bernu and G. Misguich, Phys. Rev. B 63, 134409 (2001).
- Hofmann et al. (2003) M. Hofmann, T. Lorenz, K. Berggold, M. Grüninger, A. Freimuth, G. S. Uhrig, and E. Brück, Phys. Rev. B 67, 184502 (2003).
- Schulz (1996) H. J. Schulz, Phys. Rev. Lett. 77, 2790 (1996).
- Yasuda et al. (2005) C. Yasuda, S. Todo, K. Hukushima, F. Alet, M. Keller, M. Troyer, and H. Takayama, Phys. Rev. Lett. 94, 217201 (2005).
- Seabra et al. (2011) L. Seabra, T. Momoi, P. Sindzingre, and N. Shannon, Phys. Rev. B 84, 214418 (2011).
- Gvozdikova et al. (2011) M. V. Gvozdikova, P.-E. Melchy, and M. E. Zhitomirsky, J. Phys.: Condens. Matter 23, 164209 (2011).
- Capriotti et al. (1999) L. Capriotti, A. E. Trumper, and S. Sorella, Phys. Rev. Lett. 82, 3899 (1999).
- White and Chernyshev (2007) S. R. White and A. L. Chernyshev, Phys. Rev. Lett. 99, 127004 (2007).
- Lee et al. (2014a) M. Lee, E. S. Choi, X. Huang, J. Ma, C. R. Dela Cruz, M. Matsuda, W. Tian, Z. L. Dun, S. Dong, and H. D. Zhou, Phys. Rev. B 90, 224402 (2014a).
- Lee et al. (2014b) M. Lee, J. Hwang, E. S. Choi, J. Ma, C. R. Dela Cruz, M. Zhu, X. Ke, Z. L. Dun, and H. D. Zhou, Phys. Rev. B 89, 104420 (2014b).
- Smirnov et al. (2007) A. I. Smirnov, H. Yashiro, S. Kimura, M. Hagiwara, Y. Narumi, K. Kindo, A. Kikkawa, K. Katsumata, A. Y. Shapiro, and L. N. Demianets, Phys. Rev. B 75, 134412 (2007).
- Hwang et al. (2012) J. Hwang, E. S. Choi, F. Ye, C. R. Dela Cruz, Y. Xin, H. D. Zhou, and P. Schlottmann, Phys. Rev. Lett. 109, 257205 (2012).
- Yamamoto et al. (2015) D. Yamamoto, G. Marmorini, and I. Danshita, Phys. Rev. Lett. 114, 027201 (2015).
- Savina et al. (2011) Y. Savina, O. Bludov, V. Pashchenko, S. L. Gnatchenko, P. Lemmens, and H. Berger, Phys. Rev. B 84, 104447 (2011).
- Saúl and Radtke (2014) A. Saúl and G. Radtke, Phys. Rev. B 89, 104414 (2014).
- Büttgen et al. (2012) N. Büttgen, P. Kuhns, A. Prokofiev, A. P. Reyes, and L. E. Svistov, Phys. Rev. B 85, 214421 (2012).
- Banks et al. (2007) M. G. Banks, F. Heidrich-Meisner, A. Honecker, H. Rakoto, J.-M. Broto, and R. K. Kremer, J. Phys.: Condens. Matter 19, 145227 (2007).
- Schrettle et al. (2008) F. Schrettle, S. Krohns, P. Lunkenheimer, J. Hemberger, N. Büttgen, H.-A. K. von Nidda, A. V. Prokofiev, and A. Loidl, Phys. Rev. B 77, 144101 (2008).