THERMAL EMISSIONS SPANNING THE PROMPT AND THE AFTERGLOW PHASE OF THE ULTRA-LONG GRB 130925A
Abstract
GRB 130925A is an ultra-long GRB, and it shows clear evidences for a thermal emission in the soft X-ray data of Swift/XRT ( keV), lasting till the X-ray afterglow phase. Due to the long duration of the GRB, the burst could be studied in hard X-rays with high-resolution focusing detectors (NuSTAR). The blackbody temperature, as measured by the Swift/XRT, shows a decreasing trend till the late phase (Piro et al. 2014) whereas the high-energy data reveals a significant blackbody component during the late epochs at an order of magnitude higher temperature ( keV), as compared to the contemporaneous low energy data (Bellm et al. 2014). We resolve this apparent contradiction by demonstrating that a model with two black bodies and a power-law (2BBPL) is consistent with the data right from the late prompt emission to the afterglow phase. Both the blackbodies show a similar cooling behaviour upto the late time. We invoke a structured jet, having a fast spine and a slower sheath layer, to identify the location of these blackbodies. Independent of the physical interpretation, we propose that the 2BBPL model is a generic feature of the prompt emission of all long GRBs, and the thermal emission found in the afterglow phase of different GRBs reflects the lingering thermal component of the prompt emission with diverse time-scales. We strengthen this proposal by pointing out a close similarity between the spectral evolutions of this GRB and GRB 090618, a source with significant wide band data during the early afterglow phase.
Subject headings:
gamma-ray burst: general — gamma-ray burst: individual (130925A) — methods: data analysis — methods: observational — radiation mechanisms: thermal1. Introduction
The X-ray and gamma-ray emissions from gamma-ray bursts (GRBs) show two distinct phases: a prompt emission with drastic spectral and temporal variations, and an afterglow having smooth variation with time and energy (Piran 1999). Though the afterglow emission is understood as due to synchrotron emission from a fast moving jet in the ambient medium, the characteristics and the radiation mechanisms of the prompt emission is still a matter of debate (Mészáros 2006). This apparent dichotomy of observations, and the corresponding understanding, is accentuated by the fact that the prompt emission is studied using wide band hard X-ray/gamma-ray detectors with poor energy resolution and low sensitivity (due to high background), while the leisurely X-ray afterglow is amenable to be observed with focusing X-ray telescopes with excellent energy resolution and sensitivity. The fast moving Swift satellite (Gehrels et al. 2004) provides good quality data for the early afterglow of several GRBs in the low energies with the X-Ray Telescope (XRT; Burrows et al. 2005). However, the typical slewing ability ( s) is insufficient to capture the prompt emission of the majority of GRBs with the XRT. Further, during the XRT observations, the hard X-ray emission fades below the detection level of Swift/Burst Alert Telescope (BAT; Barthelmy et al. 2005) for most cases. Hence, it is difficult to identify a broadband spectral feature with the combined BAT-XRT data.
In a recent paper (Basak & Rao 2014a, hereafter Paper I), we found a clear evidence for two smoothly evolving blackbodies in the early afterglow of GRB 090618. As this GRB has a long gamma-ray duration, a significant overlap is seen in the BAT and XRT observations during the junction of the prompt and the afterglow phase ( s). This overlapping observation allowed us to identify two blackbodies in the individual energy windows provided by the BAT and the XRT. The temperature and the flux of the two blackbodies are found to have similar evolution throughout the final pulse of the prompt emission till the early afterglow phase. This is one of the rare GRBs with a significant overlap in the XRT and BAT observations, and further, the two blackbodies happen to independently dominate the two detectors. Hence it is important to confirm this finding and examine whether this behaviour is a generic feature of all GRBs.
In this context ultra-long GRBs, a class of GRBs which produce prompt emission for hours, provide an excellent opportunity to study the spectral evolution from the prompt to the afterglow phase. GRB 130925A is an ultra-long GRB with the gamma-ray duration of hr. This GRB was detected by several satellites including the Swift/BAT and the Swift/XRT. Due to the gamma-ray emission on a long time-scale, the burst could be observed with the focusing telescopes of NuSTAR (Harrison et al. 2013). The Swift/XRT data revealed the presence of a blackbody emission at low energies during the prompt to the afterglow phase (Piro et al. 2014; P14 hereafter), though the same data could be interpreted as due to a steep power-law emission rather than a blackbody (Evans et al. 2014). The hard X-ray data from the NuSTAR, on the other hand, found a very significant emission above 10 keV at late times, which could be interpreted as due to an emission from a blackbody of temperature 5 keV (Bellm et al. 2014; B14 hereafter). The contemporaneous data of Swift/XRT, however, finds a blackbody with temperature 0.5 keV (P14). In this Letter we demonstrate that all these data are consistent with a model consisting of two black bodies and a power-law (2BBPL). In the next section we summarise the pertinent data on GRB 130925A and present a re-analysis. The results are discussed in the context of a spine-sheath jet (section 3), and in the last section we give a summary of the important findings of this work.
2. Thermal Emission in GRB 130925A
GRB 130925A was triggered by the Swift/BAT at 2013-09-25 04:11:24 UT. The Swift/XRT followed the burst from 150 s after the BAT trigger. The burst showed several pulse emissions and soft flares till late time. A detailed analysis of the high-energy emission from this source is presented in Evans et al. (2014). They argue that this GRB (and by extension other ultra-long GRBs) could be understood as events with low circumburst densities, and correspondingly having an order of magnitude lower deceleration time compared to the normal long GRBs. They strongly favour a steep power-law function (index ) for the late X-ray afterglow spectrum, and use the dust scattering model for the explanation (Shao & Dai 2007).
P14, on the other hand, explain the steep spectrum as a superposition of a blackbody (temperature, keV) and a power-law (BBPL) model. A crucial XMM-Newton observation after 3 months shows a harder power-law index (). As the thermal emission possibly subsides after such a long time, the spectrum is expected to reveal the underlying non-thermal component. The hard value of the index agrees with a standard afterglow in a wind medium. On the other hand, the blackbody component is suggested to be a ‘hot’ cocoon which forms on the GRB jet as it pierces through the progenitor — possibly a blue suergiant star.
Another important clue on the spectral shape is provided by the observation with high-resolution focusing detectors, NuSTAR, in three periods (1.8 day, 8.8 day, and 11.3 day), and Chandra ACIS-S in one period (11.0 day). B14 have analyzed the spectra in two epochs — day and day. In both cases, they have found significant deviation from the canonical afterglow spectrum. The high-resolution data shows a ‘dip’ in the continuum spectrum. B14 have used a BBPL model to capture the feature. Interestingly, they have found that the blackbody temperatures in the two epochs ( keV and keV, respectively) have an order of magnitude higher values than that found by P14 in the XRT data. Though the data allows a softer blackbody (near keV), B14 have argued in favour of the higher-temperature blackbody, as the lower-temperature blackbody shows an unphysical contraction of the apparent emitting region at the later epoch, from cm to cm.
| Interval | |||
|---|---|---|---|
| (keV) | (erg cm-2 s-1) | cm | |
| Observation 1 ( day) | |||
| (a)BB1 | |||
| BB2 | |||
| Observation 2 ( day) | |||
| BB1 | |||
| BB2 | |||
(a)BB1=Higher-temperature blackbody, BB2=Lower-temperature blackbody
| Parameter | 105-150 s | 150-175 s | 175-225 s | 225-295 s |
|---|---|---|---|---|
| ( atoms cm-2) | ||||
| (keV) | ||||
| (keV) | ||||
| (keV) | ||||
| (dof) | 0.93 (54) | 1.2 (76) | 1.3 (76) | 1.1 (76) |
(a) =Higher-temperature blackbody, =Lower-temperature blackbody
2.1. Signature of two blackbodies in the afterglow data
To arrive at a correct spectral model, it is important to fix the continuum and hence data above 10 keV is very crucial. We re-analyze the data whenever a higher energy observation is available (either BAT or NuSTAR observation). These epochs are: (I) s during the prompt emission (joint BAT-XRT observations), (II) 1.8 day during the afterglow (joint NuSTAR-XRT observations), and (III) day (joint Chandra-NuSTAR observations). The observation in epoch II provides the best possible data among all the observations, due to the superior sensitivity and resolution of the NuSTAR detectors (and the higher flux compared to epoch III). In Figure 1, we show the spectrum of epoch II, fitted with various models. We follow the standard procedure described by B14 to extract the spectral data. The spectrum is fitted in XSPEC v12.8.2. We fit the following models: (A) power-law (PL), (B) Power-law with a Gaussian absorption (gabsPL), (C) a blackbody with a power-law (BBPL), and (D) two blackbodies with a power-law (2BBPL). In all cases we have used a wabs and a zwabs model to account for the absorption in our Galaxy and in the source, respectively. P14 have fitted the time-resolved data during 20 ks-8 Ms with wabszwabsPL model. As the equivalent hydrogen column density () at the source should not change over time, they have linked this parameter in all time bins to obtain its precise value — cm-2. We have used this value, along with the Galactic absorption of cm-2 to perform uniform fitting with all the models. Keeping the source absorption free gives a value close to P14, within the statistical errors. Note in Figure 1 (panel A) that a PL fit shows a ‘dip’ near 5 keV. We obtain / degrees of freedom (dof)=158.7/124 for a PL fit. Incidentally, a Band function (Band et al. 1993) gives a similar unacceptable fit with /dof=153.0/121. A Gaussian absorber gives an immediate improvement with /dof=100.8/121. However, as noted by B14, we also see a shift in the centroid from keV to keV from epoch II to epoch III. Hence, the Gaussian absorber is unphysical. A BBPL model gives a reasonable fit with /dof=106.1/122 (see panel C). Finally, we fit the spectrum with a 2BBPL model and obtain /dof=96.7/120. The parameters of the blackbodies are shown in the first two rows of Table 1. We perform F-test to find the significance of adding the second blackbody. We find a significance corresponding to . The temperature of the two blackbodies in this epoch are: keV and keV. Note that these values are close to those reported by B14 and P14 (both within ), respectively. Based on the analysis of the epoch II, we fit the spectrum of the epoch III with a 2BBPL model. We freeze the power-law index to the value obtained in epoch II (-3.74). B14 has combined the NuSTAR data of day and day. As both the blackbodies may evolve significantly during this time, we use only the data of day. We obtain a /dof=146.55/133. The parameters of the blackbodies are shown in the last two rows of Table 1. The temperature of the two blackbodies are keV and keV. We note that the temperature of the higher-temperature blackbody is somewhat lower than the temperature of the single blackbody as obtained by B14 ().

2.2. Thermal emission spanning the prompt and afterglow phase
In order to see how the temperature of the two blackbodies evolve during the prompt emission, we fit the joint BAT-XRT data in 150-300 s interval. We obtain three time-resolved spectra in 150-175 s, 175-225 s, and 225-295 s intervals. For each case, we obtain a reasonable fit with reduced close to 1 for 76 dof (see Table 2). In the first interval, the 2BBPL model shows significant improvement compared to a BBPL model with in the expense of two dof. The F-test gives a significance () for the addition of the second blackbody. It is worthwhile to mention that a Band function also gives an acceptable fit to the prompt emission data. However, as already mentioned the Band function is inadequate during the epoch II, where we have good quality data. In addition to the joint BAT-XRT data, we also fit a BBPL model to the falling part of the final pulse (105-150 s) and obtain keV.
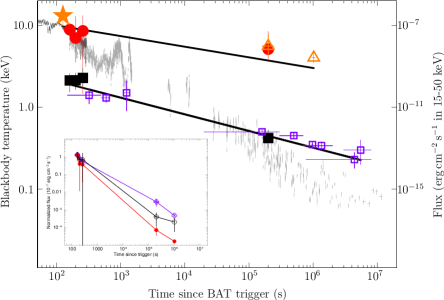
In Figure 2, we show the temperature evolution of the two blackbodies (filled symbols — circles for the higher-, and squares for the lower-temperature blackbody). The lightcurve (15-50 keV flux in units of erg cm-2 s-1) of the GRB in the BAT and XRT detectors is shown in the background. The star represents the single blackbody temperature during the falling part of the last pulse in the BAT data. For a comparison, we have plotted the temperature values obtained by P14 (open squares) and B14 (open triangles). We note that the values of the higher and the lower temperature are in general agreement with that of B14 and P14, respectively. We fit the evolution of both the blackbodies as a power-law function of time. In doing this, we assume that all the blackbody temperatures given by P14 are that of the lower-temperature blackbody of the unified 2BBPL model. The slope of the evolution are and for the higher- and lower-temperature blackbody, respectively. The two evolutions can be considered either approximately similar, or the higher-temperature blackbody has a slower temperature evolution. Note that due to the large gap in the prompt and afterglow coverage of the high energy observation, the error in the slope of the higher-temperature blackbody evolution is large. Hence, the comparison between the two temperature evolutions remains inconclusive. In the inset of Figure 2, we show the time evolution of the flux of the individual components of the 2BBPL model. We have shown only those points, where we have high energy observation with either BAT or NuSTAR. In order to compare the flux evolution of the components, the blackbody flux are normalized to the power-law flux of the initial time bin. We note that the thermal flux decreases more rapidly compared to the power-law flux. The flux of the higher-temperature blackbody evolves even faster.
3. Discussion
Though it is not conclusive that the 2BBPL is the correct description of the GRB emission model during the prompt and the early afterglow phase, there are strong evidences to support the claim that this model is consistent with a wide variety of data. This model is superior to other models (BBPL/ Band) for bright GRBs (Rao et al. 2014) and it is a preferred model for GRBs with single pulses (Basak & Rao 2014b), GRBs with separable pulses (Basak & Rao 2013b) and GRBs with high energy (GeV) emission and detected by Fermi/Large Area Telescope (Basak & Rao 2013a). For GRB 090618 (Paper I), the superior spectroscopic Swift/XRT detector shows a blackbody temperature decreasing with time, consistent with the interpretation that the two components of the 2BBPL model seen in the last GRB pulse are showing a cooling behaviour. In the present paper, we have seen yet another evidence for the two blackbody emissions in the case of GRB 130925A. In the next sections, we investigate the implications for the putative photospheres and a possible jet scenario where two photospheres can co-exist.
3.1. Photosphere of the two blackbodies
It is interesting to calculate the apparent emission radius for a spherical emission region () during the two epochs of NuSTAR observation. Both B14 and P14 find that the value of shows a contraction during this time. As we have two blackbodies, we calculate the value of for each of them as follows.
| (1) |
where is the luminosity distance, is Stefan-Boltzmann constant erg cm-2 s-1 K-4, is the observed blackbody flux, and is the temperature corrected for the redshift, . The radius of the higher-temperature blackbody in the two epochs are found to be cm and cm, which show a slow increment. Interestingly, the value of of the lower-temperature blackbody is found to be cm and cm (see the last column of Table 1). Note that this result is markedly different from that obtained by B14 and P14. Our analysis shows a definite increment of the apparent radius at the later epoch.
3.2. A spine-sheath jet
In paper I, we have proposed a spine-sheath jet to explain the evolution of the two blackbodies. A fast moving spine with a slower sheath component is expected in a number of physical scenario, e.g., a hot cocoon formed over the GRB jet as it pierces through the envelop of the progenitor (Mészáros & Rees 2001; Ramirez-Ruiz et al. 2002; Zhang et al. 2003, 2004), or a collimated proton jet along with a wider neutron sheath for a magnetic jet (Vlahakis et al. 2003; Peng et al. 2005). Such a structured jet is frequently invoked to explain double jet break and optical re-brightening (e.g., Berger et al. 2003; Liang & Dai 2004; Holland et al. 2012). If the sheath component of the jet is in fact the cocoon, we expect it to be less collimated, and the terminal bulk Lorentz factor () to be lower by a factor of than the spine.
The observed physical sizes of the two blackbodies show very slow expansion rates and the corresponding sizes of the photospheres too would have slow speeds and hence they cannot be tied to the actual sizes of the outflowing plasma. Hence the photospheres have to be steady/ gradually changing regions in the outflow. We invoke that the spine photosphere produces the higher-temperature blackbody while the lower-temperature blackbody is produced by the sheath photosphere. Note that the size of the emitting regions calculated above are considered as spherical emission regions. The physical photosphere can be related to the observed size by . With reasonable values of for the spine and the sheath (say and , respectively), one should obtain larger values of the corresponding emission radius. The observed properties of the two photospheres can be used to constrain the properties of the spine and the sheath. For example, we have found that the higher-temperature blackbody has much lower evolution and hence we can assume that the spine remains “steady” for a long time. The sheath photosphere, on the other hand, shows considerable evolution. For a cocoon sheath, a rapid photospheric expansion is indeed expected (Starling et al. 2012).
3.3. Comparison with GRB 090618
Evans et al. (2014) have made a systematic analysis of 672 XRT GRBs, and found that after 3 ks of the individual trigger, the hardness ratio (HR) does not show any evolution for the majority of GRBs. For 12 GRBs (including GRB 130925A), which show significance of HR variation at late times, the power-law index shows a continuous increment with time. They argue that the HR evolutions in these GRBs including GRB 130925A can be explained by a dust scattering model.
However, the hard X-ray data at late times requires emission above 10 keV, which is not compatible with a steep power-law model (as required by the XRT data alone). Hence, we explore here whether the spectral evolution of GRB 130925A could be explained by the 2BBPL model, and whether this model is a generic feature of all GRBs. We have taken the temperature evolution as given in Figure 2, and verified that the count rate variation in two energy bands in the XRT data ( keV and keV) after 100 ks is compatible with the flux variation of the three components as given in the inset of Figure 2.
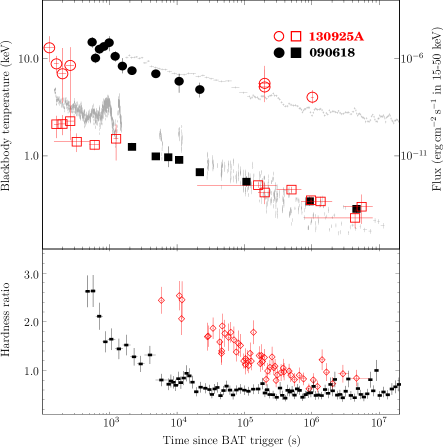
The rare occurrence of spectral variation after 3 ks could be explained by postulating that the blackbody components decay at different rates for different GRBs. We investigate this hypothesis by comparing the results of GRB 130925A with GRB 090618. In Figure 3, we plot the relevant parameters for these two GRBs, but the time axis of GRB 090618 is arbitrarily stretched ( s data is stretched to 107 s). The close similarity in the spectral variation in these two GRBs encourages us to hypothesise that the 2BBPL model is a generic feature of all GRBs and the black body components decay at different rates for different GRBs.
4. Conclusions
The major conclusions from the work presented here can be summarized as follows.
(1) We use high-resolution NuSTAR data of the ultra-long GRB 130925A, and find that the spectrum is consistent with a 2BBPL model. The lower-temperature blackbody is consistent with an evolving blackbody throughout the burst (P14). The higher-temperature blackbody is also consistent with the single blackbody of B14, and this component also shows a similar evolution as the lower-temperature blackbody.
(2) The evolution of the corresponding photospheres of the two blackbodies are found to be different. While the higher-temperature blackbody shows a constant spherical emission region, the lower-temperature blackbody shows a rapid evolution of the photosphere.
(3) We have proposed a structured jet with fast spine and slow sheath as the origin of the thermal components. The higher-temperature blackbody is produced at the spine photosphere, which remains ‘steady’ at the later epoch. The sheath is possibly a cocoon, which shows a rapid expansion of the photosphere.
In recent years, we have found that the time-resolved prompt emission spectrum of a variety of GRBs is consistent with the 2BBPL model (Basak & Rao 2013b, a; Rao et al. 2014). This spectral shape is statistically preferred for GRBs with high signal-to-noise data. However, due to the limited spectral resolution of the gamma-ray detectors, we could not draw a firm conclusion. We could detect the two blackbodies in the early afterglow data of GRB 090618 (Paper I), as the XRT provided a good spectral data during the overlapping observation with the BAT. The current observation also shows a clear signature of the two blackbodies which evolve from the very early phase during the prompt emission, and remains visible with high significance at very late times. We emphasize again that independent of the physical interpretation of the 2BBPL, this model emerges as a generic spectrum of long GRBs.
Acknowledgments
This research has made use of data obtained through the HEASARC Online Service, provided by the NASA/GSFC, in support of NASA High Energy Astrophysics Programs. This work made use of data supplied by the UK Swift Science Data Centre at the University of Leicester. We thank the referee for valuable comments to make the presentation more rigorous.
References
- Band et al. (1993) Band, D., Matteson, J., Ford, L., et al. 1993, ApJ, 413, 281
- Barthelmy et al. (2005) Barthelmy, S. D., Barbier, L. M., Cummings, J. R., et al. 2005, Space Sci. Rev., 120, 143
- Basak & Rao (2013a) Basak, R., & Rao, A. R. 2013a, ApJ, 775, 31
- Basak & Rao (2013b) —. 2013b, ApJ, 768, 187
- Basak & Rao (2014a) —. 2014a, ApJ, submitted, arXiv:1409.4538 (Paper I)
- Basak & Rao (2014b) —. 2014b, MNRAS, 442, 419
- Bellm et al. (2014) Bellm, E. C., Barrière, N. M., Bhalerao, V., et al. 2014, ApJ, 784, L19 (B14)
- Berger et al. (2003) Berger, E., Kulkarni, S. R., Pooley, G., et al. 2003, Nature, 426, 154
- Burrows et al. (2005) Burrows, D. N., Hill, J. E., Nousek, J. A., et al. 2005, Space Sci. Rev., 120, 165
- Evans et al. (2014) Evans, P. A., Willingale, R., Osborne, J. P., et al. 2014, MNRAS, 444, 250
- Gehrels et al. (2004) Gehrels, N., Chincarini, G., Giommi, P., et al. 2004, ApJ, 611, 1005
- Harrison et al. (2013) Harrison, F. A., Craig, W. W., Christensen, F. E., et al. 2013, ApJ, 770, 103
- Holland et al. (2012) Holland, S. T., De Pasquale, M., Mao, J., et al. 2012, ApJ, 745, 41
- Liang & Dai (2004) Liang, E. W., & Dai, Z. G. 2004, ApJ, 608, L9
- Mészáros (2006) Mészáros, P. 2006, Reports on Progress in Physics, 69, 2259
- Mészáros & Rees (2001) Mészáros, P., & Rees, M. J. 2001, ApJ, 556, L37
- Peng et al. (2005) Peng, F., Königl, A., & Granot, J. 2005, ApJ, 626, 966
- Piran (1999) Piran, T. 1999, Phys. Rep., 314, 575
- Piro et al. (2014) Piro, L., Troja, E., Gendre, B., et al. 2014, ApJ, 790, L15 (P14)
- Ramirez-Ruiz et al. (2002) Ramirez-Ruiz, E., Celotti, A., & Rees, M. J. 2002, MNRAS, 337, 1349
- Rao et al. (2014) Rao, A. R., Basak, R., Bhattacharya, J., et al. 2014, Research in Astronomy and Astrophysics, 14, 35
- Shao & Dai (2007) Shao, L., & Dai, Z. G. 2007, ApJ, 660, 1319
- Starling et al. (2012) Starling, R. L. C., Page, K. L., Pe’Er, A., Beardmore, A. P., & Osborne, J. P. 2012, MNRAS, 427, 2950
- Vlahakis et al. (2003) Vlahakis, N., Peng, F., & Königl, A. 2003, ApJ, 594, L23
- Zhang et al. (2004) Zhang, W., Woosley, S. E., & Heger, A. 2004, ApJ, 608, 365
- Zhang et al. (2003) Zhang, W., Woosley, S. E., & MacFadyen, A. I. 2003, ApJ, 586, 356