Detector for measuring the branching fraction
Abstract
The PIENU experiment at TRIUMF is aimed at a measurement of the branching ratio
= with precision 0.1%.
Incident pions, delivered at the rate of 60 kHz with momentum 75 MeV/c, were degraded and stopped in a
plastic scintillator target.
Pions and their decay product positrons were detected with plastic scintillators and tracked with multiwire proportional
chambers and silicon strip detectors. The energies of the positrons were measured in a spectrometer consisting of
a large NaI(T) crystal surrounded by an array of pure CsI crystals.
This paper provides a description of the PIENU experimental apparatus and its performance in pursuit of .
keywords:
NaI(T) , CsI , Scintillation detectors , Pion decay1 Introduction
Measurement of the branching ratio
compared to its precise Standard Model (SM) prediction provides a stringent test of the hypothesis of universality in weak interactions. The most recent experimental measurements of the branching ratio are
and
These measurements are in agreement with the prediction:
The order of magnitude gap in the precision of the experimental measurements and the theoretical prediction provides an opportunity to test the SM and to search for physics beyond it. Because of helicity-suppression of decay in the SM, helicity-unsuppressed contributions due to pseudoscalar or scalar couplings not present in the SM could result in a deviation of from the SM prediction. A measurement of with 0.1% precision can probe new physics at mass scales up to 1000 TeV for pseudoscalar interactions [6].
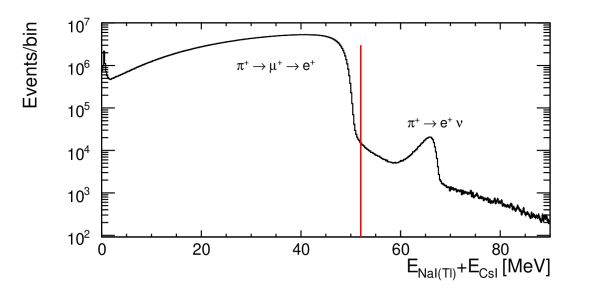
The PIENU experimental technique is based on observing positrons from decays of pions at rest in an active plastic scintillator target. Muons from the dominant decay, which have kinetic energy of 4.1 MeV and range of about 1 mm, were stopped in the target. By measuring the time and energy of positrons from the decays and following the decay ( decay chain), can be obtained after applying several corrections. Since the positrons from the decay are monochromatic ( = 69.3 MeV), and positrons from the decay chain have a three-body decay energy spectrum with highest positron kinetic energy cutoff at 52.3 MeV, the measured energy is used to separate the two decay modes. The raw branching ratio is extracted by performing a simultaneous fit of the time spectra of high energy (52 MeV) and low energy (52 MeV) samples to determine the yields of and decay chain events while taking backgrounds into account. Normalization factors, such as the solid angle of positron detection, cancel to first order, and the measured decay yields must be corrected for small energy-dependent effects, such as those from multiple Coulomb scattering, Bhabha scattering, and positron annihilation. For the final branching ratio determination additional corrections are applied including one which accounts for those decays excluded from the high energy time spectrum due to electromagnetic shower leakage and other effects. The latter correction and its systematic uncertainty were empirically determined from data and measurements of the response of the calorimetry system.
The PIENU detector had a solid angle acceptance555Acceptance was defined by two plastic scintillator counters located downstream of the pion stopping target. for positrons emitted from the stopping target of 25%, which is eight times higher than the previous TRIUMF experiment [2]. In addition to measuring , because of the increased acceptance and better energy resolution, the PIENU experiment was also able to perform a more sensitive search for heavy neutrinos in the decay [7].
2 Experimental overview
The TRIUMF cyclotron delivered a 500 MeV proton beam with an intensity of 120 A to a 12 mm thick beryllium pion production target. A positively charged beam of momentum MeV/c was collected at 135∘ and transported in vacuum in the upgraded M13 channel666The M13 beamline at TRIUMF was modified in order to reduce the positron contamination in the beam. [8] to the PIENU apparatus.
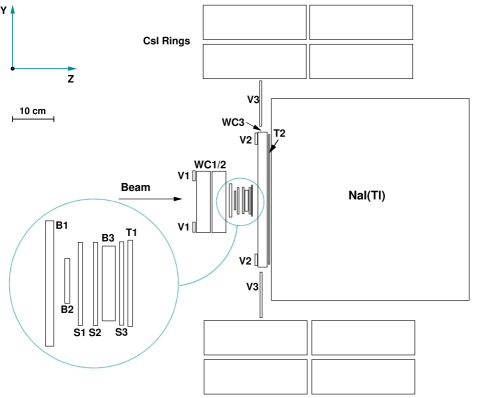
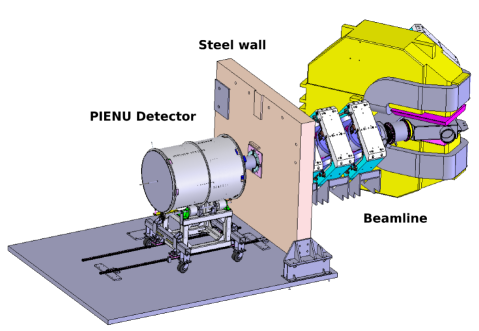
The PIENU apparatus, schematically shown in Figure 1, was placed immediately downstream of the exit of the M13 beamline. The end of the vacuum pipe was covered with a 101.6 mm diameter, 72.6 m-thick stainless steel window. To reduce the neutral background coming from the pion production target area and collimators in the beamline, a 24.8 cm-thick 2.57 2.29 m2 (width height) steel wall with a hole (26.67 cm diameter) for the beam pipe to go through was installed upstream of the detector assembly.
| Plastic scintillator counters | |||||
| Trigger Counters | B1 | B2 | B3 | T1 | T2 |
| Size in X (Inner radius) | 100 mm | 45 mm | 70 mm | 80 mm | (0) mm |
| Size in Y (Outer radius) | 100 mm | 45 mm | 70 mm | 80 mm | (171.45) mm |
| Size in Z | 6.604 mm | 3.07 mm | 8.05 mm | 3.04 mm | 6.6 mm |
| Z position | -39.03 mm | -30.02 mm | 0 mm | 19.92 mm | 72.18 mm |
| Photomultiplier model/ | H3178-51 | 83112-511 | XP2262B | 83112-511 | H3165-10 |
| manufacturer | Hamamatsu | Burle | Photonis | Burle | Hamamatsu |
| Photocathode diameter | 34 mm | 22 mm | 44 mm | 22 mm | 10 mm |
| Veto Counters | V1 | V2 | V3 | ||
| Inner radius | 40 mm | 107.95 mm | 177.8 mm | ||
| Outer radius | 52 mm | 150.65 mm | 241.3 mm | ||
| Size in Z | 3.175 mm | 6.35 mm | 6.35 mm | ||
| Photomultiplier model/ | H3164-10 | H3165-10 | |||
| Photomultiplier manufacturer | Hamamatsu | Hamamatsu | |||
| Photomultiplier Photocathode diameter | 8 mm | 10 mm | |||
| Tracking detectors | |||||
| Multi Wire Proportional Chambers | WC1 | WC2 | WC3 | ||
| Wire spacing | 0.8 mm | 2.4 mm | |||
| Number of Planes/wires/readout channels | 3/120/40 | 3/96/48 | |||
| Active area diameter | 96.0 mm | 230.4 mm | |||
| Cathode to Anode spacing | 1.6 mm | 2.0 mm | |||
| Wire diameter | 15 m | ||||
| Wire orientation | 0∘, +120∘, -120∘ | ||||
| Silicon Strip Detector Pair (X and Y oriented strips) | S1/S2/S3 | ||||
| Active area | 61 61 mm2 | ||||
| Silicon strip pitch | 80 m | ||||
| Effective pitch after binding 4 strips | 320 m | ||||
| Number of planes/readout channels per plane | 2/48 | ||||
| Thickness (size in Z) | 0.285 mm | ||||
| Separation between X and Y strip detectors | 12 mm | ||||
| Electromagnetic calorimeter | |||||
| Crystal | NaI(T) | CsI | |||
| Number used | 1 | 97 | |||
| Energy Resolution (FWHM) at 70 MeV | 2.2% | 10% | |||
| Thickness (size in Z) | 480 mm | 250 mm | |||
| Outer Radius | 480 mm | - | |||
| Approximate width height for pentagon shaped CsI crystals | - | 90 80 mm2 | |||
| Number of PMTs per crystal | 19 | 1 | |||
| Hamamatsu PMT model (central PMT for NaI(T) was R1911-07) | R1911 | R5543 | |||
| Photomultiplier Photocathde diameter | 76.2 mm | ||||
During normal data taking, the beam was composed of 84% , 14% and 2% . It was imaged by a circular multiwire proportional chamber package (WC1 and WC2, containing three wire planes each). Following WC2, the beam was degraded by two plastic scintillator counters B1 and B2 (beam counters) used for measuring time and energy loss for particle identification. The beam counters were followed by two pairs of Si strip detectors (S1 and S2) with strips oriented along the X and Y axes777A right-handed coordinate system is used with the origin at the center of the target counter. The Z-axis points in the beam direction, and the Y-axis points upwards.. An 8 mm thick plastic scintillator target (B3) was sandwiched between S2 and another X-Y Si strip pair (S3). A circular multiwire proportional chamber WC3, containing three wire planes, was positioned downstream of S3 and sandwiched between two plastic scintillators, T1 and T2 (telescope counters).
Incoming pions stopped in the center ( mm along the Z-axis) of B3, and then decayed at rest. A coincidence of signals from T1 and T2 was used to define the on-line positron acceptance. WC3 and S3 were used to reconstruct charged particle tracks and define the final acceptance off-line. The 15% solid-angle acceptance of the crystal spectrometer was defined by a radius cut (r=6 cm) in the central plane of WC3, which was located 5.5 cm downstream888Distance from the center of B3 to the central plane of WC3 of B3. Accepted decay products entered a large single crystal NaI(T) detector (48 cm long and 48 cm diameter) [9]. In order to absorb shower leakage from the NaI(T) crystal and to detect large angle photons from radiative decay, it was enveloped by four rings of pure CsI crystals [10]. The NaI(T) and CsI crystal array served as the calorimeter to measure the energy of the decay product positrons.
Three annular scintillators, which covered inactive material, were used for systematic studies: V1 covered the front frame of WC1, and V2 and V3 covered the frame of WC3 and the front flange of the NaI(T) crystal enclosure, respectively. Detector parameters are given in Table 1.
3 Design and construction
The experimental apparatus was constructed in modules (PIENU-I and PIENU-II) for simplification of installation and servicing. PIENU-I consisted of V1, WC1, WC2, B1, B2, S1, S2, B3, S3 and T1, while PIENU-II included WC3, T2, V2, V3, NaI(T) and CsI.
PIENU-I was attached to the end of the beam pipe and could be divided into three sub-assemblies (V1+WC1+WC2, B1+B2+S1+S2 and B3+S3+T1). The PIENU-II detector assembly was supported on a cart. During normal running conditions the cart rested on rails which were aligned with the beamline and PIENU-I in the X-Y plane. Modularity allowed a number of supplemental measurements to be performed aimed at evaluating systematic effects during data taking. One of the measurements was determination of the response of the NaI(T) and CsI crystal array to a beam of 70 MeV/c incident positrons at various positions and angles of entrance as described in Section 5.3. This measurement was made possible by leaving only the first sub-assembly of PIENU-I in place, containing V1+WC1+WC2, which detected the incoming beam, and removing the rails in order to allow the PIENU-II assembly to be moved freely within the experimental area.
In 2010, the experimental area was enclosed in a temperature-controlled tent in order to make temperature-related changes in detector’s performance negligible. The temperature inside the tent was kept at 20 C.
4 Scintillation counters
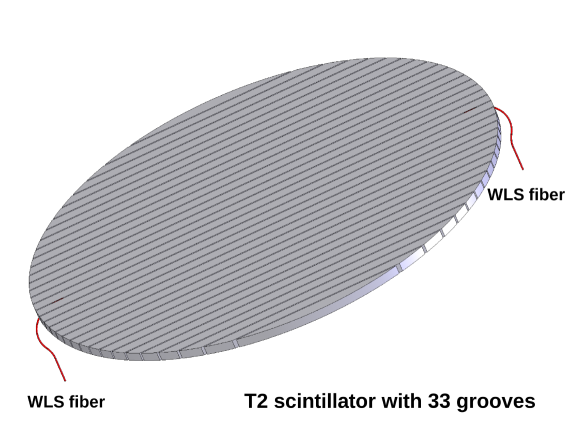
The plastic scintillators were fabricated from Bicron BC-408 (polyvinyltoluene) scintillator [11] chosen for its high light-output, fast rise (0.9 ns), and short decay (2.1 ns) times. The B1 beam scintillator was large enough to fully cover the aperture of the multiwire chamber package WC1 and WC2. The B2 scintillator, which was smaller than the B3 scintillator, ensured that the particles going through B2 would hit B3999The rectangular-shaped B3 and T1 counters were rotated by 45o around the beam axis due to spatial limitations of the mechanical assembly which supported the scintillator along with their respective light guides, photo multiplier tubes (PMTs), and a number of other subdetectors (WC1, WC2, S1, S2, S3).. T1, located downstream of B3, defined the positron timing. Due to space restrictions and their circular shape, T2 and the veto scintillators (V1-V3) were read out with 1 mm diameter wave-length-shifting (WLS) fibers (Kuraray Y-11) embedded in grooves (1.11.1 mm2 in cross-section) machined on the scintillator surfaces; groove spacing was 10 mm, 3 mm, 10 mm and 11 mm for T2, V1, V2 and V3101010T2 had linear parallel grooves traversing the counter’s surface, while annular veto counters V1,V2 and V3 had circular grooves. counters respectively.
Collection of the scintillation light for all the rectangular-shaped scintillators was done with adiabatic light guides which were cut from UV transparent acrylic sheets and polished. It was important to have a uniform light collection efficiency in order to maximize energy resolution. A schematic of the four-way readout configuration is shown in Figure 4. Simulations of the optical transport with Detect2000 [12] were used to predict the uniformity of the light collection in this configuration, and were later confirmed with measurements. For example, a variation of 1.2 was observed in the visible energy deposited by beam muons in B1 over the counter’s surface.
Each scintillator was read out with four photo-multiplier tubes (PMTs), except for V1, V2 and V3 which were each read out with a single PMT. PMTs were selected by photocathode size and ability to match either the 425 nm wavelength of the maximum emission of the Bicron-408 or the 476 nm wavelength of the emission peak of the WLS fibers. Information on the scintillator size and PMTs used is listed in Table 1. All plastic scintillator PMTs were read out with 500 MHz ADCs (see Section 7.2).
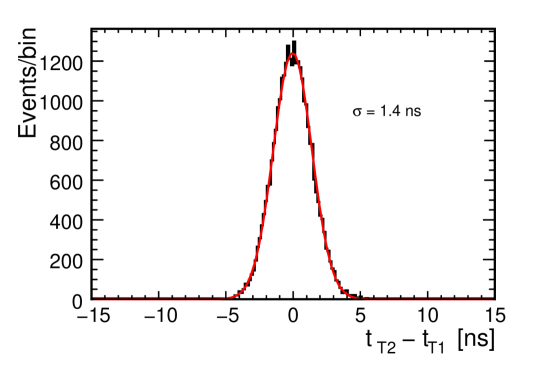
T2 was the largest scintillator read out with WLS fibers, having 33 parallel grooves machined on the downstream side. Near the edge of the counter, the grooves were made gradually deeper so that the WLS fibers lying in the grooves could exit perpendicular to the counter’s surface with minimum transition space and point upstream where they could be bundled and read out by PMTs (see Figure 4 for schematic of the T2 grooves). The minimum radius of the groove curvature at the edges of T2 was 19.5 mm. Fibers were thermally pre-bent to reduce stress. T2 fibers were read out on both ends, and bundled into two groups (1-16 and 17-33). As a result, T2 was read out using four PMTs. It had a time resolution of 1.4 ns for minimum ionizing particles when measured against T1 (see Figure 6) and its efficiency for positrons was measured to be greater than 99.7% within the acceptance region.
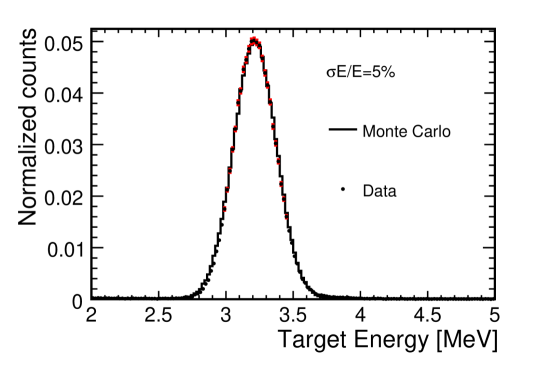
The most critical scintillation counter, B3, had an energy resolution
of 5% r.m.s. ( MeV) for 4.1 MeV
from decay
(see Figure 6). The time difference between T1 and B1 was used to determine the decay
time with a resolution of 138 ps for beam positrons.
Both T1 and B1 times were determined from fits of 500 MHz-sampling-frequency waveforms.
5 Calorimeter
The purpose of the PIENU calorimeter system was to detect decay positrons and photons from the and decays as well as from the and following the decay . It was composed of a large monolithic NaI(T) crystal surrounded by 97 pure CsI crystals. Scintillation light collection was realized through directly coupled PMTs.
5.1 NaI(T) crystal
The main calorimeter element was a single crystal of thallium-doped NaI on-loan from Brookhaven National Laboratory [9]. The crystal was enclosed in a 3 mm thick aluminum enclosure which had nineteen 76.2 mm diameter circular quartz windows at the rear end. The aluminum front face of the NaI(T) was 0.5 mm thick. Each window was viewed by a 76.2 mm diameter Hamamatsu R1911 PMT (with the exception of the central PMT R1911-07) surrounded by a -metal shield.
The surface of the crystal was covered with reflective material. An optical simulation was performed using Detect2000 [12] to study the dependence of the energy deposited in the crystal on the entrance location of the particle. Light emitted by the crystal was uniformly reflected111111For the simulation both specular and diffuse reflectors were modeled, with the reflection coefficient varying between 0.95 to 0.99 and a refractive index of 1.85 was assumed for the NaI(T) crystal., and thus a similar amount of light was seen by individual PMTs independent of the entrance position of the ionizing particle on the front face of the NaI(T) crystal. This was confirmed within 2% by bench tests using 511 KeV and 1274 KeV rays from a 22Na radioactive source. The calibration of the NaI(T) crystal was done with 75 MeV/c beam positrons using a dedicated trigger.
5.2 CsI crystal array
Each crystal within the CsI array was 25 cm (13.5 radiation lengths) long and had pentagonal shape, with average width of 9 cm and height of 8 cm (4.5 radiation lengths). The crystals were arranged to form two upstream and two downstream concentric layers around the NaI(T). Each concentric layer of crystals was supported by a 2 mm thick stainless steel cylinders with a 2-mm thick fin separating and supporting every 3-5 crystals from its neighbors (6 fins per layer). The resulting array of CsI crystals was 50 cm long and 16 cm (9 radiation lengths) thick in the radial direction. The CsI array was continuously flushed with nitrogen gas to keep the humidity level low. Each crystal was read out by a fine-mesh 76.2 mm diameter Hamamatsu R5543 PMT [13]121212The components of the magnetic background in the experimental area have been measured to be 2 Gauss at the location of the detector, well within the operational specifications of these fine-meshed PMTs. Before being brought to TRIUMF, the crystals and their PMTs were used as endcap photon-veto detector in the E949 experiment at BNL [14]. The pure CsI pulse shape has two components: fast and slow with 30 ns and 680 ns decay times, respectively. The fast component constitutes about 20% of the total pulse. In order to suppress the slow component, a UV-transmitting optical filter was present in front of each PMT. Each crystal had a YalO3:Ce245Am source [15] attached to its front face to monitor the crystal’s light output and the PMT’s gain. The source emits light at a frequency of 50 Hz with similar wavelength and pulse width as the CsI scintillation light with an equivalent energy deposit of MeV. Each crystal was also connected via a quartz fiber to the output of a Xe lamp whose flash was triggered at 2 Hz during data taking. This Xe lamp system was implemented to monitor CsI PMT’s gains. Seven reference PMTs of the same type as the ones used for the calorimeter were enclosed in an incubator maintained at a constant temperature of 24.0 ∘C. The Xe lamp was enclosed in an identical incubator at the same temperature. The Xe-lamp was connected to the reference PMTs through the same system as the CsI crystals so that any changes in the Xe-lamp output could be tracked by the reference PMTs131313The Xe lamp system was found to be stable to less than 1% level and was used for monitoring. Since the whole experimental apparatus was enclosed in the temperature controlled tent, no temperature-dependent variations in the PMT gains were observed, while the PMT gain degradation over time was on the order of 1% per year..
The energy calibration of the CsI array was performed with cosmic rays. A dedicated trigger, based on coincidence of the two concentric CsI rings, provided a sample of cosmic ray data. The energy peak due to minimum ionizing muons going through the crystals was compared with a detailed Monte Carlo (MC) simulation of the system to obtain the energy calibration.
5.3 Performance
NaI(T): the response of the NaI(T) crystal was investigated by reconfiguring the detector to include PIENU-II and only the first sub-assembly of PIENU-I (V1, WC1, and WC2).
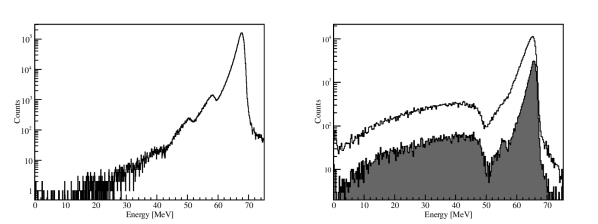
The response of the crystal to a 70 MeV/c positron beam entering its front face at the center is shown in Figure 7 (left). The high energy peak corresponds to the full energy of the beam positrons. After deconvoluting the beam momentum width of %, the resolution at 70 MeV/c was 2.2% (FWHM). Below the beam energy, additional structures are visible [16] due to nuclear photoabsorption and subsequent neutron escape. In this process, one or more photons in the shower initiated by the positron are absorbed by iodine and neutrons emitted after the absorption escape the crystal reducing the measured energy by the neutron binding energy of approximately 8 MeV. Structures corresponding to up to three escaping neutrons can be seen in Figure 7 (left). This mechanism was consistent with a MC simulation of the crystal response including electromagnetic and hadronic interactions [16].
Photonuclear effects are also present when measuring the decay positrons. An energy spectrum of the decay positrons with a small (15%) contamination of positrons from the decay chains is shown in Figure 7 (right), where the presence of a structure due to one-neutron escape below the main peak (see also [7]) is evident.
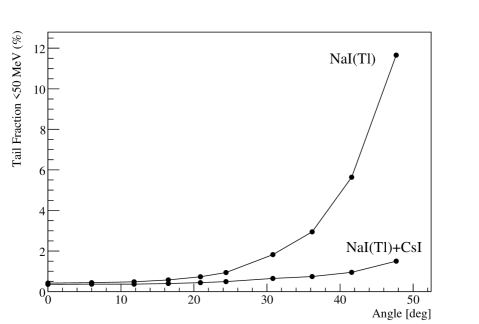
CsI Array: The purpose of the CsI array was the collection of the electromagnetic shower leakage from the main NaI(T) calorimeter. A critical part of the PIENU experiment was the reduction and measurement of the low energy tail from the decay to reduce systematic uncertainties in the correction for events buried under the decay chain energy distribution. During the measurement of the calorimeter response a positron beam was used to investigate the fraction of the low energy tail as a function of the angle between the beam and the NaI(T) crystal face. The crystal face was rotated to 10 different angles (up to 48o) with respect to the beam. The results are shown in Figure 8 where the fraction of events below 50 MeV (tail fraction) is reported as a function of the angle. When only the energy of the NaI(T) crystal is considered, the low energy tail fraction reaches % for the highest angle, while if the CsI energy is added, the fraction never exceeds 2% over the whole angular range.
6 Tracking devices
The beam wire chambers WC1 and WC2 were used to track the incoming pions (see Figure 9).Together with the two X-Y planes of silicon strip detectors (S1 and S2) they could detect pion decay-in-flight events upstream of the target (see §6.3). The downstream trackers (S3 and WC3) were used to track the decay positrons after the target. The reconstructed track’s position at the center plane of WC3 was used to define the acceptance of the positrons at the entrance of the calorimeters. Upstream (WC1, WC2, S1, and S2) and downstream (S3 and WC3) tracker information was also used to reconstruct the position of the pion’s decay vertex in the target. WC3 was also used to detect pile-up events which were not detected by the upstream trackers or S3 which had smaller recording time windows (see Section 7.2).
6.1 Multiwire proportional chambers
Each wire chamber (WC1, WC2 and WC3) consisted of three wire planes which were rotated by an angle of 120∘ with respect to each other. The chambers were filled with a tetrafluoromethane (CF4) - isobutane (C4H10) mixture (80% - 20%) at atmospheric pressure. Each wire plane of WC1 and WC2 had 120 wires (0.8 mm in pitch) grouped by three. Each group was connected to a read-out pad. The number of read-out channels was 40 per plane. The active diameters of WC1 and WC2 were 9.6 cm. The chamber WC3, mounted on the flange of the NaI(T) crystal enclosure, measured the position of the decay positrons at the entrance of the calorimeter, and defined the acceptance region. Each plane had 96 wires with a pitch of 2.4 mm. The wires were grouped in pairs which reduced the number of channels to 48. The active diameter of WC3 was 23 cm. The efficiency of every plane was measured to be 99% for beam positrons.
6.2 Silicon strip detectors
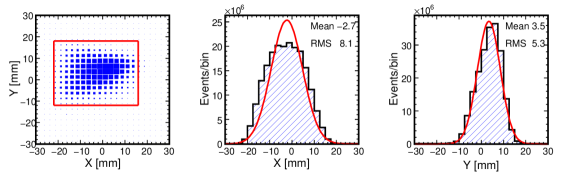
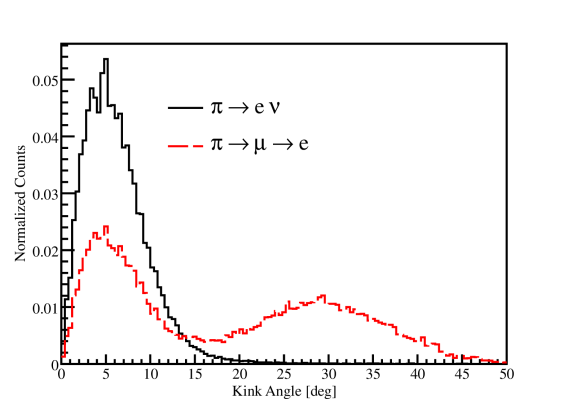
Each set of silicon strip detectors (S1, S2, and S3) consisted of two identical hybrids fixed back to back with perpendicular orientation of strips (to measure X and Y coordinates). Each silicon detector had an active volume of . The Si sensor was a single sided AC-coupled micro-strip detector. In the original design [17], strips had a pitch of 80 m but since the required resolution for the PIENU experiment was of the order of 300 m, four strips were bound to one read-out line. For further reduction of the number of readout channels, the readout lines were interconnected with capacitors and only every fourth line was read out by an amplifier as shown in Figure 10.
Forty eight channels per silicon plane (288 channels in total) were read out. The capacitive network formed a
charge division line where the reconstruction of the ionization amplitude and position was made by weighting
of two or three channels that typically had a signal due to a charged particle traversing the sub-detector.
The final position resolution (rms) provided by each silicon plane was 95 m if at least two readout
channels had a signal and 370 m when the signal was recorded in only one readout channel. In order to reduce
the data size, a hardware threshold was set to suppress channels with no hits. In S1 and S2, the thresholds
were optimized for the detection of pions while the S3 thresholds were set lower to ensure that the detection
efficiency for decay positrons in at least one plane (X or Y) was higher than 99%.
6.3 Performance
This compact assembly of tracking devices was designed to minimize the major source of background for the measurement of decay due to decay of pions in flight. About 3.6% of the pions entering the PIENU detector141414This result is obtained from the Geant4 simulation. A pion is denoted as entering the detector if it enters the first detector element WC1 decay in flight upstream or inside the target. This type of decay, labeled pion-DIF for pion decay-in-flight, will have a low energy deposit in the target and can therefore mimic the energy deposition of a decay. About half of those pion-DIF events happen upstream of the target, between WC2 and S1, and can be identified by the tracking detectors as illustrated in Figure 11.

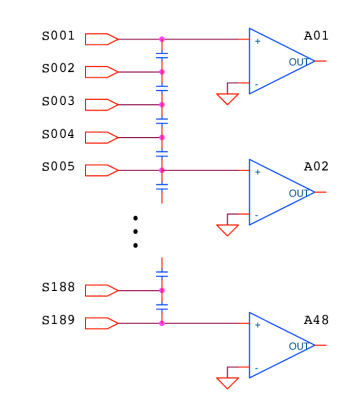
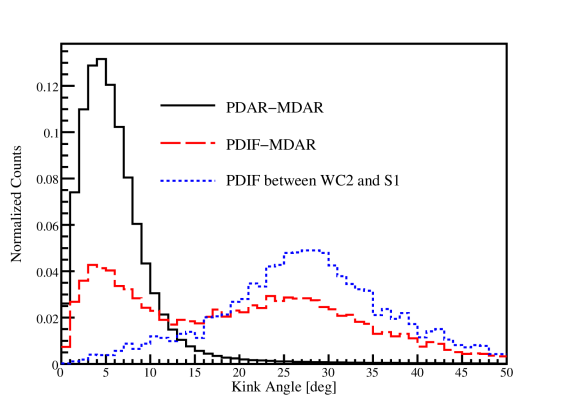
The distributions of the angle (kink angle) between the track detected by WC1 and WC2 and the track detected by S1 and S2 for different decay types are shown in Figure 13 for MC and on Figure 13 for data. Pion-DIF events between WC2 and S1 can be distinguished due to their higher kink angle.
7 Trigger and data acquisition system
7.1 run trigger
Pions and a fraction of beam muons and positrons (used for the calibration of some detectors) were selected by the trigger using energy deposit information in B1. Definition of a beam particle was done by requiring the coincidence of the beam counters B1, B2, and B3. A coincidence of T1 and T2 counters defined the decay-positron signal. A coincidence of beam pion and decay positron signals (PIE) within a time window of –300 ns to 500 ns was the basis of the main trigger logic. Since decays happen much more often than decays, a Prescale trigger precisely selected only 1/16 of PIE events. Meanwhile, the events were enhanced by the Early and HE (High Energy) triggers. The Early trigger selected decays which happened between 2 ns and 40 ns (excluding prompt events) after the pion stop. Due to the 26 ns pion lifetime, more than 70% of the events happen within this time range. The HE trigger was based on a VME-module which summed the energy deposited in the calorimeters in real time. The trigger signal was produced by this module for events which had a high energy deposited in the NaI(T) and CsI spectrometers. The energy threshold was set 4 MeV below the highest energy of the positron from the decay chain. Almost all the events (with the exclusion of the tail events which extend below the energy spectrum from the decay chain) were selected by this trigger. Those three triggers constituted the “physics triggers”. Additional triggers were used for data quality checks and calibration purposes. The Xe-lamp trigger provided flashes twice a second to all CsI crystals. Both these triggers (Xe-lamp and Cosmic) were intended for CsI calibration and monitoring. Finally, the Beam positron trigger triggered on one of every 32 beam positrons to calibrate the NaI(T) crystal. During a run, all 6 triggers were used and several of them could be satisfied at the same time. The rates of the various triggers are shown in Table 2. The trigger signal issued by any of the six triggers was then latched by the pion (t) and the positron (t) timings in order to reference the gate of the data acquisition modules to the incoming and decay particles, respectively. These latched signals triggered the data acquisition. T was used to trigger the data acquisition by the VME modules (VF48 and VT48, which are described below) while T triggered the COPPER data acquisition, described below.
| Trigger | Rate [Hz] |
|---|---|
| Pion stop in target | 5104 |
| Physics triggers | |
| Early trigger | 160 |
| HE trigger | 170 |
| Prescale trigger | 240 |
| Other triggers | |
| Cosmics trigger | 15 |
| Beam Positron trigger | 5 |
| Xe lamp trigger | 2 |
| Total Triggers | 600 |
7.2 Data acquisition system
COPPER: This 500-MHz-sampling-frequency Flash ADC (FADC) system was based on the COPPER (COmmon Pipelined Platform for Electronics Readout) platform. The detailed characteristics of the COPPER system have been described in Refs.[18, 19]. The PIENU experiment was equipped with four COPPER boards151515An additional COPPER board was installed during the 2012 run to record partial analog sums of the CsI crystal PMTs. to digitize the signals coming from the 23 PMTs reading out the plastic scintillators, analog sum of NaI(T) PMTs, and partial analog sums of CsI array PMTs. The time window of the signals recorded by COPPER covered 7.74 s (1.35 s after and 6.39 s before the pion stop) to be able to detect pre- and post-pile up particles. The waveforms recorded by COPPER were fitted, on an event-by-event basis, using templates obtained from a spline interpolation of the average PMT pulse shape.
VF48: The VF48 is a 48 channel 60 MHz FADC [20]. It has a resolution of 10 bits and a dynamic range of 250 mV. All the NaI(T) and the CsI PMT signals as well as all the silicon strip channels were read out by VF48 modules. This made a total of 404 channels (NaI(T): 19, CsI: 97, silicon strips: 288) read out by 10 VF48 modules). Typically, the VF48 read out 40 samples around the time defined by the decay positron. All VF48 modules were fed with the same 20-MHz clock provided by another VME module. This clock was multiplied internally in the VF48 to reach 60-MHz sampling. Data suppression was implemented in all channels except those reading the NaI(T) crystal PMTs. Additionally, due to the slow NaI(T) response, its waveforms were digitized at a rate of 30 MHz instead of 60 MHz.
VT48: Discriminated signals from the three wire chambers (WC1, WC2, and WC3), all the logic signals issued by the PMT signals after discrimination, and most trigger logic signals were read out by multi-hit time-to-digital converter [21]. This device, based on the AMT-2 chips [22], has a 25-MHz on-board clock which is multiplied to achieve 0.625 ns resolution. All VT48s, however, were fed with an external 25-MHz clock to ensure the synchronization of modules. One board can read out 48 channels for up to 20 s. To optimize the dead-time, only two channels were read out for 20 s to detect long-lifetime backgrounds originating from the beam while all other channels were read out 4.0 s before and after the time defined by the decay positron signal in T1. In total, 11 VT48 modules were used in the experiment.
The PIENU data acquisition system consisted of three VME crates (two VMEs hosted the VF48 and VT48 modules while the third mostly ran slow control modules and modules used by the COPPER system) controlled by VME master modules, and four COPPER boards with a processor on each board. Each processor was running the associated front end programs to transfer the data to a host computer. Collection of the data was done by the MIDAS data acquisition system which incorporates an integrated slow control system with a fast online database and a history system [23]. The MIDAS server computer can be controlled via a web interface. All the information and errors from the DAQ modules were issued on the web page and programs checking the quality of the data online were connected to MIDAS during data taking.
8 Conclusion
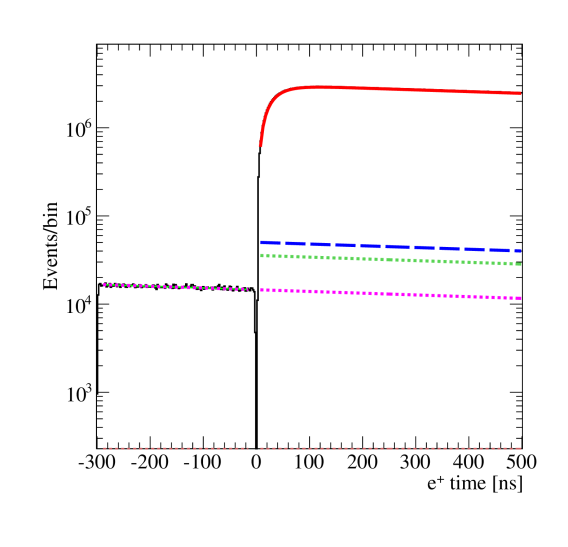
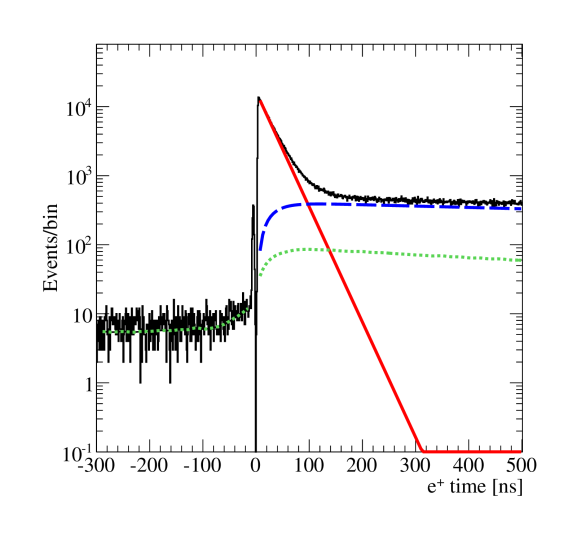
The PIENU detector was commissioned in 2009 and was operated during physics and supplemental measurements including NaI(T) response measurements until the end of 2012. The branching ratio will be determined from the observed numbers of and events. The summed energy in the NaI(Tℓ) and CsI array for events in the time window -300 to +500 ns in relation to the pion stop time is shown in Fig. 16 where the energy spectrum is divided into two regions at 52 MeV: low-energy events dominated by decays, and high-energy events dominated by decays. The time spectra for these two regions shown in Figs. 16 and 16 are used to determine the raw branching ratio taking into account various background components such aspile-up hits from previous muon decays, and pion decays-in-flight. The is then determined after various corrections are made (See Section 1). The excellent performance of the crystal array and tracking array, paired with good time resolution achieved in plastic scintillators (B1, T1) were important aspects of the PIENU apparatus ensuring the possibility of a successful measurement of and improved searches for heavy neutrinos [7].
9 Acknowledgment
We wish to thank P. Amaudruz, R. Bula, S. Chan, M. Constable, C. Lim, N. Khan, R. Kokke, P. Lu, K. Olchanski, R. Openshaw, C. Pearson and R. Poutissou for their contributions to the engineering, installation and commissioning of the detector and DAQ-related work. We are also grateful to Brookhaven National Laboratory for providing the NaI(T) and CsI crystals. This work was supported by the Natural Science and Engineering Council (NSERC) and the National Research Council of Canada through its contribution to TRIUMF and supported by JSPS KAKENHI Grant Number 18540274, 21340059, 24224006.
References
- [1] D. I. Britton, et al., Measurement of the branching ratio, Phys.Rev.Lett. 68 (1992) 3000–3003.
- [2] D. I. Britton, et al., Measurement of the branching ratio, Phys.Rev. D49 (1994) 28–39.
- [3] G. Czapek, et al., Branching ratio for the rare pion decay into positron and neutrino, Phys.Rev.Lett. 70 (1993) 17–20.
- [4] W. J. Marciano, A. Sirlin, Radiative corrections to decays, Phys.Rev.Lett. 71 (1993) 3629–3632.
- [5] V. Cirigliano, I. Rosell, /K e branching ratios to in Chiral Perturbation Theory, JHEP 0710 (2007) 005.
- [6] D. Bryman, W. J. Marciano, R. Tschirhart, T. Yamanaka, Rare kaon and pion decays: Incisive probes for new physics beyond the standard model, Ann.Rev.Nucl.Part.Sci. 61 (2011) 331–354.
- [7] M. Aoki, et al., Search for Massive Neutrinos in the Decay , Phys.Rev. D84 (2011) 052002.
- [8] A. A. Aguilar-Arevalo, et al., High Purity Pion Beam at TRIUMF, Nucl.Instrum.Meth. A609 (2009) 102–105.
- [9] G. Blanpied, et al., Transition from Simultaneous Measurements of and , Phys.Rev.Lett. 79 (1997) 4337–4340.
- [10] S. Adler, et al., Measurement of the branching ratio, Phys.Rev. D77 (2008) 052003.
- [11] Bicron BC-408 Specifications sheet (1998).
- [12] F. Cayouette, et al., DETECT2000: An Improved Monte-Carlo Simulator for the Computer Aided Design of Photon Sensing Devices, IEEE Trans.Nucl.Sci. 49 (2002) 624–628.
- [13] T. Komatsubara, et al., Performance of fine mesh photomultiplier tubes designed for an undoped CsI endcap photon detector, Nucl.Instrum.Meth. A404 (1998) 315–326.
- [14] I. H. Chiang, et al., CsI endcap photon detector for a experiment at BNL, IEEE Trans.Nucl.Sci. 42 (1995) 394–400.
- [15] M. Kobayashi, et al., YAlO3: Ce-Am light pulsers as a gain monitor for undoped CsI detectors in a magnetic field, Nucl.Instrum.Meth. A337 (1994) 355–361.
- [16] A. A. Aguilar-Arevalo, et al., Study of a Large NaI(Tl) Crystal, Nucl.Instrum.Meth. A621 (2010) 188–191.
- [17] A. Abdesselam, et al., The barrel modules of the ATLAS semiconductor tracker, Nucl.Instrum.Meth. A568 (2006) 642–671.
- [18] Y. Igarashi, et al., A common data acquisition system for high-intensity beam experiments, IEEE Trans.Nucl.Sci. 52 (2005) 2866–2871.
- [19] K. Yamada, et al., Pion decay-mode tagging in a plastic scintillator using COPPER 500-MHz FADC, IEEE Trans.Nucl.Sci. 54 (2007) 1222–1226.
- [20] J. P. Martin, P. A. Amaudruz, A 48 channel pulse shape digitizer with DSP, IEEE Trans.Nucl.Sci. 53 (2006) 715–719.
- [21] C. Ohlman, 48-Channel Time-to-Digital (TDC) Module. User’s manual. Unpublished.
- [22] Y. Arai, Y. Kurumisawa, T. Emura, Development and a SEU test of a TDC LSI for the ATLAS muon detector, KEK-PREPRINT-2001-123 (2001) 185–189.
-
[23]
S. Ritt, P. A. Amaudruz, The MIDAS Data
Acquisition System.
URL http://midas.triumf.ca