Temporal evolution of chromospheric evaporation: case studies of the M1.1 flare on 2014 September 6 and X1.6 flare on 2014 September 10
Abstract
With observations from the Interface Region Imaging Spectrograph (IRIS), we track the complete evolution of 11 MK evaporation flows in an M1.1 flare on 2014 September 6 and an X1.6 flare on 2014 September 10. These hot flows, as indicated by the blueshifted Fe xxi 1354.08Å line, evolve smoothly with a velocity decreasing exponentially from 200 km s-1 to almost stationary within a few minutes. We find a good correlation between the flow velocity and energy deposition rate as represented by the hard X-Ray flux observed with the Reuven Ramaty High Energy Solar Spectroscopic Imager (RHESSI), or time derivative of the soft X-Ray flux observed with the Geostationary Operational Environmental Satellites (GOES) and the HINODE X-ray Telescope (XRT), which is in general agreement with models of nonthermal electron heating. The maximum blue shift of Fe xxi appears approximately at the same time as or slightly after the impulsive enhancement of the ultraviolet continuum and the Mg ii 2798.8Å line emission, demonstrating that the evaporation flow is closely related to heating of the lower chromosphere. Finally, while the hot Fe xxi 1354.08Å line is entirely blueshifted with no obvious rest component, cool chromospheric and transition region lines like Si iv 1402.77Å are often not entirely redshifted but just reveal an obvious red wing enhancement at the ribbons, suggesting that the speed of chromospheric condensation might be larger than previously thought.
1 Introduction
Solar flares are among the most intense energy release events in the solar atmosphere. In the standard flare model (Carmichael, 1964; Sturrock, 1966; Hirayama, 1974; Kopp & Pneuman, 1976), energy released from magnetic reconnection first heats the plasma and accelerates particles in the corona. The released energy is then transported along the newly reconnected flare loops towards the chromosphere through either thermal conduction or nonthermal electrons, which results in an intense and rapid heating of the chromospheric material up to a temperature on the order of 10 MK. The chromospheric heating is revealed through bright flare ribbons in images of H and UV continuum. At the same time the nonthermal electrons can produce hard X-Ray (HXR) emission through bremsstrahlung with the thermal ions. The overpressure associated with the chromospheric heating drives the heated plasma upward to fill the flare loops. This so-called ”chromospheric evaporation process” has been proposed to explain the soft X-Ray (SXR) emission which usually peaks after the HXR peak (e.g., Neupert, 1968). In the impulsive phase of some flares the time history of HXR flux has been found to closely match the derivative of SXR light curve. This relationship is called the Neupert effect and is often quoted as a manifestation of chromospheric evaporation (e.g., Hudson, 1991; Dennis & Zarro, 1993; Veronig et al., 2005; Liu et al., 2006).
There have been only a few broad-band imaging observations of chromospheric evaporation (Silva et al., 1997; Liu et al., 2006; Ning et al., 2009; Nitta et al., 2012; Zhang & Ji, 2013). These authors found X-Ray sources moving towards the loop top during the impulsive phase of the flares and interpreted them as thermal emission at the evaporation front or nonthermal emission due to decreasing stopping distance from the loop top caused by the increasing density. Most of our knowledge about chromospheric evaporation is based on spectroscopic observations, probably because spectroscopy is the best way to observe vertical flows in on-disk observations. The most direct spectral signature of the evaporation flow should be the blue shift of hot emission lines. Indeed, early observations by the X-Ray spectrometers mounted on the P78-1, the Solar Maximum Mission and the Yohkoh spacecraft have detected blueshifted components of SXR emission lines formed at temperatures of 8–25 MK (Doschek et al., 1980; Feldman et al., 1980; Antonucci et al., 1982; Mariska & Doschek, 1993), indicating the presence of hot and fast (up to 400 km s-1) plasma upflows. Enhancement in the blue wing of the Fe xxi 1354.08Å line indicating an upflowing component at a speed of 200 km s-1 was also detected by the Ultraviolet Spectrometer and Polarimeter (UVSP) on board the Solar Maximum Mission (Mason et al., 1986). In all these observations, there is a dominant stationary emission component which likely results from the surrounding stationary hot plasma in the flare loops.
Observations from the Coronal Diagnostic Spectrometer (CDS, Harrison et al., 1995) on board the Solar and Heliospheric Observatory (SOHO) have greatly improved our understanding of chromospheric evaporation. For example, Brosius (2003) detected blueshifted line profiles from the O iii, O v, Mg x and Fe xix ions early during the impulsive rise of a flare. He also found that all lines except the Fe xix line subsequently exhibited multiple components, indicating downflows resulting from cooling of the heated plasma. Harra et al. (2005) reported two ”ribbons” where the Fe xvi and Fe xix line profiles exhibited blue shifts of a few tens km s-1. These two ”ribbons” were found to separate with time, which was interpreted as a signature of chromospheric evaporation in sequentially reconnected loops. Blue shifts of some transition region lines have also been found before the impulsive phase of some flares (Brosius & Phillips, 2004; Harra et al., 2005). The early evaporation flow has been proposed by Harra et al. (2005) to support the breakout model of coronal mass eruption (Antiochos et al., 1999), where magnetic reconnection starts before the filament eruption. Milligan et al. (2006a) and Milligan et al. (2006b) presented examples of gentle and explosive evaporation (e.g., Fisher et al., 1985b) in the impulsive phase of flares, respectively. In the former case, heating by relatively low flux of nonthermal electrons leads to evaporated plasma upflows at several tens km s-1 with no associated downflows. In the latter case, heating by relatively high flux of electrons leads to an overpressure which results in both an upward expansion of the hot plasma at several hundred km s-1 (230 km s-1 blue shift of Fe xix 592.23Å) and a downward condensation of the cooler material at several tens km s-1 (40 km s-1 red shift of He i 584.33Å and O v 629.73Å). Del Zanna et al. (2006) also found that the Fe xix 592.23Å line was largely blueshifted by 140 km s-1 in an explosive evaporation. The Fe xix blue shift was found to be 80 km s-1 in two flares studied by Falchi et al. (2006) and Raftery et al. (2009). The Fe xix 592.23Å line appears to be entirely blueshifted in many of these CDS observation. However, as pointed by Young et al. (2013), this is likely because the low spectral resolution of CDS blurs the multiple components of the line. Indeed, Fe xix 592.23Å line profiles with both a nearly stationary component and a highly blueshifted (by 200 km s-1) component were identified in a few flares (Teriaca et al., 2003, 2006; Milligan et al., 2006b). Coronal upflows at a speed of several tens of km s-1 have also been found by CDS in the late gradual phase of a flare (Czaykowska et al., 1999). These upflows have been suggested to result from chromospheric evaporation driven by thermal conduction (Czaykowska et al., 2001).
With observations of the EUV imaging spectrometer (EIS, Culhane et al., 2007), our knowledge about chromospheric evaporation has been further enhanced in the past 6 years. EIS has a better coverage of the coronal temperatures over CDS and allows study of the temperature dependent behavior of the evaporation flows. Although different patterns of evaporation flows have been found in different flares and even at different pixels within the same ribbon, two surprising results appear to be reported for many flares. First, profiles of hot lines from Fe xxiii (formed at 14 MK) and Fe xxiv (formed at 18 MK) usually exhibit a blueshifted component or blue wing enhancement besides a nearly stationary component, (e.g., Milligan & Dennis, 2009; Young et al., 2013), which is not consistent with single flare loop models (e.g., Emslie & Alexander, 1987; Liu et al., 2009a) and may be explained by an ensemble of sequential heating of many small-scale threads (e.g., Warren & Doschek, 2005; Reeves et al., 2007). This result suggests that the spatial resolution of EIS (3′′) is insufficient to separate the evaporation flow from the ambient stationary hot plasma. The velocities associated with the blueshifted components can be as high as 400 km s-1. In some flares blueshifted components are even present in profiles of warm lines such as Fe xiii, Fe xiv, Fe xv and Fe xvi (formed at 1.5–3 MK, Watanabe et al., 2010; Del Zanna et al., 2011; Li & Ding, 2011; Graham et al., 2011). The velocities inferred from the profiles of these warm lines are mostly less than 150 km s-1. In most cases the stationary component is dominant, although a dominant blueshifted component has also been reported in a few flares (Watanabe et al., 2010; Li & Ding, 2011; Young et al., 2013). We note, however, completely blueshifted Fe xxiii line profiles were identified occasionally in a few flares (Brosius, 2013; Doschek et al., 2013). Second, in explosive evaporations the temperature at which the Doppler shift turns from red to blue appears to be much higher than those predicted by some models. For example, the model of Fisher et al. (1985a) predicts a condensation of plasma in the chromosphere. However, EIS observations often show a few tens km s-1 redshift of emission lines formed at much higher temperatures. For example, Milligan & Dennis (2009) and Young et al. (2013) found that the transition occurs in the temperature range of 1.5-2.0 MK and 1.1-1.5 MK, respectively. A high transition temperature of 0.8 MK was reported even in a small B1.4 flare (Chen & Ding, 2010). A recent model of Liu et al. (2009a) shows that continuous energy deposition throughout the impulsive phase can heat the underlying chromosphere up to 2 MK, which may explain the observed red shifts of some coronal lines. Besides the Doppler shift, the nonthermal line broadening associated with the evaporation flow has also been investigated using EIS data. Significant nonthermal broadening (100 km s-1, FWHM) has been found for the hot Fe xxiii and Fe xxiv lines (Milligan, 2011; Young et al., 2013). Milligan (2011) also found a positive correlation between the blue shift and nonthermal width for the Fe xv and Fe xvi lines at one loop footpoint.
With the launch of the Interface Region Imaging Spectrograph (IRIS, De Pontieu et al., 2014), chromospheric evaporation can now be observed at unprecedented high spatial (0.33′′), spectral (3 km s-1) and temporal (3 s) resolution. Although there is only one line, Fe xxi 1354.08Å (formation temperature 11 MK from CHIANTI, Landi et al. (2013)), formed above 2 MK in the IRIS spectral range, significant new insight about chromospheric evaporation has already been revealed from IRIS observations. The most intriguing finding is the completely blueshifted Fe xxi 1354.08Å line profiles in the evaporation flows, which suggests that the resolution of IRIS is high enough to fully resolve the evaporation flows. The reported blue shift of the Fe xxi 1354.08Å line appears to be mostly around 100 km s-1 or smaller (Young et al., 2015; Li et al., 2015; Polito et al., 2015; Sadykov et al., 2015), although a clear 260 km s-1 blue shift was reported in a C1.6 flare (Tian et al., 2014a). These subarcsecond-resolution observations often reveal a spatial offset between the continuum enhancement and the blueshifted Fe xxi emission, which is likely due to the fact that the hot evaporation flows are located higher in the loop legs. Polito et al. (2015) also found a decrease of both the blue shift and nonthermal line width of Fe xxi, although only six data points were measured due to the 75 s cadence of the raster scans.
Here we report results from IRIS sit-and-stare observations of chromospheric evaporation in two flares. With a cadence of 9.5 s, we track the complete evolution of hot (11 MK) evaporation flows in the M1.1 flare on 2014 September 6 and the X1.6 flare on 2014 September 10. With simultaneous observations from the Reuven Ramaty High Energy Solar Spectroscopic Imager (RHESSI, Lin et al., 2002), the Geostationary Operational Environmental Satellites (GOES) and the X-ray Telescope (XRT, Golub et al., 2007) on board Hinode, we also investigate the possible correlation of the flow velocity with the energy deposition rate and chromospheric heating. Our observations reveal new insight into the chromospheric heating and evaporation processes during flares.
2 The M1.1 flare on 2014 September 6
2.1 Observations and data reduction
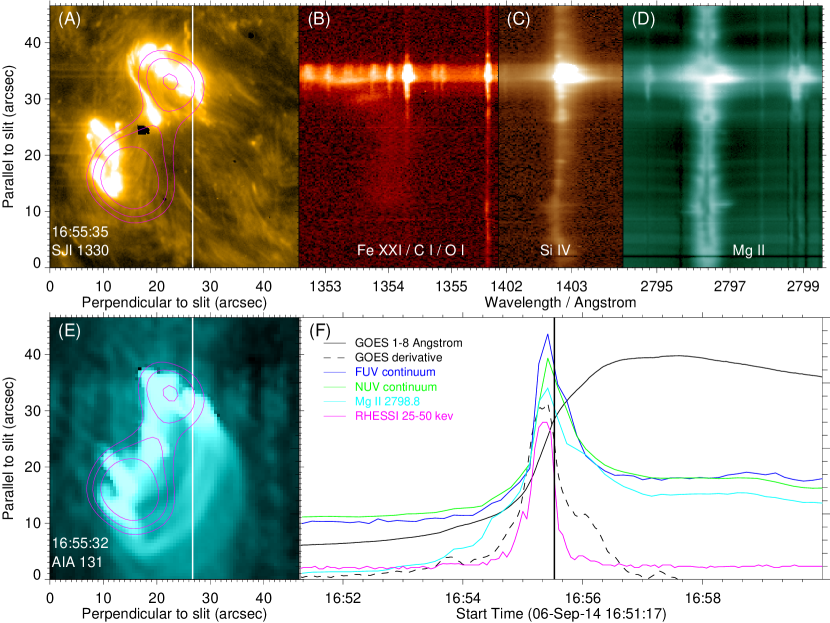
An M1.1 flare occurred in NOAA AR12157 at about 17:00 UT on 2014 September 6. Two peaks are present in the GOES SXR light curves, suggesting two episodes of energy release in this flare. Here we focus on the first episode from roughly 16:51 UT to 17:00 UT, when the plasma heating process was clearly observed by the IRIS slit at one footpoint of the flare loops. In this observation IRIS pointed at (–732′′, –299′′), with a roll angle of 45 degrees. The slit was fixed at the same location on the Sun throughout the whole observing period (sit-and-stare, 11:23 UT – 19:30 UT). The spatial pixel size was 0.166′′. The spectral dispersion was 0.026 Å per pixel in the far ultraviolet (FUV) wavelength bands (FUV spectrally summed by 2) and 0.025 Å per pixel in the near ultraviolet (NUV) wavelength band. The cadence of the spectral observation was 9.5 seconds, with an exposure time of 8 seconds. Slit-jaw images (SJI) were taken at a cadence of 19 seconds in each of the 1400Å and 1330Å passbands, and the exposure time decreased from 8 seconds to 2.4 seconds after 16:55:15 UT. Dark current subtraction, flat field correction, geometrical and orbital variation corrections have been applied in the level 2 data used here. Several relatively strong neutral lines have been used for absolute wavelength calibration, e.g., O i 1355.5977Å, S i 1401.5136Å and Mn i 2801.908Å. These lines were assumed to be at rest outside the flare regions. The fiducial marks were used to achieve a coalignment of the two SJI passbands and different spectral windows. Figure 1(A)-(D) shows the IRIS SJI 1330Å image and spectral images in three wavelength windows at 16:55:35 UT.
The 131Å passband of the Atmospheric Imaging Assembly (AIA, Lemen et al., 2012) on board the Solar Dynamics Observatory (SDO, Pesnell et al., 2012) samples emission mainly from Fe xxi in flares (e.g., O′Dwyer et al., 2010). We use images of this passband for the examination of the flare loop morphology (Figure 1(E)). We notice that early during the impulsive phase this passband is likely dominated by Fe viii lines (Boerner et al., 2012; Brosius & Holman, 2012). We rotated the AIA images by 45 degrees to match the IRIS spacecraft orientation. We coaligned the AIA 1600Å (mainly FUV continuum and C iv) and IRIS 1330Å (mainly FUV continuum and C ii) images. AIA 131Å images were then automatically aligned with the IRIS images since AIA images in different passbands are automatically coaligned after applying the standard SolarSoft (SSW) routine aia_prep.pro. The cadence of the AIA 131Å images is 12 seconds.
RHESSI data is also available for this flare. The RHESSI 25–50 keV image reconstructed with the CLEAN algorithm using detectors 2–8 from 16:55:00 UT to 16:55:32 UT shows two HXR sources, which are clearly located at the two footpoints of the flare loops (Figure 1(E)). Note that the RHESSI image has also been rotated by 45 degrees.
We present the time sequence of the IRIS observation (including SJI 1330Å images and three spectral windows) and the corresponding AIA 131Å images in an online movie (m1.mp4). The GOES SXR and RHESSI HXR light curves are shown in the movie. The RHESSI 25-50 keV HXR and the time derivative of GOES 1-8Å SXR show a reasonably good match, indicating the existence of the Neupert effect. We also define the NUV and FUV continua by averaging the IRIS spectra over slit positions of 30′′–39′′ and wavelength ranges of 1355.08Å–1355.43Å and 2794.10Å–2794.45Å, respectively. The time history of the Mg ii 2798.8Å intensity (integrated over 2798.65Å–2799.00Å, NUV continuum subtracted) was also calculated over the same slit positions. The continua and Mg ii light curves appear to be similar. Figure 1 is a snapshot of this movie. Movie m2.mp4 shows the time evolution of the Fe xxi 1354.08Å and Si iv 1402.77Å spectra at the full-cadence (9.5 s) in a smaller section of the slit. Note that different images have been scaled differently in this movie to reveal a better contrast between the Fe xxi emission and the other emission features.
2.2 Results and discussion
Figure 1 shows that the IRIS slit crosses the edge of a ribbon, where one footpoint of the flare loops is anchored. The higher part of the loops is also covered by the slit. From the online movie m1.mp4 we can see that discernible Fe xxi 1354.08Å emission first appears at about 16:51:57 UT around the slit position of 28′′. About one minute later, stronger and entirely blueshifted Fe xxi emission appears around slit position 30′′, where a localized brightening can be identified in both the 1330Å and 131Å images. The entirely blueshifted Fe xxi line without a stationary component has been recently reported in several other flares (Young et al., 2015; Li et al., 2015; Polito et al., 2015; Sadykov et al., 2015; Tian et al., 2014a), and is in agreement with hydrodynamic simulations of single flare loop (e.g., Emslie & Alexander, 1987; Liu et al., 2009a). Enhancement of both the FUV and NUV continua can be seen at slit positions 30′′–39′′ after 16:53:51 UT, 2 minutes after the first Fe xxi 1354.08Å signature. During the impulsive phase of the flare, intensities of the 1330Å and 131Å passbands, the transition region and chromospheric emission lines, and the FUV and NUV continua all increase dramatically. These intensities reach their maxima at around 16:55:25 UT, almost the same as the peak times of the RHESSI HXR and GOES derivative. The 131Å emission is likely dominated by Fe viii lines early in the impulsive phase (Boerner et al., 2012; Brosius & Holman, 2012). In the impulsive phase of the flare, the Fe xxi emission is found mainly at or close to the ribbon where the continua are enhanced, and the line is clearly blue shifted. A visual inspection of the movie also suggests that the Fe xxi blue shift reaches the maximum around the peak times of the RHESSI HXR and GOES derivative. The flare loops have little Fe xxi 1354.08Å emission in the early stage of the impulsive phase. However, more and more Fe xxi emission appears to move upward from the loop footpoint to higher part in the later stage of the impulsive phase, and eventually fills the whole flare loops around the peak time of the GOES flux. This process provides strong support to the argument that the SXR emission in flare loops is produced through chromospheric evaporation, although we can not rule out the possibility that some of the coronal plasma might be heated in situ (e.g., Liu et al., 2013). The Fe xxi emission from these flare loops is very strong and shows almost no Doppler shift.
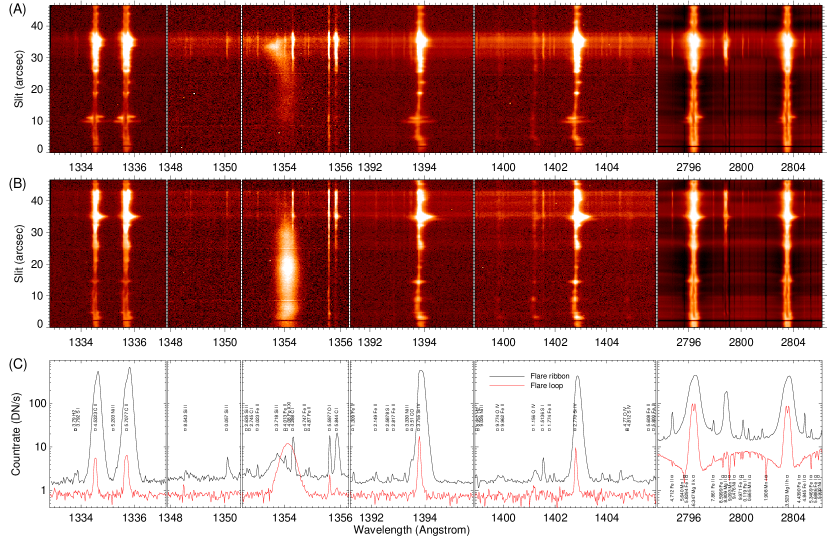
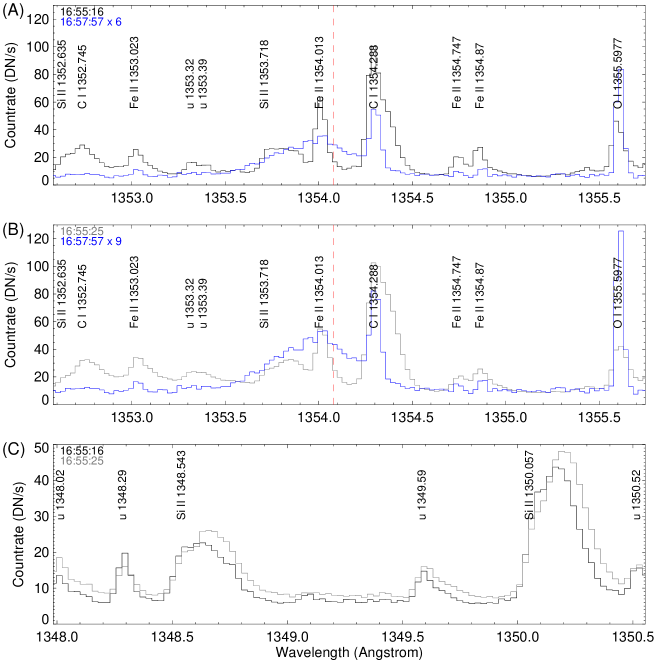
Figure 2 presents typical spectra at the flare ribbons and flare loops in this flare. The ribbon spectra and loop spectra appear to be largely different. First, almost all emission lines as well as the FUV and NUV continua are much stronger at the ribbons than in the loops. The Fe xxi 1354.08Å line, however, is often stronger in the loops. This is because hot plasma accumulates in the flare loops as the evaporation proceeds. Second, many narrow lines, which are normally invisible, now appear in the ribbon spectra. Most of these lines are singly ionized or neutral lines, and some of them have been identified with previous instruments (Cohen, 1981; Sandlin et al., 1986; Feldman et al., 1997; Ekberg & Feldman, 2003; Curdt et al., 2001, 2004; Tian et al., 2009). Some lines and their vacuum wavelengths (Kelly, 1987, 1979) have been marked in Figures 2. Third, the NUV spectra at the flare ribbons are dominated by emission lines (see also Cheng et al., 2015b). This is the case even at longer wavelengths around 2832Å (not shown here), indicating photospheric heating through possibly radiative backwarming (e.g., Xu et al., 2004). The Mg ii 2798.809Å line, which is actually a blend of two Mg ii lines at 2798.754Å and 2798.822Å, is the strongest emission line in the NUV spectrum except for the Mg ii k and h lines. These two lines (Mg ii 2798.8Å line thereafter) are of particular interest as they can serve as a good diagnostic of heating in the lower chromosphere (Pereira et al., 2015). Away from the flare ribbons, the NUV spectra are similar to quiet Sun spectra with all lines except the Mg ii k and h in absorption. Fourth, transition region lines such as C ii and Si iv are often obviously broader and redshifted at the ribbons.
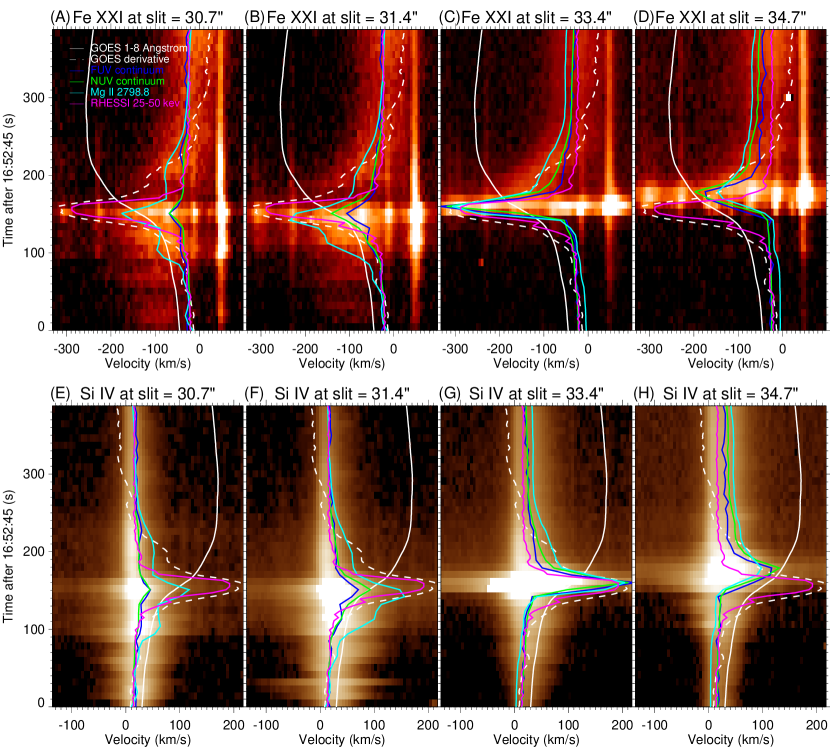
In the following we focus on the flare ribbon region (loop footpoint) crossed by the IRIS slit. Figure 3 shows the wavelength-time plots for Fe xxi 1354.08Å and Si iv 1402.77Å at four different positions of the ribbon. At slit positions 30.7′′ and 31.4′′, Fe xxi emission with a blue shift of 100 km s-1 are clearly present before the FUV continuum enhancement. This Fe xxi emission is probably from a loop with a footpoint not under the slit. At slit positions 33.4′′ and 34.7′′, there is essentially no Fe xxi emission prior to the continuum enhancement. The maximum continuum enhancement occurs at or slightly after the peak time of the RHESSI HXR and GOES derivative (for the different spatial scales from which the X-Ray and UV curves are derived, we refer to a discussion later in this section). Since the UV continuum is a marker of chromospheric heating, this timing suggests that nonthermal electrons deposit energy in the chromosphere and heat the plasma there. Following the maximum continuum enhancement, we see the appearance of largely blueshifted Fe xxi, especially at slit position 33.4′′. The blue shift of Fe xxi smoothly decreases to nearly zero within 3 minutes, whereas the HXR and UV continuum appear to decay even faster.
Although a few profiles of Si iv 1402.77Å are saturated around the times of maximum continuum enhancement, it is still clear that the intensities of Si iv, UV continua and Mg ii 2798.8Å all enhance at the same time and evolve in a very similar way, which suggests that the Si iv emission is responsible for the enhanced emission in lower layers and thus supports the idea that the FUV continuum enhancement at the flare ribbons is driven by back-warming (heating from the downward emission component) from the strong C ii and Si iv lines (Doyle & Phillips, 1992). Another interesting feature of the Si iv line profiles is the obvious asymmetry of the line profiles. Red wing asymmetries have been previously reported in the H line profiles acquired through some ground based observations of flares (e.g., Ding et al., 1995), whereas observations by CDS and EIS usually reveal a nearly symmetric profiles of the chromospheric and transition region lines during flares. The clear enhancement at the red wing suggests the presence of downflows with speeds of generally a few tens of km s-1. Some of these downflows, e.g., those at the time of maximum continuum enhancement, most likely indicate the ”chromospheric condensation” in explosive evaporation (Fisher et al., 1985a). The red wing enhancement can extend to more than 100 km s-1, suggestive of downflows at speeds greater than previously thought. Note that in many previous observations the downflow speeds were estimated based on a simple Gaussian fit to the line profiles of cool lines. The single Gaussian fit tends to underestimate the magnitude of red shift if strong red wing asymmetry is present. The red wing enhancement experiences a fast decay before reaching a stable level. The initial decay appears to be faster than the Fe xxi blue shift, consistent with the model of Fisher et al. (1989) which predicts a chromospheric condensation time of 1 minute. We find that the red wing asymmetry is present even after the impulsive phase. These asymmetries indicate downflows with speeds of 30 km s-1, which may be the ”warm rain” resulting from cooling of the heated plasma, as discussed by Brosius (2003).
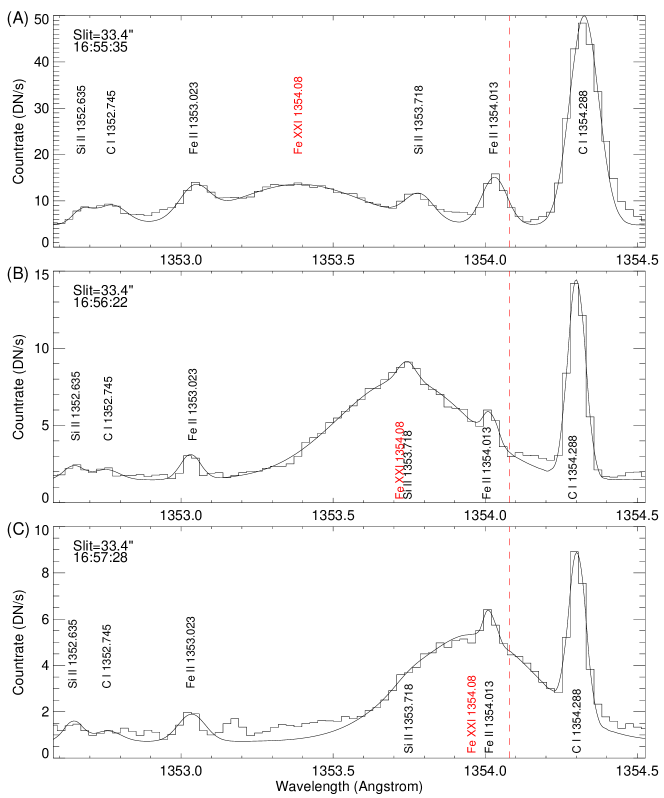
We derive the Fe xxi 1354.08Å line parameters (peak intensity, Doppler shift and line width) in the evaporation flow through multi-Gaussian fit to the Fe xxi 1354.08Å line and several lines nearby. In the spectral range of 1352.6Å–1354.5Å, the other major emission lines besides Fe xxi 1354.08Å are the following: Si ii 1352.635Å and 1353.718Å, C i 1352.745Å and 1354.288Å, Fe ii 1353.023Å and 1354.013Å. These six lines are all emitted from neutrals or singly ionized ions, thus are usually much narrower compared to the Fe xxi 1354.08Å line. These lines also have zero or small Doppler shift (often red shift). The most prominent and blueshifted Fe xxi emission is found around slit position 33.4′′ after the HXR peak. Before the HXR peak the Fe xxi emission is found slightly to the south of this position (first around slit position 30.7′′ and then 31.4′′, see Figure 3), which might be related to some pre-flare activity or some energy release early in the flare. We thus choose three slightly different slit positions during three time periods: slit position 30.7′′ during 16:52:45-16:54:38 UT, 31.4′′ during 16:54:48-16:55:07 UT, and 33.4′′ after 16:55:16 UT. For each exposure, we average the line profiles over 5 pixels around the corresponding slit position to improve the signal to noise ratio. A seven-component Gaussian function has been fitted to each of these spatially averaged line profiles. Figure 4 shows three examples of multi-Gaussian fit. In some spectra there appear to be some additional emission peaks (e.g., Figure 4(C)), suggesting the presence of some unidentified lines. Most of these lines are also very narrow and often weak in intensity, and their presence should not significantly affect the derived line parameters of Fe xxi 1354.08Å.
At first sight the Fe xxi 1354.08Å line seems absent at slit position 33.4′′ from 16:55:16 to 16:55:25 UT. However, a careful examination of the spectra at 16:55:16 and 16:55:25 UT (Figure 5) suggests some extra emission around the short wavelength edge of the spectral window. To demonstrate this we rescaled the line profile obtained at 16:57:57 UT so that the line free part of the spectrum from 1355.1Å–1355.4Å matches those at 16:55:16 and 16:55:25 UT. We see obvious enhancement of the continuum level between the emission lines around the short wavelength edge of the spectral window at 16:55:16 UT and 16:55:25 UT. Moreover, the C i 1352.745Å line is obviously weaker than the Fe ii 1353.023Å line in all the selected spectra except the two obtained at 16:55:16 and 16:55:25 UT. It is likely that this bulk enhancement is due to the highly blueshifted (200–300 km s-1) Fe xxi line. However, we realize that it may also be complicated by the redshifted emission of the cool lines. For instance, the continuum enhancement around 1353.2Å may be contributed by the enhanced red wing emission of the Fe ii 1353.023Å line. Young et al. (2015) noticed that several Si ii lines sometimes show broad and extended red wings. This is also the case in our data. Strong and broad redshifted emission features are clearly present in the Si ii 1353.718Å line profiles at 16:55:16 and 16:55:25 UT (Figure 5(A)-(B)). Similar features are also found for another two Si ii lines at 1348.543Å and 1350.057Å (Figure 5(C)), demonstrating that they are not unidentified lines. Thus, the enhanced emission of C i 1352.745Å and the continuum around 1352.9Å may actually be caused by the broad redshifted component of the Si ii 1352.635Å line. Because of this complication, we conclude that highly blueshifted Fe xxi line possibly exists but cannot be unambiguously identified at 16:55:16 and 16:55:25 UT.
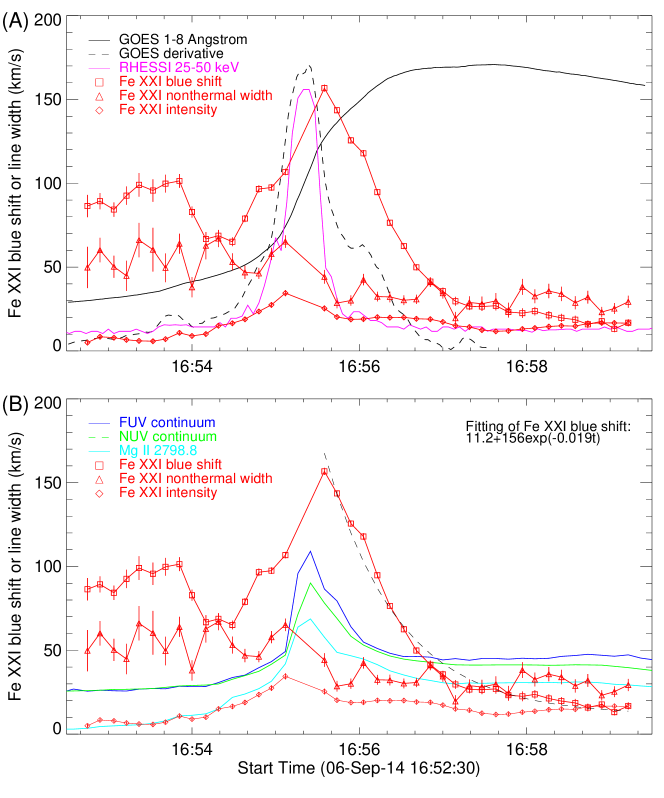
The derived Fe xxi 1354.08Å line parameters are plotted in Figure 6. Our study is among one of the few studies where hot evaporation flows are tracked at a cadence of 10 s. Using CDS data, the blue shift of Fe xix 592.23Å was tracked with a cadence of 9.8 s in two flares (Brosius, 2003; Brosius & Phillips, 2004). A cadence of 7 s was used in the observation presented by Brosius & Holman (2010) but no blueshifts were found for the hot Fe xix line. With EIS observations, Brosius (2013) reported the change of the intensity and Doppler shift of Fe xxiii 263.8Å in a C1 flare with a cadence of 11s. We find that the line width values (1/e width) are mostly in the range of 60–90 km s-1. Given a thermal broadening of 57.8 km s-1 (under ionization equilibrium) and an instrumental broadening of 4 km s-1 (see the discussion in Section S5 of the Supplementary Materials of Tian et al., 2014b), the nonthermal broadening has been found to be in the range of 15–70 km s-1. The line intensity appears to peak around the HXR peak time. We have to bear in mind that the line parameters are measured at the loop footpoint and that the Fe xxi emitting plasma continuously moves to higher part of the flare loops. As we explained above, the maximum blue shift of Fe xxi appears in the time range of 16:55:16 UT – 16:55:35 UT, roughly the same as the peak times of the RHESSI HXR and the derivative of GOES SXR. The blue shift quickly decreases to 20 km s-1 within 3 minutes, before the start (17:02 UT) of the second episode of energy release in this flare. The uncertainty on the rest wavelength of the Fe xxi line may slightly change the derived Doppler shifts. In our calculation we use 1354.08Å as the rest wavelength (Sandlin et al., 1977). Using a wavelength of 1354.064Å given by Feldman et al. (2000) will lower the derived blue shifts by 3.5 km/s. While using a wavelength of 1354.106Å found by Young et al. (2015) will increase the derived blue shifts by 5.8 km/s. The continua and Mg ii 2798.8Å intensities averaged over the whole covered ribbon (slit positions of 30′′–39′′) reach their maxima at around 16:55:25 UT, which is almost the same time of the maximum blue shift. Note that the Fe xxi emission comes from relatively higher part of the loop legs, whilst the continua and Mg ii emission come from lower part of the loop legs. Ideally one should compare the Doppler shift of Fe xxi and the continua/Mg ii intensities in the same loop. However, it is difficult to do do due to the line-of-sight superposition effect.
We have to mention that although the RHESSI HXR and GOES SXR are both integrated over the whole Sun, a comparison of them with the UV emission and Fe xxi 1354.08Å line parameters at the ribbon is still meaningful. First, most of the full-Sun RHESSI HXR flux is emitted from the two conjugate footpoints (see Figure 1), each located on one of the two ribbons. Connected by the same flaring loop, such HXR footpoints have light curves of the same temporal evolution (Liu et al., 2009b). Therefore, the full-Sun HXR flux is proportional to that of the footpoint crossed by the IRIS slit. The Neupert effect suggests that the GOES derivative is a proxy for the variation of the HXR flux, so it can be compared with the Fe xxi line parameters at the ribbon as well. Second, a recent study clearly reveals that the temporal evolution of evaporation flows at different spatial pixels within the ribbon is strikingly similar (Graham & Gauzzi, 2015), although we keep in mind that the maximum flow speed might occur at different times at different pixels in some flares.

To quantify possible correlation of the Fe xxi blue shift with other parameters, we present various scatter plots in Figure 7 for measurements at slit position 33.4′′ after 16:55:30 UT. Larger blue shifts are found when the intensities of Mg ii 2798.8Å and FUV/NUV continuum are larger, supporting the scenario of evaporation flows resulting from heating in the lower chromosphere.
The Fe xxi blue shift also correlates with the RHESSI HXR and GOES derivative, meaning that the evaporation flow speed depends on the rate of energy input at the flare ribbon. Perhaps the most intriguing correlation is the one between the blue shift and GOES derivative, which is nearly linear with a correlation coefficient of 0.98. In the thick-target flare model, most of the accelerated electrons produce HXR through bremsstrahlung in the chromosphere. The HXR flux is positively correlated with the instantaneous energy deposition rate by the nonthermal electrons precipitating to the chromosphere. The electron energy deposition may be lost through radiation, or go to the heating of the chromospheric plasma. Our results suggest that the evaporation flow is enhanced when the energy deposition rate is higher, thus indicating that a significant fraction of the electron energy goes into chromospheric heating and the resultant evaporation in this flare. The evaporation flow velocity appears to depend on the heating rate. Recently Krucker et al. (2015) claimed that energy in high-energy electrons (30 keV) is not responsible for chromospheric evaporation of hot plasma but is lost through radiation in the optical range. Through analysis of an X1 flare, Heinzel & Kleint (2014) concluded that the enhanced NUV continuum is the hydrogen recombination Balmer-continuum emission following an impulsive ionization caused by the precipitation of electrons in the chromosphere, which also suggests the loss of electron energy through radiation. Our results are not necessarily in contradiction with these previously reported results, as the amount of chromospheric heating and optical radiation may both increase as the deposited energy increases.
It is interesting that the Fe xxi blue shift is better correlated with the SXR derivative than the HXR and UV continua, although there may be some uncertainty due to the different spatial scales of integration. We offer possible explanations for this behavior: The blue shift represents how fast the heated plasma is transported into the flare loops, which may be more directly related to the energy deposition rate into the flare loops, as represented by the SXR derivative. The HXR and UV continua are also correlated with the energy deposition rate, but they are, however, produced at the loop foopoints/ribbons. Therefore a positive correlation between them and the Fe xxi blue shift is expected, but may not be very tight, especially when we consider the nonlinearity in the complex processes involving Coulomb collisions, ionization, free-bound and bremsstrahlung radiation, and hydrodynamic response of the atmosphere. Another possible explanation is that the chromospheric evaporation is mainly driven by thermal conduction rather than direct electron heating (e.g., Zarro & Lemen, 1988; Battaglia et al., 2009), which may lead to a better correlation between the blue shift and SXR derivative.
Although there is a weak trend that smaller blue shifts are associated with smaller nonthermal widths, we do not see a strong correlation between the blue shift and nonthermal width as reported by Polito et al. (2015) in another flare.
3 The X1.6 flare on 2014 September 10
3.1 Observations and data reduction
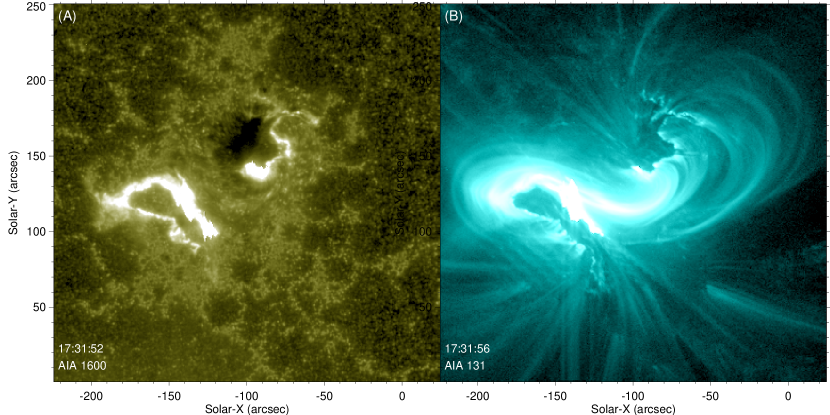
The second flare we have analyzed is the X1.6 flare peaking at about 17:45 UT on 2014 September 10 from the sigmoidal region in NOAA AR 12158. The IRIS observation lasted from 11:28 UT to 17:59 UT, which covers the whole impulsive phase and part of the decay phase of the flare. The IRIS slit was oriented in the nominal north-south direction. With a pointing of (–168′′, 125′′), the slit crossed two locations of the eastern ribbon in this flare (Figure 8). The observing mode was also sit-and-stare. The spatial pixel size, FUV spectral pixel size, NUV spectral pixel size, and cadence were 0.166′′, 0.026 Å, 0.025 Å, and 9.5 seconds, respectively. Slit-jaw images (SJI) were taken at a cadence of 19 seconds in each of the 1400Å and 2796Å passbands. The starting exposure time was 8 seconds, and the automatic exposure control successfully reduced the exposure time of the NUV spectra to 2.4 seconds after 17:27:09 UT. during the flare. The level 2 data are used here. The absolute wavelength calibration and cross-channel coalignment have been done similarly to the 2014 September 6 dataset. We notice that the Si iv spectra obtained by IRIS at the southern part of the eastern ribbon have been analyzed by Li & Zhang (2015) for the study of slipping magnetic reconnection. The IRIS data in this event has also been used by Cheng et al. (2015a) and Li et al. (2015) to study the formation of flux ropes and quasi-periodic pulsations, respectively. In this paper we focus mainly on the Fe xxi 1354.08Å line emission at the northern part of the eastern ribbon.
The AIA images have also been analyzed. Similar to the 2014 September 6 dataset, we used the AIA 1600Å images for the coalignment between IRIS and AIA data. For the AIA data we mainly focus on the 131Å image sequence, which has a cadence of 12 seconds and a pixel size of 0.6′′. We notice that many pixels are saturated in the 131Å images taken around the flare peak time. An online movie m3.mp4 shows the evolution of the entire flare region in the AIA 1600Å and 131Å passbands.
RHESSI data are not available for this flare. SXR images were taken with the HINODE/XRT instrument in several filters, although the field of view (FOV) of XRT only has partial overlap with that of IRIS/SJI. XRT images taken in the Al_thick, Be_thin and Be_med filters appear to be similar. We thus use only the Al_thick images in this paper. To coalign these images we have performed a cross-correlation of every 5 images. These internally aligned XRT images have then been aligned with the AIA 131Å images, and thus also the IRIS images. A movie of the XRT images is available online (m4.mp4).
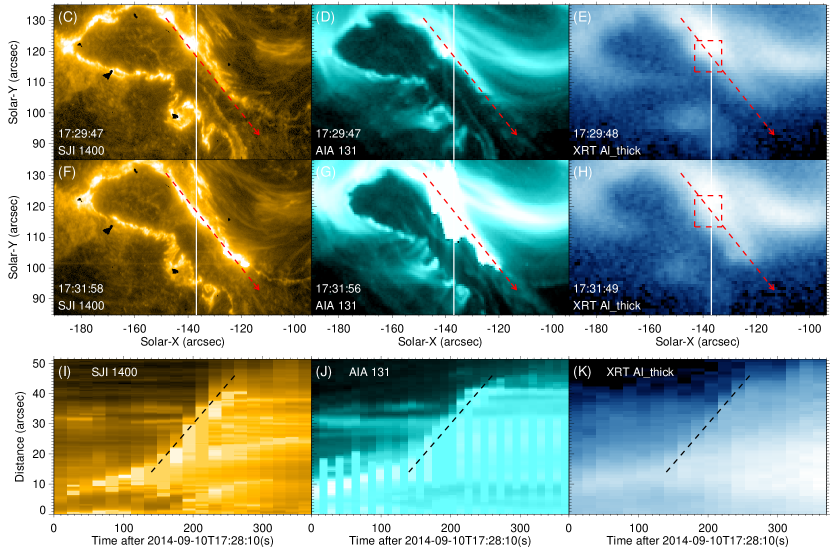
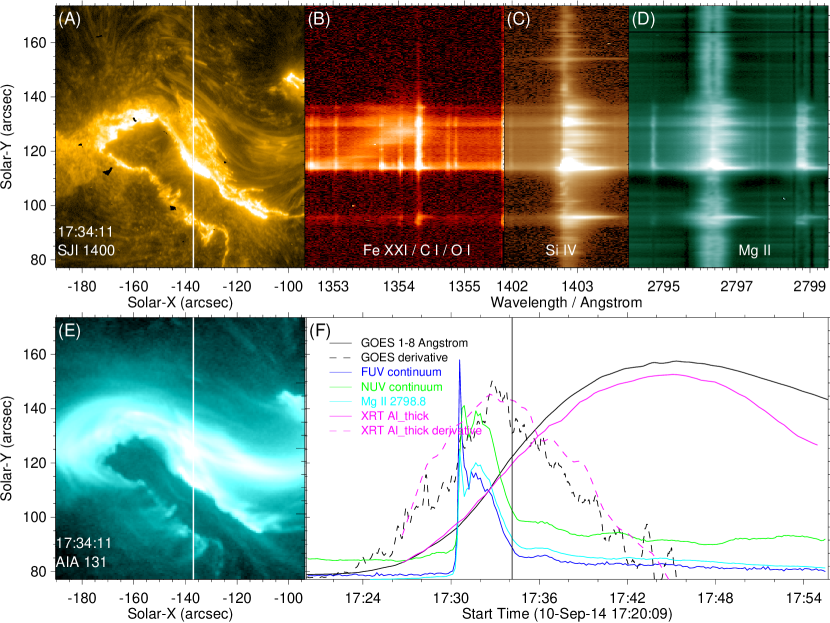
Figure 8(A)-(F) presents the IRIS/SJI 1400Å, AIA 131Å and XRT Al_thick images taken at two different times. A dashed line was drawn to indicate a fast motion seen in these images. The space-time maps for this dashed line are shown in Figure 8(G)-(I).
We present the time sequence of IRIS observation (including SJI 1400Å images and three spectral windows) and the corresponding AIA 131Å images in an online movie m5.mp4. The GOES 1–8Å flux and XRT Al_thick flux integrated over the box marked in Figure 8(E)&(H) are also shown in the movie. These two light curves appear to have a similar trend, and the general trend of their time derivatives is also similar. We have noticed an interesting Fe xxi 1354.08Å emission feature around the slit position 117.8′′. Since our following analysis is focused mainly on this feature, we calculated the NUV and FUV continua by averaging the IRIS spectra over 5 pixels around slit position 117.8′′ and wavelength ranges of 1355.08Å–1355.43Å and 2794.10Å–2794.45Å, respectively. The time history of the Mg ii 2798.8Å intensity (integrated over 2798.65Å–2799.00Å, NUV continuum subtracted) was also calculated over the same slit positions. Figure 9 is a snapshot of this movie. Movie m6.mp4 shows the time evolution of the Fe xxi 1354.08Å and Si iv 1402.77Å spectra at the full-cadence (9.5 s) in a smaller section of the slit. Similar to movie m2.mp4, different images have been scaled differently in m6.mp4 to reveal a better contrast between the Fe xxi emission and the other emission features.
3.2 Results and discussion
From the XRT Al_thick and AIA 131Å images we can see that the sigmoid consists of two “J”-shape loops which evolve rapidly during the flare. The IRIS slit crosses the ribbon where the eastern “J” loop is rooted. A fast motion of bright front can be clearly identified from 17:29:48 UT to 17:32:37 UT at the northern part of this ribbon (Figure 8). This apparent motion is seen in not only the hot XRT Al_thick and AIA 131Å channels, but also in the IRIS/SJI 1400Å passband which samples mainly the Si iv lines formed at a temperature of 104.9 K. The similar dynamics of both the cool and hot plasma is consistent with the scenario of chromospheric heating and evaporation in sequentially reconnected loops, thus supporting the interpretation of slipping reconnection by Li & Zhang (2015). The apparent speed of the motion has been estimated to be 200 km s-1 from the space-time maps (Figure 8(G)-(I)), which is much higher than the sound speed at a temperature of 104.9 K. We believe that the fast apparent motion is not real mass motion but just a manifestation of the progression of the magnetic reconnection site along the flare arcade. In other words, the fast apparent motion is ultimately due to a succession of chromospheric footpoints being heated with nonthermal electrons accelerated by reconnection in a succession of loops as the magnetic reconnection site progresses along the flare arcade.
Figure 9 shows clear enhancement of both the FUV and NUV continua at both the southern and northern parts of the covered ribbon. In the southern part, the Mg ii 2798.8Å line turns from absorption to emission at about 17:24:29 UT and clear continuun enhancement can be identified 20 s later (Movie m5.mp4). Obvious red wing enhancement frequently appears in the line profiles of C i, Si iv and Mg ii, indicating downward motion of the chromosphere at a few tens km s-1 due to the heating related overpressure. However, no obvious signature of Fe xxi 1354.08Å is found at this part, suggesting that the chromospheric heating is likely not intense enough to produce 11 MK plasma there.
The chromospheric heating appears much more efficient in the northern part of the ribbon, where we see greatly enhanced continua and largely blueshifted Fe xxi 1354.08Å. From the online movie m5.mp4 we can see that the continuum enhancement and Mg ii 2798.8Å emission first appears around 17:25:25 UT at slit position 126′′. As the ribbon extends in the north-south direction after 17:30:07 UT, the slit positions where the continua and Mg ii 2798.8Å intensities are enhanced expand and cover the range of 110′′–134′′ around the flare peak time. Clear Fe xxi 1354.08Å signature can be identified at slit position 128′′ at 17:28:52 UT. The blueshifted Fe xxi emission can be more easily identified as the ribbon extends. The largest blue shift appears to be found at the southern edge of the ribbon, where the continua and Mg ii 2798.8Å intensities are also the largest. This suggests that the largest blue shift is likely associated with the newly heated plasma. Before the GOES SXR peak, we can clearly see that entirely blueshifted Fe xxi emission features continuously migrate to the rest wavelength position of the line, leading to more and more nearly stationary Fe xxi emission at the locations of the hot flare loops. This behavior provides support to the scenario of the hot emission in flare loops being produced through an accumulation of the evaporated plasma. A smooth transition from the largest blue shift at the outer edge of the ribbon to a zero shift in the flare loops, which has been found by Young et al. (2015) in another flare, is clearly present in the later stage of the impulsive phase (17:35 UT – 17:45 UT). The main evaporation process appears to cease after the GOES SXR peak, when the blue shift of Fe xxi almost disappears and the intensity of the nearly stationary Fe xxi emission decreases with time due to the cooling of the hot plasma.
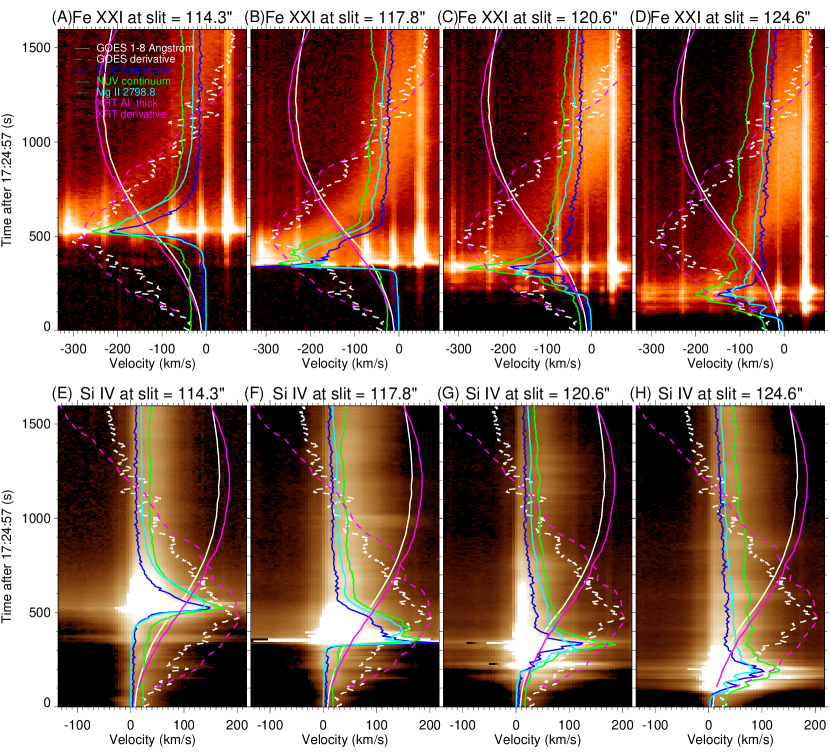
Figure 10 shows the wavelength-time plots for Fe xxi 1354.08Å and Si iv 1402.77Å at four different positions in the northern part of the ribbon. Largely blueshifted Fe xxi emission appears at or after the time of sudden enhancement of the FUV continuum at all positions, again supporting the scenario of evaporation flows driven by heating in the lower chromosphere. The maximum blue shift of Fe xxi is on the order of 250 km s-1 at the slit positions of 114.3′′, 117.8′′ and 120.6′′. The blue shift smoothly decreases to nearly zero within 9 min, before the peak of the GOES flux, at all four positions. Note that the appearance of continuum enhancement and Fe xxi emission at different times at the four different positions is just a reflection of the ribbon expansion to the south.
Although saturated around the times of maximum continuum enhancement, the Si iv spectra presented in Figure 10(E)-(H) reveal some results similar to those in the 2010 September 6 event. The strong correlation of Si iv 1402.77Å, continua and Mg ii 2798.8Å line intensities supports the suggestion of FUV continuum enhancement being driven by back-warming from the C ii and Si iv lines (Doyle & Phillips, 1992). The obvious red wing asymmetry in the impulsive phase and decay phase are likely signatures of the chromospheric condensation (Fisher et al., 1985a) and cooling of the heated plasma (Brosius, 2003), respectively.
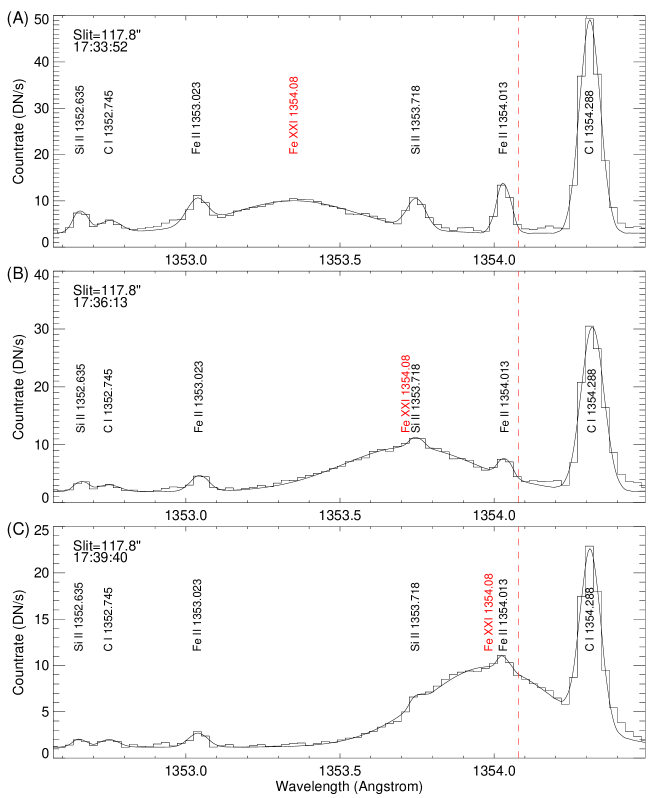
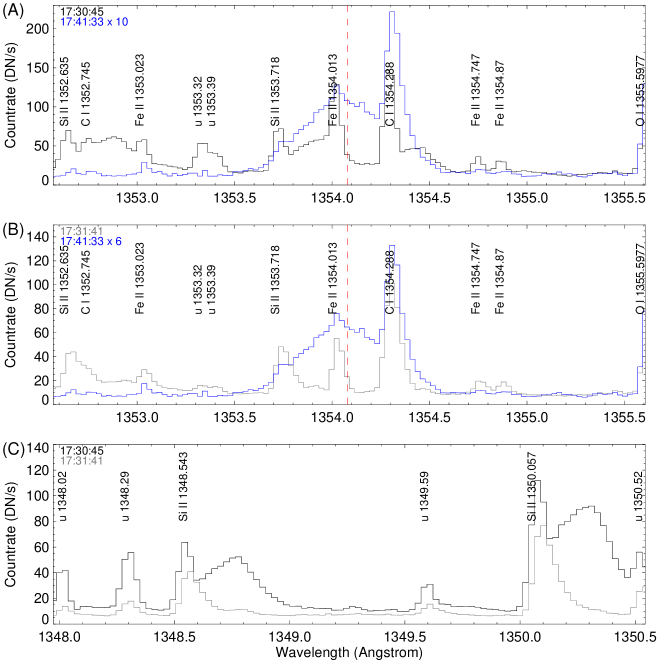
Since the ribbon moves a lot in the slit direction and there are many loops overlapping with each other, it is difficult to identify and track the Fe xxi emission in a single loop. Fortunately, we find that the Fe xxi emission feature at the slit position 117.8′′ appears not moving in the slit direction from 17:32:28 UT to 17:41:23 UT. We track the time evolution of the Fe xxi line parameters at this position. Similar to the 2010 September 6 event, we average the line profiles over 5 pixels around slit position 117.8′′ and derive the Fe xxi 1354.08Å line parameters through a seven-component Gaussian fit to the Fe xxi 1354.08Å line and six cool lines nearby. Figure 11 shows three examples of multi-Gaussian fits. We notice that extra emission around the short wavelength edge of the spectral window, similar to those seen in the 2014 September 6 flare (Figure 5), is also clearly present in the line profiles obtained from 17:30:35 UT and 17:32:19 UT. Figure 12(A)-(B) show two examples. There the line profile obtained at 17:41:33 UT has been re-scaled to let the line free part of the spectrum from 1355.1Å–1355.4Å matches those at 17:30:45 UT and 17:31:41 UT. The extra emission may indicate a very large blue shift of Fe xxi, 300 km s-1 or even greater since part of the Fe xxi line profile may have been shifted out of the spectral window. However, as we discussed above, the presence of a broad redshifted component (e.g., at 17:30:45 UT) or red wing enhancement (e.g., at 17:31:41 UT) in three other Si ii lines (1348.543Å and 1350.057Å shown in Figure 12(C), 1353.718Å shown in Figure 12(A)-(B)) suggests a significant contribution of the extra emission by the redshifted Si ii 1352.635Å line. We decide not to perform multi-Gaussian fitting to the line profiles obtained from 17:30:35 UT and 17:32:19 UT since it is difficult to decompose the contribution from the highly blueshifted Fe xxi line and the redshifted Si ii emission.
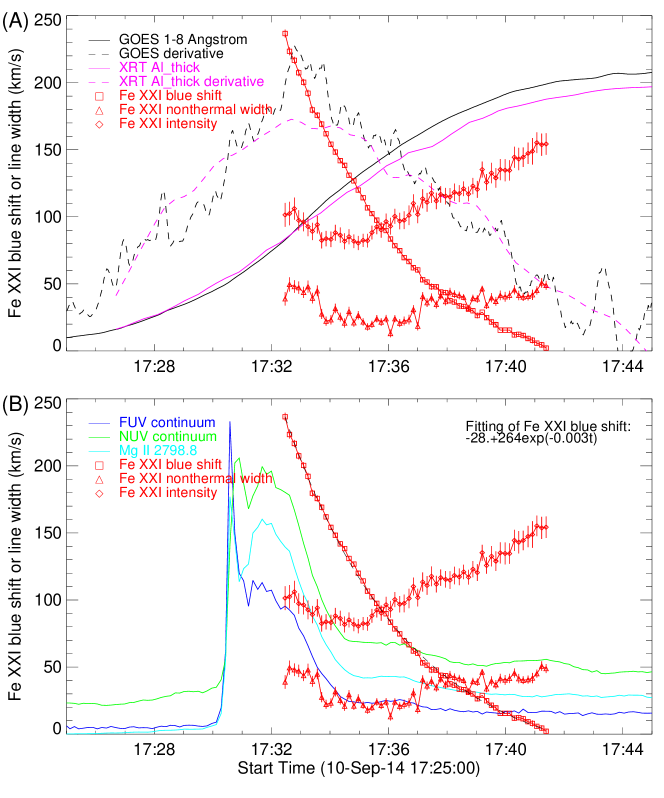
The derived Fe xxi 1354.08Å line parameters and the 1- uncertainties are plotted in Figure 13. The 1/e line width values are mostly in the range of 60–80 km s-1, leading to a nonthermal broadening of 10–50 km s-1 after subtracting the thermal and instrumental broadening. Different from the 2014 September 6 event, the line intensity decreases slightly before increasing continuously till the end of the measurements at 17:41:23 UT. As we explained above, Fe xxi emission with a blue shift larger than 200 km s-1 first appears in the time range of 17:30:35 – 17:32:28 UT, same as or slightly after the time of the sudden enhancement of the continua and Mg ii 2798.8Å intensities. The maximum blue shift appears to precede the peaks of the SXR (GOES and XRT) derivatives by 0.5–2.0 minutes. This delay might be qualitatively consistent with a recent radiative hydrodynamic simulation (RADYN) of chromospheric evaporation (Rubio da Costa et al., 2015), where the maximum upflow speed is achieved before the maximum of the injected electron flux, and thus HXR flux or time derivative of SXR flux. However, we have to remember that the maximum blue shift actually occurs at different times at different pixels within the ribbon (Graham & Gauzzi, 2015). Note that the XRT flux is integrated over a small region around the position where the Fe xxi 1354.08Å line parameters are measured.
The blue shift smoothly decreases to 0 km s-1 in 9 minutes. The time evolution of the blue shift from 17:32:28 to 17:41:23 UT appears to be well fitted with an exponential function. It suggests that the evaporation process evolves smoothly, perhaps indicating a continuous energy input. However, there is an uncertainty as to whether overlying loops corresponding to different footpoints may be contributing to the Fe xxi 1354.08Å emission feature at slit position 117.8′′. If this was the case, then we would expect very broad Fe xxi line profiles or perhaps multiple components which does not appear to be the case.

Figure 14 presents various scatter plots for the relationship between Fe xxi blue shift and other measured quantities. As expected from the scenario of evaporation flows being driven by chromospheric heating, larger blue shifts are found when the intensities of Mg ii 2798.8Å and the FUV and NUV continua are larger. The correlation appears to be linear for blue shifts larger than 130 km s-1. The chromospheric intensities do not drop too much when the Fe xxi blue shift reaches smaller values, simply because they drop faster than the decrease of the blue shift. Similar to the 2014 September 6 event, here we also find a good correlation between the Fe xxi blue shift and the SXR derivative. The best correlation is still the one between the Fe xxi blue shift and the derivative of GOES, which has a linear correlation coefficient of 0.94. As we explained above, this correlation means that the evaporation flow velocity largely depends on the energy deposition rate, and thus the heating rate.
The scatter plot for the relationship between the blue shift and nonthermal width (Figure 14(F)) appears surprising. We see a positive correlation when the blue shift is larger than 100 km s-1 and a negative correlation when the blue shift is smaller than 100 km s-1. More case studies will tell how common this characteristic is.
4 Summary
Using IRIS observations, we have tracked the complete evolution of the hot evaporation flows continuously in the M1.1 flare occurring on 2014 September 6 and the X1.6 flare on 2014 September 10. For both flares, the hot evaporation flows marked by the blueshifted Fe xxi 1354.08Å emission are tracked with a cadence higher than 10 seconds. The relationship between chromospheric evaporation and heating, as indicated by the enhancement of the UV continuum and Mg ii 2798.8Å line emission, has been studied as well. We have also investigated the correlation between the evaporation flow velocity and the energy deposition rate, as represented by the HXR flux measured by RHESSI or the time derivative of the SXR flux observed by GOES and HINODE/XRT. The main results are summarized in the following.
(1) The NUV spectra at the ribbons of both flares are dominated by emission lines. The is true for wavelengths at least between 2791Å–2834Å and indicates strong heating in both the chromosphere and photosphere.
(2) The Fe xxi line is completely blueshifted at or near the flare ribbons indicated by the enhancement of the UV continuum. The absence of the rest component, which was often observed in flare lines by previous instruments, agrees with simulations of chromospheric evaporation in a single flare loop (e.g., Emslie & Alexander, 1987; Liu et al., 2009a) and suggests that the resolution of IRIS is high enough to separate the evaporation flows from the surrounding hot plasma in flare loops.
(3) The flare loops have little Fe xxi emission in the early stage of the impulsive phase. Fe xxi emission appears to shift from the footpoints to the higher parts of the flare loops in the later stage of the impulsive phase, until the entire flare loop emits in Fe xxi at the time of the peak in the GOES flux. This behavior provides support to the scenario of the SXR emission in flare loops being produced through an accumulation of the evaporated hot plasma from the chromosphere, although we can not rule out the possibility of certain degrees of in-situ heating in the corona.
(4) The maximum blue shift of Fe xxi is on the order of 200 km s-1, though possible signatures of 300 km s-1 or larger blue shifts have also been identified. The maximum blue shift appears approximately at the same time as or slightly after the impulsive enhancement of the FUV/NUV continuum and Mg ii 2798.8Å emission, indicating that the hot evaporation flow is closely related to intense heating of the lower chromosphere.
(5) After reaching the maximum, the blue shift decreases smoothly to almost stationary within a few minutes. The smooth decrease may suggest that the energy input into the lower atmosphere is smooth and continuous in these flares. The velocity decrease appears to be exponential in time, especially for the X1.6 flare.
(6) The Fe xxi blue shift appears to correlate with the hard X-Ray flux (or derivative of soft X-Ray flux), which is in general agreement with the picture of chromospheric evaporation driven by nonthermal electron heating. A nearly linear correlation between the blue shift and GOES derivative is found in both flares, suggesting that the evaporation flow velocity largely depends on the rate of energy deposition or heating.
(7) The intensities of the FUV continuum, NUV continuum, and the chromospheric and transition region lines appear to be correlated. This correlation supports the suggestion of FUV continuum enhancement in flares being driven by back-warming from the C ii and Si iv lines (Doyle & Phillips, 1992). The decay of these intensities is faster than the decrease of the Fe xxi blue shift.
(8) The chromospheric and transition region lines often show obvious enhancement in the red wing of the line profiles at the flare ribbons. Several Si ii lines sometimes even show a distinct broad and redshifted component. The red wing enhancement and redshifted component suggest that the speed of chromospheric condensation might be larger (up to 100 km s-1) than previously found from hydrodynamic simulations and from single Gaussian fits to the cool lines of EIS and CDS. Their presence also complicates the detection of highly blueshifted Fe xxi 1354.08Å around the time of maximum continuum enhancement. The red wing enhancement is found in not only the impulsive phase but also the decay phase. The latter is likely caused by cooling of the heated plasma in the corona.
(9) In the X1.6 flare, we see a bright intensity front propagating with an apparent speed of 200 km s-1 along the ribbon in IRIS/SJI 1400Å, XRT Al_thick and AIA 131Å images. This fast apparent motion is not real mass motion but just a reflection of the chromospheric heating and evaporation in sequentially reconnected loops.
References
- Antonucci et al. (1982) Antonucci, E., Gabriel, A. H., Acton, L. W., et al. 1982, SoPh, 78, 107
- Antiochos et al. (1999) Antiochos, S., Devore, C. R., & Klimchuk, J. A. 1999, ApJ, 510, 485
- Battaglia et al. (2009) Battaglia, M., Fletcher, L., Benz, A. O. 2009, ApJ, 498, 891
- Boerner et al. (2012) Boerner, P., et al. 2012, SoPh, 275, 41
- Brosius & Holman (2010) Brosius, J. W., & Holman, G. D. 2010, ApJ, 720, 1472
- Brosius & Holman (2012) Brosius, J. W., & Holman, G. D. 2014, A&A, 540, A24
- Brosius (2003) Brosius, J. W. 2003, ApJ, 586, 1417
- Brosius & Phillips (2004) Brosius, J. W., & Phillips, K. J. H. 2004, ApJ, 613, 580
- Brosius (2013) Brosius, J. W. 2013, ApJ, 762, 133
- Cassak et al. (2013) Cassak, P. A., Drake, J. F., Gosling, J. T., et al. 2013, ApJ, 775, L14
- Carmichael (1964) Carmichael, H. 1964, in AAS-NASA Symposium on Solar Flares, ed. W. N. Hess (NASA SP-50), 451
- Chen & Ding (2010) Chen, F., Ding, M. D. 2010, ApJ, 724, 640
- Cheng et al. (2015a) Cheng, X., Ding, M. D., & Fang, C. 2015a, ApJ, 804, 82
- Cheng et al. (2015b) Cheng, X., Hao, Q., Ding, M. D., et al. 2015b, ApJ, in press
- Cohen (1981) Cohen, L. 1981, NASA Publ. 1069
- Culhane et al. (2007) Culhane, J. L., et al. 2007, Sol. Phys., 243, 19
- Curdt et al. (2001) Curdt, W., Brekke, P., Feldman, U., Wilhelm, K., Dwivedi, B.N., Schühle, U., & Lemaire, P. 2001, A&A, 375, 591
- Curdt et al. (2004) Curdt, W., Landi, E., & Feldman, U. 2004, A&A,427,1045
- Czaykowska et al. (1999) Czaykowska, A., et al. 1999, ApJ, 521, L75
- Czaykowska et al. (2001) Czaykowska, A., et al. 2001, ApJ, 552, 849
- Del Zanna et al. (2006) Del Zanna, G., Berlicki, A., Schmieder, B., & Mason, H. E. 2006, SoPh, 234, 95
- Del Zanna et al. (2011) Del Zanna, G., O′Dwyer, B., Mason, H. E. 2011, A&A, 535, A46
- Dennis & Zarro (1993) Dennis, B. R., & Zarro, D. M. 1993, Sol. Phys., 146, 177
- De Pontieu et al. (2014) De Pontieu, B., et al. 2014, Sol. Phys., 289, 2733
- Doschek et al. (1980) Doschek, G. A., Feldman, U., Kreplin, R. W., & Cohen, L. 1980, ApJ, 239, 725
- Doschek et al. (2013) Doschek, G. A., Warren, H. P., Young, P. R. 2013, ApJ, 767, 55
- Doyle & Phillips (1992) Doyle, J. G., Phillips, K. J. H. 1992, A&A, 257, 773
- Ding et al. (1995) Ding, M.-D., Fang, C., & Huang, Y.-R. 1995, Sol. Phys., 158, 81
- Ekberg & Feldman (2003) Ekberg, J. O., & Feldman, U. 2003, ApJS, 148, 567
- Emslie & Alexander (1987) Emslie, G. A., Alexander, D. 1987, Sol. Phys. 110, 295
- Falchi et al. (2006) Falchi, A., Teriaca, L., Maltagliati, L. 2006, Sol. Phys. 239, 193
- Feldman et al. (1980) Feldman, U., Doschek, G. A., Kreplin, R. W., & Mariska, J. T. 1980, ApJ, 241, 1175
- Feldman et al. (1997) Feldman, U., Behring, W. E., Curdt, W. et al. 1997, ApJS, 113, 195
- Feldman et al. (2000) Feldman, U., Curdt, W., Landi, E., & Wilhelm, K. 2000, ApJ, 544, 508
- Fisher et al. (1985a) Fisher, G. H., Canfield, R. C., McClymont, A. N. 1985a, ApJ, 289, 414
- Fisher et al. (1985b) Fisher, G. H., Canfield, R. C., McClymont, A. N. 1985b, ApJ, 289, 425
- Fisher et al. (1989) Fisher, G. H. 1989, ApJ, 346, 1019
- Golub et al. (2007) Golub, L., DeLuca, E., Austin, G., et al. 2007, Solar Phys, 243, 63
- Graham et al. (2011) Graham, D. R., Fletcher, L., & Hannah, I. G. 2011, A&A, 532, A27
- Graham & Gauzzi (2015) Graham, D. R., Gauzzi, G. 2015, ApJL, 807, L22
- Harra et al. (2005) Harra, L. K., Démoulin, P., Mandrini, C. H., et al. 2005, A&A, 438, 1099
- Harrison et al. (1995) Harrison, R. A., et al. 1995, Sol. Phys., 162, 233
- Heinzel & Kleint (2014) Heinzel, P., Kleint, L. 2014, ApJL, 794, L23
- Hirayama (1974) Hirayama, T. 1974, Sol. Phys., 34, 323
- Hudson (1991) Hudson, H. S. 1991, BAAS, 23, 1064
- Kelly (1979) Kelly, R. L. 1979, Atomic emission lines in the near ultraviolet: hydrogen through krypton. Greenbelt, MD: Goddard Space Flight Center.
- Kelly (1987) Kelly, R. L. 1987, J. Phys. Chem. Ref. Data 16, Suppl. 1
- Kopp & Pneuman (1976) Kopp, R. A., & Pneuman, G. W. 1976, Sol. Phys., 50, 85
- Krucker et al. (2015) Krucker, S., Saint-Hilaire, P., Hudson, H. S., et al. 2015, ApJ, 802, 19
- Landi et al. (2013) Landi, E., Young, P. R., Dere, K. P., Del Zanna, G., & Mason, H. E. 2013, ApJ, 763, 86
- Lemen et al. (2012) Lemen, J. R., et al. 2012, Solar Phys., 275, 17
- Li et al. (2015) Li, D., Ning, Z. J., Zhang, Q. M. 2015, ApJ, 807, 72
- Li & Ding (2011) Li, Y., Ding, M. D. 2011, ApJ, 727, 98
- Li et al. (2015) Li, Y., Ding, M. D., Qiu, J., Cheng, J. X. 2015, submitted to ApJ
- Li & Zhang (2015) Li, T., Zhang, J. 2015, ApJL, 804, L8
- Lin et al. (2002) Lin, R. P., et al. 2002, Sol. Phys., 210, 3
- Liu et al. (2013) Liu, W.-J., Qiu, J., Longcope, D. W., Caspi, A. 2013, ApJ, 770, 111
- Liu et al. (2006) Liu, W., et al. 2006, ApJ, 649, 1124
- Liu et al. (2009a) Liu, W., Petrosian, V., Mariska, J. T. 2009a, ApJ, 702, 1553
- Liu et al. (2009b) Liu, W., Petrosian, V., Dennis, B. R., Holman, G. D. 2009b, ApJ, 693, 847
- Mason et al. (1986) Mason, H. E., Shine, R. A., Gurman, J. B., Harrison, R. A. 1986, ApJ, 309, 435
- Mariska & Doschek (1993) Mariska, J. T., & Doschek, G. A. 1993, ApJ, 419, 418
- Milligan et al. (2006a) Milligan,R.O., Gallagher, P. T., Mathioudakis, M.,& Keenan, F. P. 2006a, ApJL, 642, L169
- Milligan et al. (2006b) Milligan, R. O., Gallagher, P. T., Mathioudakis, M., et al. 2006b, ApJL, 638, L117
- Milligan & Dennis (2009) Milligan, R. O., Dennis, B. R. 2009, ApJ, 699, 968
- Milligan (2011) Milligan, R. O. 2011, ApJ, 740, 70
- Neupert (1968) Neupert, W. M. 1968, ApJ, 153, L59
- Ning et al. (2009) Ning, Z.-J., Cao, W.-D., Huang, J. 2009, ApJ, 699, 15
- Nitta et al. (2012) Nitta, S., Imada, S., Yamamoto, T. T. 2012, Sol. Phys., 276, 183
- O′Dwyer et al. (2010) O′Dwyer, B., Del Zanna, G., Mason, H. E., Weber, M. A., & Tripathi, D. 2010, A&A, 521, A21
- Pereira et al. (2015) Pereira, T. M. D., Carlsson, M., De Pontieu, B., & Hansteen, V., 2015, submitted to ApJ
- Polito et al. (2015) Polito, V., Reeves, K. K., Del Zanna, G., Golub, L., Mason, H. E. 2015, ApJ, 803, 84
- Raftery et al. (2009) Raftery, C. L., et al. 2009, A&A, 494, 1127
- Pesnell et al. (2012) Pesnell, W. D., Thompson, B. J., Chamberlin, P. C. 2012, Sol. Phys., 275, 3
- Reeves et al. (2007) Reeves, K. K., Warren, H. P., Forbes, T. G. 2007, ApJ, 668, 1210
- Rubio da Costa et al. (2015) Rubio da Costa, F., Petrosian, V., Liu, W., & Carlsson, M. 2015, to be submitted to ApJ
- Sandlin et al. (1977) Sandlin, G. D., Brueckner, G. E., & Tousey, R. 1977, ApJ, 214, 898
- Sandlin et al. (1986) Sandlin, G. D., Bartoe, J.-D. F., Brueckner, G. E., Tousey, R., Vanhoosier, M. E. 1986, ApJS, 61, 801
- Sadykov et al. (2015) Sadykov, V. M., Dominguez, S. V., Kosovichev, A. G., et al. 2015, ApJ, 805, 167
- Silva et al. (1997) Silva, A. V. R., Wang, H., Gary, D. E., Nitta, N., & Zirin, H. 1997, ApJ, 481, 978
- Sturrock (1966) Sturrock, P. A. 1966, Nature, 211, 695
- Teriaca et al. (2003) Teriaca, L., Falchi, A., Cauzzi, G., et al. 2003, ApJ, 588, 596
- Teriaca et al. (2006) Teriaca, L., Falchi, A., Falciani, R., Cauzzi, G., & Maltagliati, L. 2006, A&A, 455, 1123
- Tian et al. (2009) Tian, H., Curdt, W., Teriaca, L., Landi, E., Marsch, E. 2009, A&A 505, 307
- Tian et al. (2014a) Tian, H., Li, G., Reeves, K. K., et al. 2014a, ApJL, 797, L14
- Tian et al. (2014b) Tian, H., DeLuca, E. E., Cranmer, S. R., et al. 2014b, Science, 346, 1255711
- Warren & Doschek (2005) Warren, H. P., & Doschek, G. A. 2005, ApJ, 618, L157
- Watanabe et al. (2010) Watanabe, T., Hara, H., Sterling, A. C., & Harra, L. K. 2010, ApJ, 719, 213
- Veronig et al. (2005) Veronig, A. M., Brown, J. C., Dennis, B. R., et al. 2005, ApJ, 621, 482
- Xu et al. (2004) Xu, Y., Cao, W.-D., Liu, C., et al. 2004, ApJ, 607, L131
- Young et al. (2013) Young, P. R., Doschek, G. A., Warren, H. P., Hara, H. 2013, ApJ, 766, 127
- Young et al. (2015) Young, P., Tian, H., Jaeggli, S. 2015, ApJ, 799, 218
- Zarro & Lemen (1988) Zarro, D. M., Lemen, J. R. 1988, ApJ, 329, 456
- Zhang & Ji (2013) Zhang, Q.-M., Ji, H.-S. 2013, A&A, 557, L5