Formation of shear-bands in drying colloidal dispersions
Abstract
In directionally-dried colloidal dispersions regular bands can appear behind the drying front, inclined at to the drying line. Although these features have been noted to share visual similarities to shear bands in metal, no physical mechanism for their formation has ever been suggested, until very recently. Here, through microscopy of silica and polystyrene dispersions, dried in Hele-Shaw cells, we demonstrate that the bands are indeed associated with local shear strains. We further show how the bands form, that they scale with the thickness of the drying layer, and that they are eliminated by the addition of salt to the drying dispersions. Finally, we reveal the origins of these bands in the compressive forces associated with drying, and show how they affect the optical properties (birefringence) of colloidal films and coatings.
pacs:
47.57.-s,45.70.Qj,62.20.F-Colloidal dispersions are the basis of many paints, inks and coatings, are used in ceramics and composites, and are a foundation of the photonics industry. When dried, these dispersions can show a surprising variety of patterning mechanisms. They may buckle Tsapis et al. (2005), or crack into spirals Lazarus and Pauchard (2011), waves Goehring et al. (2011), or parallel lines Allain and Limat (1995); Dufresne et al. (2006), for example, while their dried shape can vary from a coffee-ring Deegan et al. (1997) to textured surfaces controlled by evaporation-lithography Harris et al. (2007); Parneix et al. (2010). This abundance of patterns, recently reviewed in Routh (2013); Thiele (2014), suggests diverse means for the directed self-assembly of micro-structured materials, if the underlying dynamics can be understood and controlled.
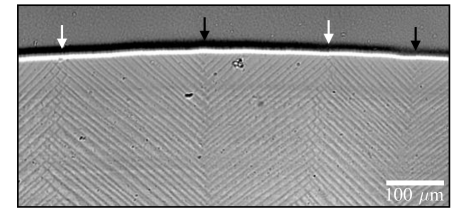
This letter focusses on establishing and manipulating the driving forces behind a banded (or striped) structure that is commonly found in drying dispersions, and shown in Fig. 1. Such bands were first noticed in sol-gels by Hull and Caddock Hull and Caddock (1999), who studied desiccation as an analog for thermal contraction in geophysical settings. They found that regular bands always preceded fracture, and that the bands were oriented at to the cracks. Similar bands can be seen in the figures of many studies of drying colloids (e.g. Dufresne et al. (2006); Goehring et al. (2010); Smith and Sharp (2011); Boulogne et al. (2014)), but passed without further discussion until the work of Berteloot et al., who described their appearance on the surface of drying colloidal droplets Berteloot et al. (2012). They suggested that the bands might be either shear bands, based on a visual similarity to these features in metals Schroers and Johnson (2004), or the surface buckling of a colloidal skin.
Recently, Yang et al. have shown that these bands are indeed linked to the shear-response of a drying film Yang et al. (2015). They studied free-standing films of colloidal polystyrene, and effectively controlled the yield stress and strain-rate (drying rate) of the films. In particular, they showed how the spacing and relative widths of the bands – i.e the fraction of sheared material – agrees with the lever rule of shear localisation Yang et al. (2015). This rule, derived from the physics of two-phase coexistence, describes the instability by which shear localises into finite bands in a variety of complex fluids Ovarlez et al. (2009).
Here we give a complementary view of these shear bands, identifying the forces behind their formation. We show by direct means that they are the result of shear deformations, and further demonstrate how their pattern scales, how it can be suppressed, and discuss its origins in the compressive forces that accompany the directional drying of colloidal dispersions. In contrast to Berteloot et al. (2012); Yang et al. (2015), we study slow drying in Hele-Shaw cells, to eliminate any possible influence of a free surface or skin.
To prepare banded films, we used a variety of charge-stabilized dispersions. Polystyrene dispersions with particle diameters of 98, 100, 105, 115, 144, 198 and 283 nm were synthesized as described elsewhere Yow et al. (2010). For colloidal silica, Ludox HS (Sigma-Aldrich, nm) was dialyzed against aqueous solutions of 5 mM NaCl at pH 9.5 (by addition of NaOH), while Levasil-30 (Azko-Nobel, nm Boulogne et al. (2014)) was used as received. NaCl solutions were then mixed with the above materials to form dispersions of solids by volume, and salt concentrations of up to 60 mM. Deionized water (Millipore) was used for all procedures.
Drying experiments were performed in Hele-Shaw cells built from two 2.57.5 cm glass microscope slides, as in Fig. 2. Interposed between the slides, along their long edges, were plastic spacers of either 150, 230, 250, 300, 400 or 500 m thickness. The cells were held together by clips and their actual thicknesses were measured by microscopy after assembly. Thinner cells, with between 36–72 m, were made with heat-curable polymer sheets or double-sided tape as spacers. In each experiment a dispersion was pipetted into the cavity of a cell. The sample then dried by evaporation from one of the open short edges of the cell, at room temperature. During drying the cell was slightly inclined by a few degrees, so that any bubbles rose away from the drying edge by buoyancy.
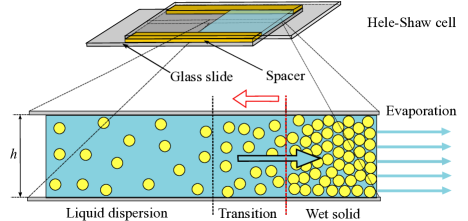
The drying of these dispersions proceeds by the advance of a solidification front into the colloidal liquid (see e.g. Allain and Limat (1995); Dufresne et al. (2003); Goehring et al. (2010); Routh (2013)), as sketched in Fig. 2. The solid film remains porous and water flows through it to balance evaporation from its open edge. This flow continuously brings more colloidal particles with it, which add to the growing solid deposit. The viscous drag of the water flowing past these particles is balanced by a gradient in their osmotic pressure, and hence a concentration gradient forms in the liquid leading up to the solidification front. Along this gradient the character of the dispersion can change rapidly, and dramatically. For example, in charge-stabilized dispersions, as those here, the particles may first be concentrated into a soft repulsive solid, where each particle is caged by long-range electrostatic interactions with its neighbors Goehring et al. (2010). The drag from the flow through this soft solid is equivalent to a uniaxial compression and can cause effects like structural anisotropy and birefringence Boulogne et al. (2014). Eventually the particles are pushed close enough together for short-range van der Waals forces to overcome their electrostatic repulsion. At this point the particles will jump into intimate contact, forming into a cohesive, rigid film Goehring et al. (2010).
We found shear bands in our dried colloidal films, in both Hele-Shaw geometries and in free-standing droplets dried from the same materials. Generally, as shown in Fig. 1 (free-standing), or in the supplemental movie SI (Hele-Shaw), the bands appeared as a dispersion changed from a liquid to a solid. They arranged into domains of stripes inclined to either the left or the right of the drying front. These domains overlapped by about one band spacing, forming domain boundaries that looked like chevrons Yang et al. (2015) opening either towards the drying front, or away from it.
The chevrons that opened towards the drying front periodically generated new bands, which appeared alternately to one side of the chevron, and then to the other. The chevrons that opened away from the drying front were sinks for growing bands. New bands could also appear between two existing bands, if they were far enough apart. A new band typically began at a point and generated two ‘tips’ that propagated simultaneously towards and away from the drying front, over several seconds. Banding always occurred well before any cracking.
The shear bands approached the liquid-solid boundary at an angle of 45∘, but were then compressed along the direction of drying over time. This smooth bending of the bands can be seen near the liquid-solid transition of Fig. 1, or in the supplemental movie SI . Later, if a film cracked, the bands were also compressed by the crack opening. Looking at 21 different fully-dried films, in both free-standing and Hele-Shaw geometries, we found that the final opening angle of the chevrons was 997∘ (mean standard deviation). There was no clear dependence on particle size or film thickness (Fig. 3).
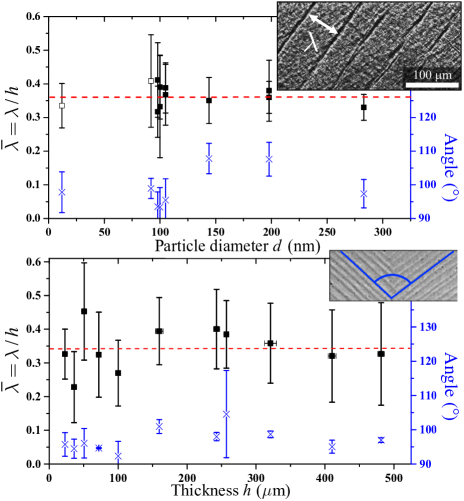
The most obvious feature of the bands is their relatively even spacing, . We observed bands in a range of fully-dried colloidal materials, and a variety of conditions. For each of eight different particle sizes we prepared 150 m thick Hele-Shaw cells, filled with 180 l of dispersion. Once dry, we imaged these cells by digital microscopy under transmitted light. We scanned across the width of each cell, collected images in about ten different locations, and measured about 20 band spacings (measured normal to the bands) per image.
Figure 3(a) shows that there was no dependence of the band spacing on the particle size, for particles between 16 and 283 nm. Here was, on average, 0.36 times the film thickness . An equal mixture of two particle sizes, 98 and 198 nm, was also consistent () with this result. However, although the bands were parallel and had a clearly defined spacing, there could be wide variations in this spacing within a single cell: as in Fig. 1, patches of wider or narrower bands often appeared together, with no apparent reason for the local variation in size. As such, we report the standard deviation (rather than the standard error) of our measurements, throughout this letter. Bands regularly formed with a range of spacings from 0.2 to 0.5 times the film thickness.
Dispersions with nm (each experiment was repeated with 92 nm silica and 105 and 115 nm polystyrene particles) were then dried in cells of different thicknesses. Figure 3(b) shows that there was no dependence of the relative band spacing on the thickness of the drying film. In other words, the band spacing scales linearly with . Although there was, again, considerable variation within the results, the average agrees with the results for changing particle size.
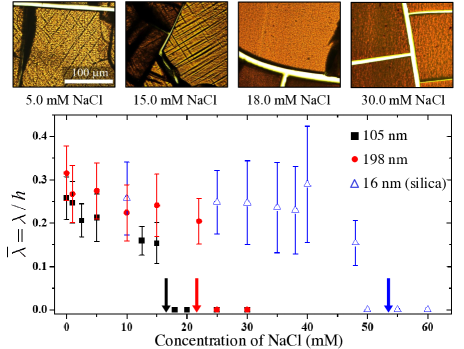
Next, we studied how the formation of bands was influenced by the salinity of the dispersions. For charged colloids, dissolved salt screens electrostatic interactions, affecting the cooperative behavior of the particles. We therefore dried 105 and 198 nm colloidal polystyrene and 16 nm colloidal silica in NaCl solutions of to up to 60 mM, in 150 m thick cells. Figure 4 shows that for each dispersion there is a cutoff salt concentration above which bands do not form. This critical concentration depends on particle size and type. Below the critical concentration there also appears to be a weak negative dependence of the band spacing on salt. Otherwise, however, all these dispersions dried exactly as before, via directional solidification, and cracked cleanly.
These experiments collectively suggest how bands form by an elastic instability, similar to fracture. They are Mode-II (sliding) cracks, or shear bands, that act to release the shear stresses that accompany directional solidification, just as the opening cracks that often form in drying paints relax in-plane tensions.
Cracks in a thin elastic film are usually regularly spaced by a small multiple of the film thickness Allain and Limat (1995); Bai et al. (2000). This is often argued to follow from how they release strain energy. For example, the height-averaged strains near a straight crack in a thin film, with a rigid boundary, decay away over a distance proportional to Xia and Hutchinson (2000). The same mechanics requires that distortions rapidly decay away from a shear band in a film attached to rigid walls, and that the mature band spacing should be proportional to the film thickness, as we have shown it is.
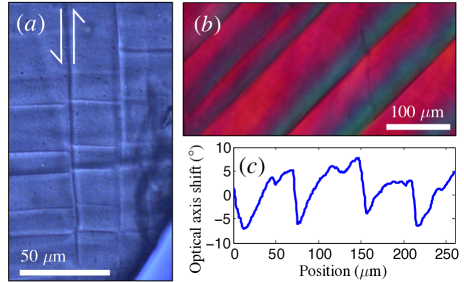
During drying, the colloidal dispersion is subjected to a uniaxial compression, caused by the drag of water flowing past the particles to the evaporating edge. Under these conditions the direction of maximum shear stress is at 45∘ to the direction of compression: for principal stresses and the shear stress at an orientation to the compression axis is ). The von Mises yield criterion (see e.g. Anderson (2000)) states that plastic failure is expected when the magnitude of this stress exceeds some critical value, and that failure will occur along the direction of maximum shear stress. Thus the orientation of the bands, and the position of their formation, show that they relieve the shear stresses generated near the solidification front. The shear motion around the bands can be seen directly in cases where bands overlap significantly, as in Fig. 5(a), or the supplemental movie SI . Later deformation, including cracking, will distort the inclination of the shear bands, but is not related to their formation.
Directionally dried colloidal films are birefringent, as their entire structure is compressed along the direction of drying Yamaguchi et al. (2013); Boulogne et al. (2014). The optical axis of a material is a direction along which birefringent effects vanish. It may be thought of as a vector that, on average, lies here normal to the solidification front Yamaguchi et al. (2013), but which can be locally rotated by any deformations. The birefringence around the shear bands (Fig. 5(b)) can thus be used to measure how the bands strain the film around themselves. We positioned our films in a cross-polarizing microscope equipped with a first-order retardation plate, so that the optical axis at a point half-way between the bands was aligned with the polarization of the transmitted light. We measured the optical axis shift at different points by finding the relative rotation required to minimize transmitted light of 546 nm. As shown in Fig. 5(c), the formation of a shear band twists the entire structure of the film, rotating the optical axis (i.e. the direction of maximum compression of the film) by 5∘ to either side of it. The sawtooth-pattern of the birefringence shows how slip is highly localized in the shear band, and how strains decay away smoothly from the slip plane.
Finally, we discuss the extinction of the shear bands with addition of salt, which shows why band formation occurs only at the liquid-solid transition of directional drying. The DLVO model of colloidal stability combines an attractive van der Waals potential at short distances with a repulsive electrostatic interaction that is screened by ions in solution Russel et al. (1989). We use the pair potential
| (1) |
to approximate the free energy of two neighboring particles of surface-separation . Here, is the Hamaker constant ( J for polystyrene Goehring et al. (2010), and J for silica Russel et al. (1989)), nm is the Bjerrum length, is the Boltzmann energy and is the Debye length. is a reduced surface potential, calculated as in Goehring et al. (2010) with a surface charge density of 0.53 C/cm2 for polystyrene particles (measured in Goehring et al. (2010)), and 2.5 C/cm2 for silica (chosen to match the zeta potentials in Healy (2006)). Adding salt lowers both and . Experience has shown that colloidal crystals Russel et al. (1989) or glasses Boulogne et al. (2014) will form when a dispersion is concentrated to the point where the pair potential at an average particle separation reaches a few times . Above this threshold the repulsive forces between particles can give rise to effective cages, freezing particles into a semi-rigid arrangement.
For the three cases studied we find that the shear bands disappear at the salt concentrations where the maximum value of is lowered to (arrows in Fig. 4). In other words, the bands vanish when the electrostatic interaction is weakened to the point where a soft repulsive solid does not have the opportunity to form during the transition from a colloidal liquid to an aggregated solid film. Since salt will not significantly affect the properties of the aggregated solid, our analysis demonstrates that it is the compression across the liquid-solid transition itself that is responsible for shear band formation.
The above model identifies the conditions for an appropriate yield-stress material to form under compressive strains during drying. A complementary description of how these strains then become localised (i.e. the lever rule) was recently given in Yang et al. (2015). We note that particle caging through electrostatic interactions will also become inefficient when , possibly explaining the absence of bands for the 200 nm particles in that study Yang et al. (2015).
Here we have shown how the shear bands that regularly appear in dried colloidal films form and scale. The bands relieve the compressive stresses associated with directional drying, by localized slip at 45∘ to the axis of compression. In particular, we have shown how the bands are driven by the compression of a soft intermediate phase that can form around the liquid-solid transition, when particles are caged by their electrostatic interactions. By engineering the response of this transition region, such as by adding salt to weaken inter-particle forces, the bands can be controlled or eliminated.
Acknowledgements.
We thank Anupam Sengupta and Carsten Krüger for assistance with the birefringence measurements, and Antoine Fourrière for helpful discussions. PK thanks the Thai DPST and Government of Thailand for funding.References
- Tsapis et al. (2005) N. Tsapis, E. R. Dufresne, S. S. Sinha, C. S. Riera, J. W. Hutchinson, L. Mahadevan, and D. A. Weitz, Phys. Rev. Lett. 94, 018302 (2005).
- Lazarus and Pauchard (2011) V. Lazarus and L. Pauchard, Soft Matter 7, 2552 (2011).
- Goehring et al. (2011) L. Goehring, W. J. Clegg, and A. F. Routh, Soft Matter 7, 7984 (2011).
- Allain and Limat (1995) C. Allain and L. Limat, Phys. Rev. Lett. 74, 2981 (1995).
- Dufresne et al. (2006) E. R. Dufresne, D. J. Stark, N. A. Greenblatt, J. X. Cheng, J. W. Hutchinson, L. Mahadevan, and D. A. Weitz, Langmuir 22, 7144 (2006).
- Deegan et al. (1997) R. D. Deegan, O. Bakajin, T. F. Dupont, G. Huber, S. R. Nagel, and T. A. Witten, Nature 389, 827 (1997).
- Harris et al. (2007) D. J. Harris, H. Hu, J. C. Conrad, and J. A. Lewis, Phys. Rev. Lett. 98, 148301 (2007).
- Parneix et al. (2010) C. Parneix, P. Vandoolaeghe, V. S. Nikolayev, D. Quéré, J. Li, and B. Cabane, Phys. Rev. Lett. 105, 266103 (2010).
- Routh (2013) A. F. Routh, Rep. Prog. Phys. 76, 046603 (2013).
- Thiele (2014) U. Thiele, Adv. Colloid Int. Sci. 206, 399 (2014).
- Hull and Caddock (1999) D. Hull and B. Caddock, J. Mat. Sci. 34, 5707 (1999).
- Goehring et al. (2010) L. Goehring, W. J. Clegg, and A. F. Routh, Langmuir 26, 9269 (2010).
- Smith and Sharp (2011) M. I. Smith and J. S. Sharp, Langmuir 27, 8009 (2011).
- Boulogne et al. (2014) F. Boulogne, L. Pauchard, F. Giorgiutti-Dauphiné, R. Botet, R. Schweins, M. Sztucki, J. Li, B. Cabane, and L. Goehring, Europhys. Lett. 105, 38005 (2014).
- Berteloot et al. (2012) G. Berteloot, A. Hoang, A. Daerr, H. P. Kavehpour, F. Lequeux, and L. Limat, J. Colloid Interface Sci. 370, 155 (2012).
- Schroers and Johnson (2004) J. Schroers and W. L. Johnson, Phys. Rev. Lett. 93, 255506 (2004).
- Yang et al. (2015) B. Yang, J. S. Sharp, and M. Smith, ACS Nano 9, 4077 (2015).
- Ovarlez et al. (2009) G. Ovarlez, S. Rodts, X. Chateau, and P. Coussot, Rheol. Acta. 48, 831 (2009).
- Yow et al. (2010) H. N. Yow, M. Goikoetxea, L. Goehring, and A. F. Routh, J. Colloid Interface Sci. 352, 542 (2010).
- Dufresne et al. (2003) E. R. Dufresne, E. I. Corwin, N. A. Greenblatt, J. Ashmore, D. Y. Wang, A. D. Dinsmore, J. X. Cheng, X. S. Xie, J. W. Hutchinson, and D. A. Weitz, Phys. Rev. Lett. 91, 224501 (2003).
- (21) See Supplemental Material at [URL will be inserted by publisher] for a movie of shear band formation.
- Bai et al. (2000) T. Bai, D. D. Pollard, and H. Gao, Nature 403, 753 (2000).
- Xia and Hutchinson (2000) Z. C. Xia and J. W. Hutchinson, J. Mech. Phys. Solids 48, 1107 (2000).
- Anderson (2000) T. L. Anderson, Fracture mechanics, fundamentals and applications, 3rd ed. (Taylor & Francis, New York, 2000) p. 610.
- Yamaguchi et al. (2013) K. Yamaguchi, S. Inasawa, and Y. Yamaguchi, Phys. Chem. Chem. Phys. 15, 2897 (2013).
- Russel et al. (1989) W. B. Russel, D. A. Saville, and W. R. Schowalter, Colloidal dispersions (Cambridge University Press, Cambridge, 1989) p. 525.
- Healy (2006) T. W. Healy, in Colloidal Silica. Fundamentals and Applications, edited by H. E. Bergna and W. O. Roberts (Taylor and Francis, 2006) pp. 247–252.