Oscillations above the barrier in the fusion of 28Si + 28Si
Abstract
Fusion cross sections of 28Si + 28Si have been measured in a range above the barrier with a very small energy step (Elab = 0.5 MeV). Regular oscillations have been observed, best evidenced in the first derivative of the energy-weighted excitation function. For the first time, quite different behaviors (the appearance of oscillations and the trend of sub-barrier cross sections) have been reproduced within the same theoretical frame, i.e., the coupled-channel model using the shallow M3Y+repulsion potential. The calculations suggest that channel couplings play an important role in the appearance of the oscillations, and that the simple relation between a peak in the derivative of the energy-weighted cross section and the height of a centrifugal barrier is lost, and so is the interpretation of the second derivative of the excitation function as a barrier distribution for this system, at energies above the Coulomb barrier.
keywords:
Heavy-ion fusion, sub-barrier cross sections, coupled-channels modelPACS:
25.70.Jj , 24.10.Eq1 Introduction
Heavy-ion fusion dynamics near and below the Coulomb barrier is a matter of continuing interest, since it allows a deep insight into the fundamental problem of quantum tunnelling of many-body systems facilitated by channel coupling effects. Cross section enhancements, barrier distributions and, more recently, fusion hindrance effects have been observed and are being investigated.
Moreover, oscillatory structures were evidenced a long time ago in the fusion excitation function of light heavy-ion systems like 12C + 12C, 12C + 16O and 16O + 16O [1, 2, 3, 4], in the energy region above the Coulomb barrier. Analogous oscillations were found for 20Ne + 20Ne [5]. In that work, it was suggested for the first time that such features are due to successive partial waves entering the fusion cross section as their centrifugal barriers are exceeded. In such cases the separation between nearby barriers is large with respect to the intrinsic energy width associated with the quantal penetration, so that the oscillations may become observable.
This topic was further analyzed in the more recent work of Esbensen [6], where earlier data on 28Si + 28Si [7] were compared to detailed calculations in the coupled-channels (CC) model, along with the experimental evidences on lighter systems. Those previous data [7] on 28Si + 28Si above the barrier have experimental errors and energy steps just too large to allow a clear-cut conclusion about the existence of oscillating structures. A more detailed investigation for this system was performed by Aguilera at al. in Ref. [8] using the -ray technique, where the authors did not observe any oscillation in the range E58-100 MeV.
The existence of such structures, and the detailed effects produced by channel couplings in the energy dependence of the fusion cross sections, can be best revealed by the first and second derivatives of the excitation function multiplied by the energy (the so-called “energy-weighted excitation function”)
| (1) |
where is the center-of-mass energy. As discussed in detail in Ref. [6], and following the Hill-Wheeler expression, each partial-wave cross section behaves like a Fermi function in the no-coupling limit, so that is the sum of individual centrifugal barriers weighted with the factor (2 + 1), each one centered at (L).
The concept of a barrier distribution as defined by B(E) has been very helpful in the analysis of several sets of fusion data near and below the Coulomb barrier for medium-mass and heavy systems, often giving a ”fingerprint” of the relevant coupled channels. Its definition was inspired by Wong’s formula whose second derivative is a symmetric distribution centered at the s-wave Coulomb barrier.
The barrier distribution does not carry any information about the individual -dependent barriers. Indeed, when the peaks of neighboring values overlap strongly, one can sum up their contributions as in Wong’s formula, and the barrier distribution is then given by B(E). The overlap between near-by peaks, however, diminishes with increasing , which typically results in the breakdown of Wong’s formula above the barrier (and of the interpretation of B(E) as a barrier distribution). This has been recognized [6] in light, symmetric systems like 16O + 16O where only even values of L contribute to fusion and the peaks are more distant from each other, but not in the fusion of heavy systems, where the condition for separating the individual centrifugal barriers (Eq.(11) of Ref. [6]) requires large values where many reaction channels open up and smear out the structures.
The hindrance phenomenon of heavy-ion fusion at deep sub-barrier energies has been observed for several systems [9, 10, 11, 12] in the last decade. The onset of fusion hindrance has often been associated with the energy where the logarithmic derivative,
| (2) |
reaches the value (named LCS) expected for a constant astrophysical -factor [13]. At that energy the -factor develops a maximum as a function of the energy. However in several cases the hindrance effect is not strong enough to produce an -factor maximum [14].
The phenomenon is very intriguing and far from being fully understood. The structure of the two colliding nuclei [15] and, possibly, couplings to transfer channels [16, 17], affect the energy threshold below which hindrance shows up.
The M3Y+repulsion potential of Ref. [18] produces a relatively shallow potential in the entrance channel and it has been capable of explaining the fusion hindrance phenomenon in many cases, when applied in CC calculations. There are other models on the market that can explain the fusion hindrance phenomenon without employing a shallow potential, for example, the model by Ichikawa et al. [19]. In that model the hindrance is caused by the damping of collective excitations for overlapping nuclei [20]. In order to resolve the differences between the two models, it is therefore of great interest to test these models against new observables, such as the oscillations that appear in the measured cross sections at high energy.
Hindrance effects are more clearly observed in heavier systems, where, on the other hand, possible consequences of stronger channel couplings also deserve attention. An intermediate case like 28Si + 28Si calls for interesting investigations. High-precision data in a sufficiently wide energy range would allow exploiting (and checking) both definitions of Eq.(1) to compare the experimental results with detailed CC calculations.
The purpose of this work is then twofold: 1) to search for oscillations in the fusion excitation function for 28Si +28Si above the barrier by careful measurements with very small energy steps, and 2) to obtain a consistent interpretation of both the sub-barrier fusion excitation function [21] and of the oscillations within the same theoretical CC model. A partial and preliminary account of the experimental part of this work was given in Ref. [22].
2 Experimental
28Si beams with intensities 15-30 pnA were delivered by the XTU Tandem accelerator of the Laboratori Nazionali di Legnaro of INFN. Targets of 28Si (with an isotopic enrichment of 99.93) 50 g/cm2 thick on 15 g/cm2 carbon backings facing the beam, were used.
Two separate series of careful measurements of the excitation function (named I and II run) have been performed in the energy range 62-78 MeV (above the barrier), with a step small enough (Elab = 0.5 MeV) to resolve possible oscillations. For each energy, at least 10000 fusion evaporation residues (ER) were detected, thus reducing the statistical error to 1 or less. The relevance of the accuracy of the 28Si beam energy in such measurement is obvious. A particular care has been devoted to this issue, by stepping the field in the 90o analysing magnet of the accelerator only downwards, so to minimise possible hysteresis effects. The maximum uncertainty in the beam energy was measured to be 0.13 [23] (90 keV at 70 MeV). When the energy is monotonically decreased, as in the present experiments, the relative beam energy uncertainty is a factor 3-4 lower.
The ER were detected at = 3o using the same set-up and procedures described in Refs. [12, 15], based on an electrostatic beam separator. This set-up is very simple to operate, allowing fast and reliable measurements of relative and absolute cross sections. In the present case, the absolute scale was fixed by normalising the relative yields to the cross sections of Ref. [21] at corresponding energies.
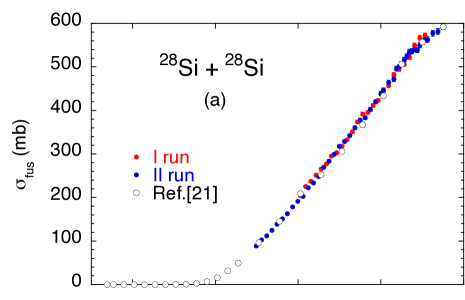
Fig. 1 shows the excitation function of 28Si +28Si in linear and logarithmic energy scales. The excitation function above the barrier looks very smooth at first sight, but a closer inspection reveals small glitches. In the figure, the statistical error bars are smaller than the symbol size and the red and blue dots refer to the two series of measurements. By extracting the derivative of the energy-weighted excitation function [6] D(E) we obtain rather regular oscillations as shown in Fig. 2, although the uncertainties become obviously larger.
It is worth noting that two well defined peaks at E35 and 36.5 MeV definitely show up in both series of data (I and II run in the figure). This reassures us about the quality of the performed measurements. However, a third peak at E33.5-34 MeV is clearly observed only in the II run, due to 2-3 points of the I run being significantly lower. In our experience, this originates from very small unwanted changes of the beam conditions (focusing, direction) when changing the energy, beyond the controls of the diagnostics. The consequences are hardly visible in the excitation function (see Fig. 1(a)), but the representation in terms of its amplifies the effect.
3 Coupled-channels analysis
CC calculations have been performed, using the same formalism and structure input recently employed for the low- and near-barrier data of 28Si +28Si [21]. In the following, as in that work, the Ch1 and Ch10 calculations refer to the no-coupling limit and to the calculation where 10 coupled channels have been considered. The M3Y+repulsion potential [18] has been used, as discussed below.
The differences from the potential used for the sub-barrier data [21] are a larger diffuseness of the imaginary potential, = 0.3 fm instead of = 0.2 fm, and a slightly smaller density radius of 28Si, 3.125 fm instead of 3.135 fm. These modifications were made because they improve the fit of the Ch10 calculation to the data of Ref. [21] by reducing the from 1.7 to 1.2. The diffuseness of the density that is used to construct the M3Y potential, as well as the diffuseness associated with the repulsion, and the strength of the imaginary potential, have not been varied ( = 0.48 fm = 0.398 fm and = 5 MeV, respectively).
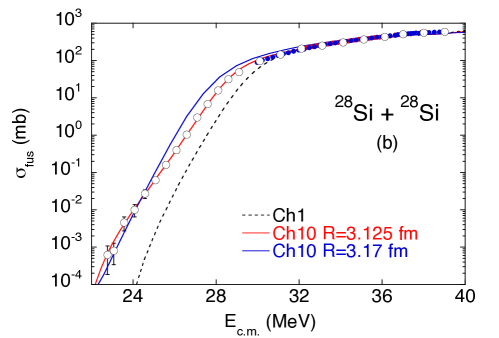
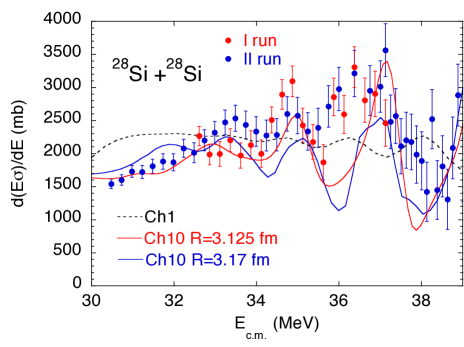
The calculated excitation function is compared to the data in Fig. 1(b). The corresponding derivative D(E) is shown in Fig. 2 (red curve) and is in fairly good agreement with the observed oscillations. We point out that the present Ch10 calculation was calibrated to fit the measured low-energy cross sections of Ref. [21]. The prediction it makes at higher energies agrees well with the new data shown in Fig. 1(b) and the first derivative of shown in Fig. 2 is also in fairly good agreement with the data. It is remarkable that the whole set of data, including the oscillations, are now reproduced within a single theoretical model.
The old data of Ref. [7] (not shown here) were originally analyzed by the CC calculations of Ref. [6] that used a rather large radius parameter R = 3.17 fm, and ar= 0.378 fm, with a relatively strong imaginary potential ( = 0.5 fm, = 10 MeV). The blue line in Fig. 2 is that calculation which agrees with the present observations rather well. However, that calculation does not fit the recent sub-barrier cross sections [21] (Fig. 1(b), blue curve) at all, even when a weaker imaginary potential is used. This leads us to the important conclusion that measuring the sub-barrier excitation function is essential for disentangling the ambiguities in the choice of the ion-ion potential that arise when only considering the data above the barrier.
The result of the no-coupling calculation Ch1 using the potential of this work is also reported in Fig. 2 as a black dashed line. Weak oscillations can be observed providing a poor fit to the experimental data. A strong effect of couplings on the position and amplitude of the peaks is obviously seen. It is tempting to associate the observed oscillations to the penetration of successive centrifugal barriers, as in lighter systems where neighboring barriers are well separated. However, this association turns out to be somewhat distorted as discussed below.
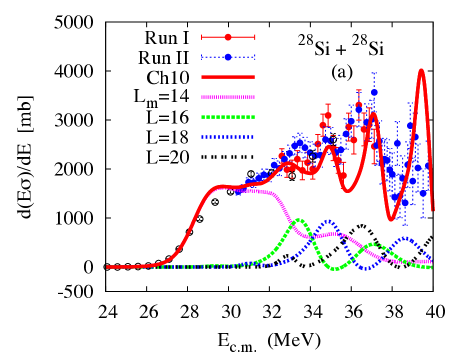
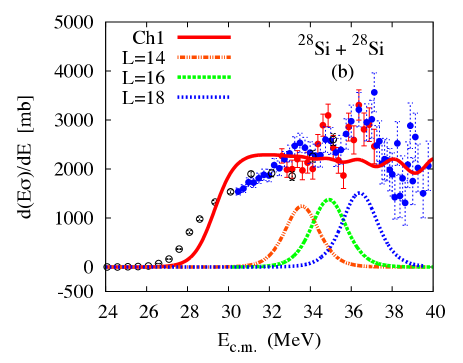
Fig. 3(a) shows again the observed oscillations together with the results of the Ch10 calculation. The individual contributions to from the angular momenta = 16-20 are also plotted. The comparison shows that the experimental peaks near 33, 35 and 37 MeV correlate with the peaks produced by the angular momenta =16, 18, and 20. However, the height of these peaks constitute less that 50% of the total distribution, partly because the peaks overlap and partly because the peaks are fragmented as discussed below. It is therefore concluded that it is not possible to assign a particular angular momentum to each experimental peak. Rather, each peak receives contributions from several -values. For example, the small peak that appears near 33 MeV for = 20 is believed to be a real and not a spurious peak because a similar small peak appears for the other values of . However, they are not visible in the linear plot of Fig. 3(a).
Ch1 calculations, i. e., without any coupled-channels effects (see also Fig. 2), are reported in Fig. 3(b). The Ch1 calculation does not contain any strong peaks. This is because the peaks for = 14, 16, and 18 in the no-coupling limit are broad and overlap, so that their sum is essentially flat. It is also seen that the three experimental peaks correlate with the three calculated peaks for = 14, 16, and 18. This correlation, nevertheless, does not allow one to assign an angular momentum to the experimental peaks, because the strong coupled-channels effects lower and fragment the effective centrifugal barriers.
The present data, along with the Ch1 and Ch10 calculations, point to the essential contribution of channel couplings for the appearance of oscillations. The magnitude of the oscillations is quite sensitive to the strength and the diffuseness of the imaginary potential. However, the peak positions are insensitive to these parameters. The diffuseness = 0.3 fm was chosen because it optimises the fit to the old data of Ref. [21]. It produces oscillations in Ch10 calculations that are in reasonable agreement with the new data, which demonstrates a consistency of the old and the new data sets. This is valid for 28Si + 28Si, but it is not a general conclusion. Indeed, in other (even near-by) systems, coupling effects might as well destroy oscillating structures reminiscent of penetration of successive -barriers.
We point out that the shallow potential we have used produces rather thick centrifugal barriers and the associated penetration factor will therefore change quickly as the beam energy increases across the barrier height. The rapid rise of the penetration factor results in relatively narrow peaks as illustrated in Fig. 3(a).
4 Fusion barrier distributions
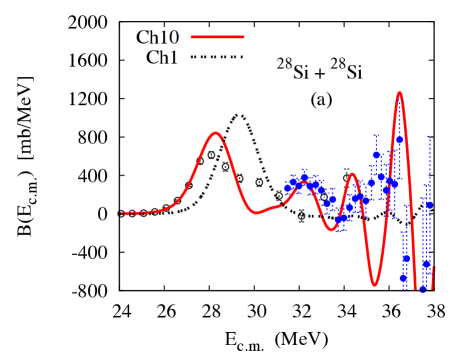
In general, the barrier distribution one obtains as the second derivative of the energy-weighted experimental cross sections or of CC calculations (see Eq. (1)) may contain several peaks, due to couplings to other reaction channels during the fusion process. The distributions extracted from the Ch1 and Ch10 calculations discussed in this paper using the M3Y+rep interaction, are compared in Fig. 4(a) to the results of the previous measurement [21] and Run II of the present measurement.
The near- and sub-barrier data produce a strongly asymmetric distribution that peaks at 28 MeV. The present data reveal a second peak at 32 MeV, in good agreement with the Ch10 calculation, although the first peak is somewhat over-predicted while the second one is well accounted for.
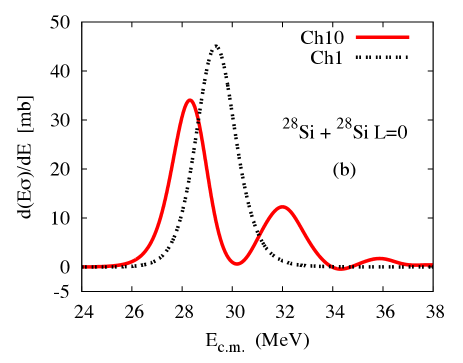
In this respect it is useful to plot (see Fig. 4(b)) the first derivative of the energy-weighted cross section for the angular momentum = 0 which is peaked at the Coulomb barrier in the Hill-Wheeler approximation [26]. It resembles the barrier distribution shown in Fig. 4(a), both with respect to the first and the second peak obtained in the Ch10 calculation. As discussed in the Introduction, this is a nice confirmation of the original idea of Rowley et al. [25], namely, that the second derivative defined in Eq. (1) can be interpreted as a barrier distribution. In particular, the experimental peak observed at 32 MeV in Fig. 4(a) is a real peak of the barrier distribution because it is confirmed by both of the Ch10 calculations that are shown in Fig. 4(a) and Fig. 4(b), respectively.
The experimental barrier distribution shown in Fig. 4(a) develops some structures at energies above the peak at 32 MeV that do not appear convincingly in Fig. 4(b). In that energy range, we have evidence that the contributions of successive -values gradually lose overlap. This implies the breakdown of Wong’s formula, and, consequently, of the interpretation of the second derivative of Eq. (1) as a barrier distribution for a system as heavy as 28Si + 28Si.
5 Conclusions
In conclusion, we have shown the results of detailed measurements of the fusion excitation function of 28Si + 28Si with very small energy steps, which reveal regular oscillations, best evidenced in the first derivative of the energy-weighted excitation function. We have been able to reproduce these high-energy oscillations and the sub-barrier cross sections, within the same coupled-channels model using the shallow M3Y+repulsion potential.
It appears that the existence of oscillations is tightly bound to channel couplings in this relatively heavy system, while in lighter cases the oscillations have been suggested to be related to the overcoming of successive centrifugal barriers well spaced in energy. In 28Si + 28Si, the oscillations do appear, but the one-to-one relation between each peak and the height of a centrifugal barrier is lost because of strong coupling effects. Checking the importance of the oblate deformation of 28Si in this, calls for an analogous experiment on the nearby system 30Si + 30Si because 30Si is essentially a spherical nucleus.
As the last point of this article we also suggest that, for 28Si + 28Si, the interpretation of the second derivative of the excitation function as a barrier distribution breaks down at energies well above the Coulomb barrier.
6 Acknowledgements
We acknowledge the highly professional work of the XTU Tandem staff during the beam times, and of M.Loriggiola for excellent target preparation. The research leading to these results has received funding from the European Union Seventh Framework Programme FP7/2007- 2013 under Grant Agreement No. 262010 - ENSAR. This work has been supported in part by Croatian Science Foundation under the project 7194. H.E. is supported by the US Department of Energy, Office of Science, Office of Nuclear Physics, Contract No. DE-AC02-06CH11357.
References
References
- [1] P. Sperr, T. H. Braid, Y. Eisen, D. G. Kovar, F. W. Prosser Jr., J. P. Schiffer, S. L. Tabor, and S. E. Vigdor, Phys. Rev. Lett. 37, 321 (1976).
- [2] P. Sperr, S. E. Vigdor, Y. Eisen, W. Henning, D. G. Kovar, T. R. Ophel, and B. Zeidman, Phys. Rev. Lett. 36, 405 (1976).
- [3] D. G. Kovar et al., Phys. Rev. C 20, 1305 (1979).
- [4] I. Tserruya, Y. Eisen, D. Pelte, A. Gavron, H. Oeschler, D. Berndt, and H. L. Harney, Phys. Rev. C 18, 1688 (1978).
- [5] N. Poffe, N. Rowley and R. Lindsay, Nucl. Phys. A 410, 498 (1983).
- [6] H. Esbensen, Phys. Rev. C 85, 064611 (2012).
- [7] S. Gary and C. Volant, Phys. Rev. C 25, 1877 (1982); Y. Nagashima et al., Phys. Rev. C 33, 176 (1986).
- [8] E. F. Aguilera, J. J. Kolata, P. A. DeYoung, and J. J. Vega, Phys. Rev. C 33, 1961 (1986).
- [9] C. L. Jiang et al., Phys. Rev.Lett. 89, 052701 (2002).
- [10] C. L. Jiang, B. B. Back, H. Esbensen, R. V. F. Janssens, and K. E. Rehm, Phys. Rev. C 73, 014613 (2006).
- [11] M. Dasgupta, D. J. Hinde, A. Diaz-Torres, B. Bouriquet, Catherine I. Low, G. J. Milburn, and J. O. Newton, Phys. Rev.Lett. 99, 192701 (2007).
- [12] A. M. Stefanini et al., Phys. Rev. C 82, 014614 (2010).
- [13] C. L. Jiang, H. Esbensen, B. B. Back, R. V. F. Janssens, and K. E. Rehm, Phys. Rev. C 69, 014604 (2004).
- [14] B. B. Back, H. Esbensen, C. L. Jiang and K. E. Rehm, Rev. Mod. Phys. 86, 317 (2014).
- [15] G. Montagnoli et al., Phys. Rev. C 85, 024607 (2012).
- [16] A. M. Stefanini et al., Phys. Lett. B 728, 639 (2014).
- [17] H. M. Jia et al., Phys. Rev. C 89, 064605 (2014).
- [18] Ş. Mişicu and H. Esbensen, Phys. Rev. Lett. 96, 11270 (2006); Phys. Rev. C 75, 034606 (2007).
- [19] T. Ichikawa, K. Hagino and A. Iwamoto, Phys. Rev. Lett. 103, 202701 (2009).
- [20] T. Ichikawa and K. Matsuyanagi, Phys. Rev. C 88, 011602(R) (2013).
- [21] G. Montagnoli et al., Phys. Rev. C 90, 044608 (2014). .
- [22] A. M. Stefanini et al., EPJ Web of Conf. 66, 03082 (2014).
- [23] A. M. Stefanini et al., Phys. Rev. Lett. 74, 864 (1995).
- [24] H. Esbensen, Phys. Rev. C 77, 054608 (2008).
- [25] N. Rowley, G. R. Satchler, and P. H. Stelson, Phys. Lett. B 154, 25 (1991).
- [26] D. L. Hill and J. A. Wheeler, Phys. Rev. 89, 1102 (1953).