A. Almasi, Ph. Brax, D. Iannuzzi, R. I. P. SedmikPhys. Rev. D911020022015Force sensor for chameleon and Casimir force experiments with parallel-plate configuration \corrauthtextCorresponding author email: a.almasi@vu.nl
Abstract
The search for non-Newtonian forces has been pursued following many different paths. Recently it was suggested that hypothetical chameleon interactions, which might explain the mechanisms behind dark energy, could be detected in a high-precision force measurement. In such an experiment, interactions between parallel plates kept at constant separation could be measured as a function of the pressure of an ambient gas, thereby identifying chameleon interactions by their unique inverse dependence on the local mass density. During the past years we have been developing a new kind of setup complying with the high requirements of the proposed experiment. In this article we present the first and most important part of this setup – the force sensor. We discuss its design, fabrication, and characterization. From the results of the latter we derive limits on chameleon interaction parameters that could be set by the forthcoming experiment. Finally, we describe the opportunity to use the same setup to measure Casimir forces at large surface separations with unprecedented accuracy, thereby potentially giving unambiguous answers to long standing open questions.
doi:
10.1103/PhysRevD.91.102002pacs:
06.20.-f, 95.36.+x, 04.80.Cc(-12pt,-719pt) ∗\thecorrauthtext
1 Introduction
Over the last couple of decades, scientists have been proposing new experiments to measure the Casimir force between two objects kept at separations up to a few m that could give new insights on how the confinement of vacuum fluctuations modifies the attraction between two interacting surfaces [1, 2]. The results reported in the literature have often been used to also set new limits on non-Newtonian forces and to explore if, at these separations, there is room for new physics [3, 4, 5]. Interestingly, apart from a few examples [6, 7, 8], all experiments to date have been carried out using either sphere-to-plate or crossed-cylinder geometries. The more obvious parallel-plate configuration can only be implemented if one can maintain a sufficient level of parallelism between the plates – a technical hurdle that most experimentalists prefer to avoid. Still, the parallel-plate configuration allows measurements of surface interactions at much larger separations, providing new opportunities to tackle questions that cannot be answered unambiguously with curved-surface experiments [9, 10, 11, 12]. One of the most interesting of these questions relates to the Khoury-Weltman theory [13], which postulates that the accelerated expansion of the universe might be driven by a self-interacting scalar field, called chameleon. The name is motivated by the peculiarity that the mass of this field depends on the density of matter in the local environment. If the chameleon field existed, it would manifest itself as an additional fifth force, which could be observable in Casimir-type force experiments. However, the relative magnitude of the chameleon interaction, with respect to other forces at the distances covered by current Casimir experiments, is too small to be detected. At larger distance (above m), this relative magnitude increases, thereby providing better chances to detect chameleon interactions. In order to trigger strong enough forces to reach the detection limit in this distance regime, however, large interacting surfaces are required, which motivates the use of parallel plate configurations. In 2010, it has been shown [14] that, if the chameleon theory is correct, a controlled change of the density of an ambient gas, in which two parallel plates of area are kept at a separation of m, could give rise to a change in the chameleon force of pN. An experiment that could measure variations of pN in the force between these plates could thus rigorously test the existence of chameleon fields. With a setup of this kind one could also perform accurate Casimir force measurements, giving one the possibility to finally settle a long standing debate on the correct description of the dielectric function of metals at zero frequency [2, 4].
Inspired by this tantalizing opportunity, we have been developing a setup aiming to comply with all requirements to detect chameleon as well as Casimir forces with sub-pN precision between parallel plates at m separation. The first step towards this Casimir and non-Newtonian force experiment (Cannex) is to demonstrate that one can fabricate a large area force sensor with the specified sensitivity. The goal of this paper is to show that this is indeed possible.
In Section 2 and Section 3, we introduce the mechanical design of the sensor and describe the processes that we have followed to fabricate a first prototype, respectively. In Section 4 we present the experimental characterization of this prototype, and compare the results to a numerical model of the design. In Section 5 and Section 6 we discuss the implications of the performance of our force sensor in the context of the upcoming Cannex experiment, and estimate the limits that could be set on chameleon parameters. Finally, Section 7 summarizes our work.
2 Design
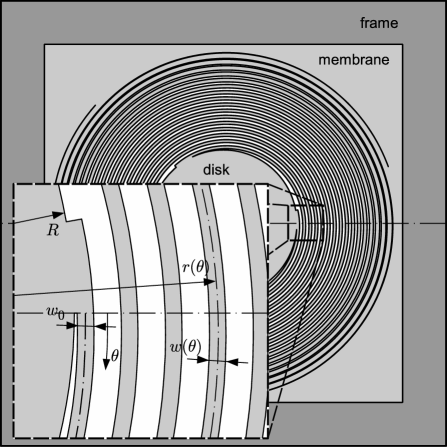
Our force sensor consists of a spring-like structure that mechanically responds to forces orthogonally applied to a cm2 disk at its center. The resulting displacement is detected by measuring the capacitance between the disk and a fixed flat plate, placed parallel at a short separation. If the two plates rest at a separation of a few tens of m, one would measure a capacitance on the order of pF. This value could be determined using a high precision capacitance bridge [15] with a sensitivity of ppm. That level of precision would then translate into a displacement sensitivity on the order of pm. In order to be able to detect force changes of pN, the spring constant of the sensor should thus not exceed N/m. A design complying with this requirement is shown in Fig. 1. The geometry consists of three spiral-shaped arms extending tangentially from the central disk. The spacing of their center lines (dash-dotted curves in the figure) is even and described by the radius , where is the radius of the disk, is the minimum spacing between arms, is the symmetry, is the angle relative to the inner starting point, and and are the widths at the inner and outer ends of the arm, respectively. In order to make optimal use of the available length and to achieve an approximately linear radial height profile (of the spring deformation), the width is chosen to follow a polynomial profile given by , where , is the length of the spiral at the position , and is the total length. The geometric dimensions have been selected to minimize spacial requirements and the response to off-axes and tilt excitations, while maximizing stability and sensitivity.
3 Fabrication
We have fabricated the force sensor described above following two different manufacturing techniques: wet etching of a silicon-on-insulator (SOI) wafer and laser cutting of a silicon wafer. The first method allows one to define the spring elements with lateral tolerances below m, and results in perfectly clean surfaces. On the downside, it appears to have a high drop-out rate and proved to be costly. The second method is limited to larger lateral tolerances (m). Furthermore, the carving process exposes the sample to significant thermo-mechanical stress, which leads to crack formation at the edges of the mechanical structures, and contaminates the surfaces with back-sputtered debris, which has to be removed by immersing the devices in hydrogen fluoride (HF) solutions. The latter process leads to the formation of holes, eroded edges, and rougher surfaces. Due to the high costs of production and the high drop-out rate, it was not possible to perform a systematic study of the devices fabricated via the wet etching procedure. Because this paper only aims at showing the overall feasibility of the force detection scheme, we have thus decided to focus on the second method. The results presented in this article have exclusively been obtained with laser-cut devices, using slightly different implementations (with respect to and ) of the geometry defined in Fig. 1. For the sake of completeness, we note that, at the time of writing, a further production process using reactive ion etching is under development. The latter technique holds the promise for low tolerances and high quality surfaces at a comparably low cost.
4 Mechanical characterization of the sensor
4.1 Methods
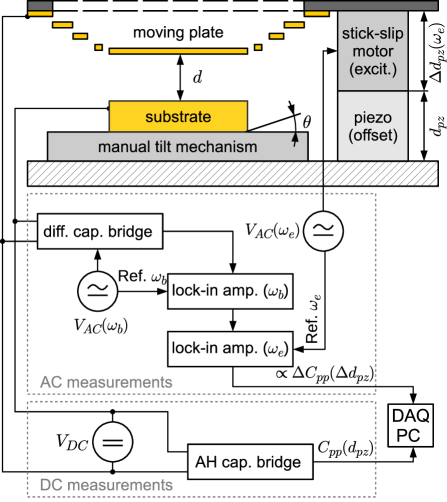
For the experimental characterization presented in this article we have constructed a simple setup, shown in Fig. 2.
The sensing element described in Section 2 is mounted with its frame on top of a calibrated feedback-controlled piezo-electric translator (PI-P753, resolution pm), which in turn is fixed to a stick-slip motor (Attocube-ANP101Z). The latter translator can be operated either in stick-slip mode for rough alignment ( can be varied roughly from zero to mm), or in piezo mode, which allows one to directly apply an external voltage to the piezo-electric transducer element to obtain continuous motion. Finally, the stack of actuators is mounted on a massive aluminum plate, which is thermally controlled to remain stable slightly above room temperature. A gold coated circular mica substrate of surface area cm2 is fixed with epoxy glue on top of a manual tilt mechanism (two-axis tilt adjustment plate for optical mirrors with an approximate range of deg.) and placed directly under the central disk of the sensor, thereby creating a parallel plate capacitance . The entire setup is placed inside a vacuum chamber (not shown) held at a pressure below mbar. As detailed below, two different detection circuits are utilized to monitor (and changes thereof) between the movable part of the transducer and the substrate.
First, we determine the dynamic mechanical response in an AC measurement by applying a small excitation to the sensor frame via the stick-slip motor operated in piezo mode 222Note that the driving voltage of the stick-slip piezo is generated directly by the internal generator of the utilized lock-in amplifier.. The response amplitude of the sensor plate around the nominal fixed distance corresponds to a relative change , where,
| (1) |
is the transfer function from base vibration to absolute movement of the sensor plate. Note that we have assumed here that can be approximated by a simple one-dimensional mechanical oscillator with effective mass , damping coefficient , and fundamental resonance frequency . For amplitudes and m, we have a signal amplitude . In order to measure as function of frequency up to Hz we use a differential analog capacitive bridge (General Radio ) driven by an external supply voltage of amplitude at frequency . Any variation results in an output of the bridge. In order to extract the net signal 333Both the differential bridge circuit and the mechanical system introduce additional phases and , respectively. For the sake of clarity, these have been dropped here. , demodulation via a dedicated lock-in amplifier (Princeton research, P128-A) is required. The amplitude can finally be measured by means of a second lock-in amplifier (Stanford research, SR830), referenced to .
In DC measurements we detect slow variations (Hz) of the absolute value of (and hence ) using an Andeen-Hagerling 2700A bridge, which for m (pF) reaches ppm resolution and ppm accuracy. We perform static deflection measurements to demonstrate the principle of force detection with the sensor. In order to do so, a known fixed voltage is applied between the sensor plate and the substrate, resulting in an attractive force . The resulting distance shift corresponds to a change , which can be measured conveniently for various settings of and .
4.2 Results
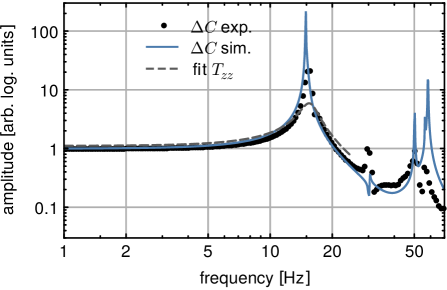
For the characterization of our design we have recorded the dynamic response as described above. In Fig. 3 the acquired data are shown in normalized form and compared to a least squares fit to Eqn. (1) with free parameters , , and . Clearly, the model fails to predict the shape of the peak. It has been demonstrated in the literature [18] that effective (lumped parameter) models may not capture significant mechanical properties, even for simpler geometries than the one of our sensor. For this reason, we resorted to numerical 3D finite element computations using the geometry described in Section 2 with silicon as the material (assuming the elasticity tensor described in the literature [19] and a mass density of kg/m3), and a vertical harmonic oscillation of the frame as excitation. As can be seen in Fig. 3, the numerical results agree very well with the measured response. Both the primary resonance at Hz (representing a translational mode of the sensor plate) and the secondary resonance at Hz (corresponding to a tilt mode) are matched by the simulation within %. The deviations in amplitude between numerical and experimental results for higher modes can be explained by considering several effects. First, tolerances of the laser cutting process create asymmetries and cross-couplings between different modes, which could not properly be taken into account in the numerical model. Second, the limited mechanical stability of the connection between the piezo stack and the transducer frame (see Fig. 2) results in a small angular tilt in addition to the vertical excitation, which amplifies the mode around Hz. Finally, the spectral resolution of the measurement is insufficient to resolve all peaks properly. Being thus assured of the validity of the numerical results we computed the vertical displacement due to static forces, from which follows an elastic constant N/m. This value can be compared to an estimation N/m based on Eqn. (1), where is the effective sensor mass with contributions of the central disk and of the spring arms. The mismatch between and shows again that a one-dimensional effective model is not applicable in this case.
Contrary to the dynamic measurements discussed above, where only the relative amplitude in dependence on the frequency was important, the experimental determination of the static response to forces acting onto the sensor’s central plate demands for an accurate knowledge of the dependence of the capacitance on all involved parameters. Since in our test setup the angular alignment between the two plates is done manually, we have to take into consideration a residual relative tilt angle between them. The dependence can be estimated via dedicated computations using commercial finite element software (Comsol Multiphysics), leading to the results shown in Fig. 4.
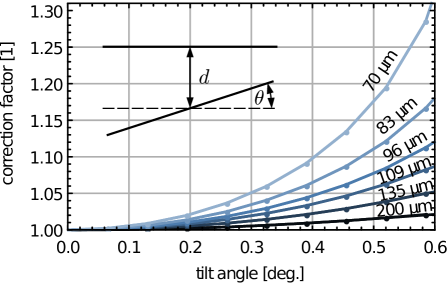
Especially at short surface separations the change in due to even small tilt angles is significant. While fringe fields contribute to errors at the percent level 444The measured capacitance will contain an offset due to fringe effects, which can be estimated [31, 32] to account for an error of % at m and % at m, respectively. An efficient way to reduce these effects is to use a ring-shaped Kelvin capacitance around the parallel plate configuration which is, however, beyond the scope of the current paper., the limited accuracy of the manual setting for in our test setup (estimated deg.) may yield changes in of % or more.
In the static response measurements, electrostatic forces , with , is generated by applied voltages , the bridge excitation with amplitude (see Fig. 2), and the offset due to (local) intrinsic surface potentials [21]. Generally, such forces result in a change of , and hence a variation in the capacity according to,
| (2a) | ||||
| (2b) | ||||
| (2c) | ||||
We interpolate the numerical results for shown in Fig. 4 using a multi-dimensional spline fit to simultaneously compute and to solve Eqn. (2a) for . This procedure yields a numerical parametric model which, again using spline interpolation, is amenable to extract , , and for known and from experimental data on by performing least squares fits.
Numerical curves corresponding to the fitted parameters are shown together with experimental data for three different distances in Fig. 5. Explicit parameter data corresponding to these fits are given in Tab. 1.
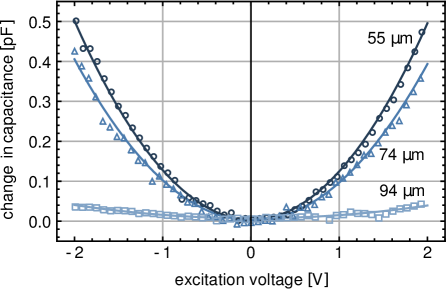
| [] | [deg] | [mV] | [fF] | [nN] | |||||||||
|---|---|---|---|---|---|---|---|---|---|---|---|---|---|
| 93. | 8 | 2.6 | 0. | 45 | 0.10 | 29 | 0. | 922 | 3. | 7 | 5. | 1 | |
| 73. | 76 | 0.17 | 0. | 632 | 0.003 | 7 | 1. | 000 | 10. | 9 | 14. | 9 | |
| 44. | 63 | 0.20 | 0. | 377 | 0.004 | 4 | 0. | 998 | 8. | 0 | 10. | 9 | |
Note that the occurrence of three free parameters in the fits leads to large uncertainties, especially in . For this reason, in the forthcoming Cannex experiment it will be of vital importance to actively reduce to below rad via a feedback mechanism.
The sensitivity of our DC measurements can be estimated from the standard deviation of the normally distributed fit residuals given in Tab. 1. Noting that , and (for frequencies ), , we can extract the corresponding force noise listed in Tab. 1. is approximately orders of magnitude larger than the targeted level for the Cannex experiment, which can intuitively be explained by the almost complete absence of isolation from electric and vibrational disturbances in the test setup in Fig. 2. This immediately demonstrates the necessity of an effective shielding and isolation system for the final experiment.
5 Expected performance of the sensor in force measurements
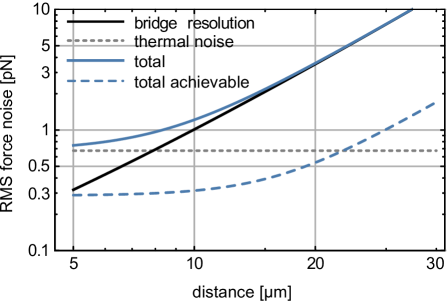
It is worthwhile to study the ultimate expected sensitivity limits imposed by the sensor design presented in this article. To start with, we assume the idealistic case that only the thermo-mechanical force noise of the sensor and the electronic noise of the bridge circuitry are present. Then we have [22],
| (3) |
where is the quality factor of the sensor, is Boltzmann constant, and stands for temperature. From the simulation results, we estimate for the current sensor. Furthermore, we consider an effective bandwidth of our bridge circuit of Hz [15], yielding an RMS noise amplitude pN. Electronic noise presumably determines the resolution of the capacitance bridge. in units of capacity () can be computed via an empirical model given by the manufacturer [15]. Using and , we can rewrite in terms of force noise . For room temperature, N/m and Vpp, we obtain the results shown in Fig. 6. Assuming and to be statistically uncorrelated, we compute the total RMS noise level for force measurements 555Note that the value used in the estimation is only valid for mbar. as (light solid line). For comparison, we also include a model calculation assuming and an advanced version (‘option E’) of the commercial bridge, yielding a much improved result (dashed line). The latter implies a sensitivity of better than at plate separation m and can be regarded as the ideally achievable limit on the precision of Cannex in the current configuration. Further improvements could be made by altering the sensor design to allow for a larger , and a higher -factor, or by using modulation techniques and a narrow detection bandwidth.
The mentioned limits regard the theoretically achievable precision with the sensor presented in this article. A full estimation of the accuracy would have to take into account the precise geometry, as well as residual fringe fields, parallelism, surface properties, external vibrations, electrical noise, and all occurring surface interactions. Yet, such an analysis is beyond the scope of the current paper. Based on the estimated resolution shown in Fig. 6 we can, however, state expectations regarding new limits on hypothetical chameleon forces, which will be measured in a differential experiment where sensitivity is more important than accuracy.
Two of us have previously estimated the expected chameleon force between two parallel plates immersed in a gaseous atmosphere of density [9, 14]. In this estimation, the authors have focused on chameleon potentials of the form,
| (4) |
where is the chameleon field, and GeV is chosen to match the cosmological constant associated with dark energy. The couplings of to all other matter fields [13] lead to an effective potential , where and are the (common) coupling constant and the reduced Planck mass, respectively. Interestingly has a local minimum , which permits the definition of a mass depending on . As it has been shown in detail in [9], the equation of motion for can be solved for the parallel plate geometry. Denoting by and , the mass and the field in the space between the plates, this solution can be written as an implicit relation between distance and field,
| (5) | ||||
Using Eqn. (5) one can then find from the gradient of an expression for the chameleon pressure,
| (6) |
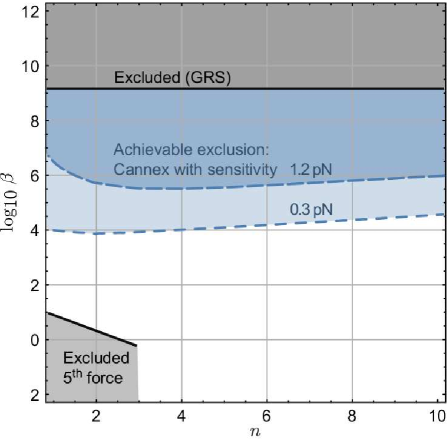
between the plates. decreases with the local density , while electrostatic, Casimir, and gravitational forces increase. This qualitative difference can be utilized to identify possible contributions of chameleon effects to the total measured force in the experiment. The amplitude of the difference in the chameleon force for two densities directly depends on the value of the parameter . As proposed in [14], such a variation in could be realized by immersing the plates in a gas of different pressures . Hence, in a measurement of for different , one could either see chameleonic effects, or set an upper limit for the coupling constant , based on the force resolution of the experiment. Fig. 7 shows constraints on as a function of on the parameter that would arise from measurements with xenon gas at room temperature at a plate separation of m, and assuming the force resolutions estimated above. With a sensitivity of pN, we could reduce the limit given in Ref. [24] by approximately orders of magnitude. If the resolution of Cannex eventually reached pN, a further improvement of orders of magnitude could be achieved. Hypothetically, with a sensitivity of pN, one could test the complete range of , and therefore, perform an absolute test for the existence of chameleon interactions.
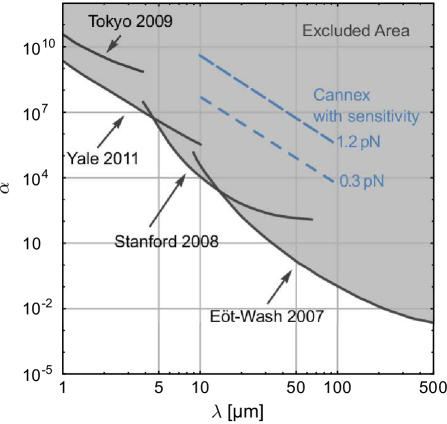
By using and in Eqn. (5) and Eqn. (6), it is possible to express our limits on in the form of the familiar - graph for Yukawa type (non-Newtonian) interactions, leading to the results shown in Fig. 8. Note that the Eöt-Wash [25] and Stanford [10] experiments, despite having a higher sensitivity for general Yukawa interactions, are not sensitive to chameleon forces due to the presence of an electrostatic shield [9].
6 Casimir
The ability to perform force measurements with sub-pN precision at surface separations larger than m yields the opportunity to not only detect non-Newtonian forces but also to possibly resolve a long standing question from a quite different field of physics - the Casimir effect.
For more than a decade (for recent reviews see [2, 4]) researchers have been trying to interpret experimental results in favor of either the Drude model or the plasma model as a valid description of the dielectric function of metals, but the available experimental data could not convince all researchers in favor of either candidates. One may write,
| (7) |
for the respective spectral dielectric functions, depending on the radial frequency , and the plasma frequency of a metal with electrons of effective mass , number density , and elementary charge , in a vacuum of dielectric constant . While both models are not rigorously defined from first principles, appears to be more ‘physical’ in the sense that it takes into account dissipation of electrons via the damping factor , which is neglected in . However, under certain conditions, the Drude model is thought to violate the second law of thermodynamics [28, 29]. If one uses the commonly applied Lifshitz theory to calculate the Casimir force between two plane parallel surfaces made of metals being described by either or , the two results will differ by more than % at plate separations m [30]. For gold surfaces of area the absolute value of at the same distance amounts to approximately pN when assuming , and more than twice as much for . Hence, even if the final accuracy of Cannex cannot match its targeted precision level of pN, a measurement of the Casimir force with absolute error of % appears to be well within the achievable range. Data produced by such an experiment in the distance regime m would allow us to unambiguously discriminate if the Drude or the plasma model are in agreement with the experiment, and thereby, to settle a issue standing for more than ten years.
7 Summary and conclusion
The Casimir and non-Newtonian force experiment (Cannex) is poised to overcome the limitations of present precision force measurements by the utilization of macroscopic plane parallel plates, sub-pN force resolution, and an effective isolation system. In this paper we characterize the core element of this experiment – the force sensor. This micro-machined device could be fabricated by wet etching, reactive ion etching, or laser cutting from silicon or SOI wafers. Geometrically, it consists of a flat central disk of area cm2, which is supported by spiral-shaped spring arms, allowing for a vertical translation of the disk. The design has been optimized to maximize the force sensitivity, while being robust enough for handling and to avoid instability under expected experimental conditions.
We have presented a static and dynamic characterization of the sensor structure. For this purpose a test setup was constructed in which the central disk is opposed to a fixed plate to form an electric capacitance. Using piezoelectric actuators we mechanically excited the sensor structure and monitored the vibration amplitude via a capacitive bridge circuit. We found that the mechanical response can not be efficiently described by a one-dimensional, lumped parameter model, but can be matched by a numerical simulation taking into account the precise geometry. By comparing numerical and experimental data we were able to determine the static force constant N/m, and the quality factor of a prototype device with larger-than-usual tolerances. In static measurements we could demonstrate the feasibility of force detection by applying an electric DC potential between the sensor and the fixed plate, resulting in a displacement which was again sensed capacitively. Due to the absence of electrical and vibrational insulation in our test setup, noise was found to be the limiting factor, leading to a force sensitivity of only nN. Assuming that external influences (mechanical, electrical, and thermal) can sufficiently be attenuated, we estimated the residual Brownian noise of the sensor using the measured -factor and resonance frequency. Considering these results and the known electrical noise of the detection system we could eventually estimate the ideally achievable precision for Cannex to be around pN (and pN with straightforward improvements) at a plate separation of m. This result gives confidence that the planned measurements can indeed unambiguously answer long-standing questions regarding the thermal contribution to the Casimir energy and give new limits to hypothetical chameleon forces, which could explain the nature of dark energy.
Before these measurements can be performed, however, we need to fully implement mechanisms to measure and maintain parallelism between our plates better than rad, and to isolate our system from seismic, acoustic, thermal, and electric influences.
8 Acknowledgments
This work was partially funded by the Foundation for Fundamental Research on Matter (FOM), which is financially supported by the Netherlands Organization for Scientific Research (NWO). R. Sedmik acknowledges his FWF Schrödinger fellowship J3050-N20 and donations by ASML and others to the Cannex crowdfunding initiative.
References
- Rodriguez et al. [2011] A. W. Rodriguez, F. Capasso, and S. G. Johnson, Nature Phot. 5, 211 (2011).
- Klimchitskaya et al. [2012a] G. L. Klimchitskaya, M. Bordag, and V. M. Mostepanenko, Int. J. Mod. Phys. A 27 (2012a).
- Decca et al. [2007] R. S. Decca, D. López, E. Fischbach, G. L. Klimchitskaya, D. E. Krause, and V. M. Mostepanenko, Phys. Rev. D 75, 077101 (2007).
- Lamoreaux [2012] S. K. Lamoreaux, Annu. Rev. Nucl. Part. Sci. 62, 37 (2012).
- Klimchitskaya et al. [2012b] G. L. Klimchitskaya, U. Mohideen, and V. M. Mostepanenko, Phys. Rev. D 86, 065025 (2012b).
- Spaarnay [1958] M. J. Spaarnay, Physica 24, 751 (1958).
- Antonini et al. [2009] P. Antonini, G. Bimonte, G. Bressi, G. Carugno, G. Galeazzi, G. Messineo, and G. Ruoso, J. Phys.: Conf. Ser. 161, 012006 (2009).
- Zou et al. [2013] J. Zou, Z. Marcet, A. W. Rodriguez, M. T. H. Reid, A. P. McCauley, I. I. Kravchenko, T. Lu, Y. Bao, S. G. Johnson, and H. B. Chan, Nature Comm. 4, 1845 (2013).
- Brax et al. [2007] Ph. Brax, C. van de Bruck, A. C. Davis, D. F. Mota, and D. Shaw, Phys. Rev. D 76, 124034 (2007).
- Geraci et al. [2008] A. A. Geraci, S. J. Smullin, D. M. Weld, J. Chiaverini, and A. Kapitulnik, Phys. Rev. D 78, 022002 (2008).
- Sushkov et al. [2011a] A. O. Sushkov, W. J. Kim, D. A. R. Dalvit, and S. K. Lamoreaux, Phys. Rev. Lett. 107, 171101 (2011a).
- Sushkov et al. [2011b] A. O. Sushkov, W. J. Kim, D. A. R. Dalvit, and S. K. Lamoreaux, Nature Phys. 7, 230 (2011b).
- Khoury and Weltman [2004] J. Khoury and A. Weltman, Phys. Rev. D 69, 044026 (2004).
- Brax et al. [2010] Ph. Brax, C. van de Bruck, A. C. Davis, D. J. Shaw, and D. Iannuzzi, Phys. Rev. Lett. 104, 241101 (2010).
- Andeen-Hagerling [2014] Andeen-Hagerling, “AH 2700A 50 hz - 20 khz ultra-precision capacitance bridge, operation and maintenance manual,” (2014), online calculation sheet retrieved 2014-12-21.
- Note [1] Note that the driving voltage of the stick-slip piezo is generated directly by the internal generator of the utilized lock-in amplifier.
- Note [2] Both the differential bridge circuit and the mechanical system introduce additional phases and , respectively. For the sake of clarity, these have been dropped here.
- Erturk and Inman [2008] A. Erturk and D.J. Inman, J. Intell. Mater. Syst. Struct. 19, 1311 (2008).
- Hopcroft et al. [2010] M.A. Hopcroft, W.D. Nix, and T.W. Kenny, J. Microelectromech. Syst. 19, 229 (2010).
- Note [3] The measured capacitance will contain an offset due to fringe effects, which can be estimated [31, 32] to account for an error of % at m and % at m, respectively. An efficient way to reduce these effects is to use a ring-shaped Kelvin capacitance around the parallel plate configuration which is, however, beyond the scope of the current paper.
- Gaillard et al. [2006] N. Gaillard, M. Gros-Jean, D. Mariolle, F. Bertin, and A. Bsiesy, Appl. Phys. Lett. 89, 154101 (2006).
- Gabrielson [1993] T.B. Gabrielson, IEEE Trans. Electron Devices 40, 903 (1993).
- Note [4] Note that the value used in the estimation is only valid for mbar.
- Jenke et al. [2014] T. Jenke, G. Cronenberg, J. Burgdörfer, L. A. Chizhova, P. Geltenbort, A.N. Ivanov, T. Lauer, T. Lins, S. Rotter, H. Saul, U. Schmidt, and H. Abele, Phys. Rev. Lett. 112, 151105 (2014).
- Kapner et al. [2007] D. J. Kapner, T. S. Cook, E. G. Adelberger, J. H. Gundlach, B. R. Heckel, C. D. Hoyle, and H. E. Swanson, Phys. Rev. Lett. 98, 021101 (2007).
- Adelberger et al. [2009] E.G. Adelberger, J.H. Gundlach, B.R. Heckel, S. Hoedl, and S. Schlamminger, Prog. Part. Nucl. Phys. 62, 102 (2009).
- Masuda and Sasaki [2009] M. Masuda and M. Sasaki, Phys. Rev. Lett. 102, 171101 (2009).
- Bezerra et al. [2004] V. B. Bezerra, G. L. Klimchitskaya, V. M. Mostepanenko, and C. Romero, Phys. Rev. A 69, 022119 (2004).
- Geyer et al. [2005] B. Geyer, G. L. Klimchitskaya, and V. M. Mostepanenko, Phys. Rev. D 72, 085009 (2005).
- Bordag et al. [2009] M. Bordag, I. V. Fialkovsky, D. M. Gitman, and D. V. Vassilevich, Phys. Rev. B 80, 245406 (2009).
- Hutson [1963] V. Hutson, Math. Proc. Cambridge Philos. Soc. 59, 211 (1963).
- Chew and Kong [1980] Weng Cho Chew and Jin Au Kong, IEEE Trans. Microw. Theory Tech. 28, 98 (1980).