Magnetization relaxation, critical current density and vortex dynamics in a Ba0.66K0.32BiO3+δ single crystal
Abstract
We have conducted extensive investigations on the magnetization and its dynamical relaxation on a Ba0.66K0.32BiO3+δ single crystal. It is found that the magnetization relaxation rate is rather weak compared with that in the cuprate superconductors, indicating a higher collective vortex pinning potential (or activation energy), although the intrinsic pinning potential is weaker. Detailed analysis leads to the following discoveries: (1) A second-peak effect on the magnetization-hysteresis-loop was observed in a very wide temperature region, ranging from 2K to 24K. Its general behavior looks like that in YBa2Cu3O7; (2) Associated with the second peak effect, the magnetization relaxation rate is inversely related to the transient superconducting current density revealing a quite general and similar mechanism for the second peak effect in many high temperature superconductors; (3) A detailed analysis based on the collective creep model reveals a large glassy exponent and a small intrinsic pinning potential ; (4) Investigation on the volume pinning force density shows that the data can be scaled to the formula with and , here is the reduced magnetic field to the irreversible magnetic field. The maximum normalized pinning force density appears near . Finally, a vortex phase diagram is drawn for showing the phase transitions or crossovers between different vortex phases.
pacs:
74.70.-b, 74.25.Ha, 74.25.Wx, 74.25.UvI Introduction
Investigation on vortex physics is very important concerning the potential high-power applications of a superconductor. In the cuprate superconductors, due to the very high superconducting transition temperature, layered structure, short coherence length, strong thermal fluctuation etc., the vortex physics is extremely rich, which has led to the unprecedented prosperous development on the vortex physicsBlatterReview . Many new concepts and phenomena, such as collective vortex creepVinokur , vortex glassFisher1 ; Fisher2 ; Koch , first order vortex transitionsZeldovNature ; Kwok , vortex meltingVortexmMelting , second peak effect of magnetizationLingS ; Bhattacharya etc. have been proposed or discovered. In the iron based superconductors, the vortex physics looks quite similar to the cuprateBSPRB81 ; vanderBeek ; Konczykowski although the anisotropy of is only about 2-5 which is much smaller than that in the cuprate systemJiaYAPL ; WangZSPRB . Preliminary experimental studies have revealed that the vortex dynamics in iron pnictide may be understood with the model of thermally activated flux motion within the scenario of collective vortex pinningYangHPRB ; ProzorovPRB ; ProzorovPhysicaC . A second-peak (SP) effect on the magnetization-hysteresis-loop (MHL) has also been observed in Ba1-xKxFe2As2YangHAPL and Ba(Fe1-xCoAs2 single crystalsProzorovPRB ; ProzorovPhysicaC ; ProzorovPRB2009 ; YNakajida . Beside the three typical high temperature superconductors, namely the cuprate, MgB2 and the iron based superconductors, the Ba1-xKxBiO3 JohnsonPRB ; CavaNature332 (hereafter abbreviated as BKBO) superconductor is quite special in terms of its relatively high transition temperature (The highest can reach about 34 KJonesJSSC78 ) and almost three-dimensional featureSYPeiPRB ; SchneemeyerNature . In the BKBO superconductors, the coherence length detected from scanning tunneling microscope (STM) and other measurements is about 3-7 nmJangPRB ; AffrontePRB ; KwokPRB40 ; Schweinfurth . The structural characteristicsSYPeiPRB , the coherence length, the Ginzburg-Landau parameterSNBariloPRB seem to be very different from those in the cuprate superconductorsVaugheyChemM ; ShepelevPhysicaC ; WorthingtonPRL ; GallagherJAP . These peculiarities may bring about new ingredients to us in understanding the vortex physics in high temperature superconductors. Therefore we have grown the Ba1-xKxBiO3 single crystals and investigated the vortex physics extensively with measurements of magnetization and its dynamical relaxation.
II Experiment
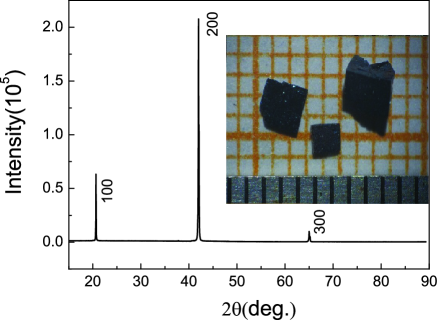
The single crystals with high quality studied in this work were prepared by the molten salt electrochemical method presented previouslyNortonMRB ; Nishio . In the process of electrochemical growth, the working electrode was made from 0.5 mm-diameter platinum wire (Alfa Aesar, 4N), and the working current was 2 mA. In addition, we placed 43 g of KOH (JK Chemical Ltd.) in a 100 cm3 Telfon container, and heat it up to 250 , staying for several hours until KOH was completely melted, then added 1.49 g of Ba(OH)28H2O (JK Chemical Ltd., 2N) and 3.22 g of Bi2O3 to the molten KOH solution, the growth begins after stirring the solution for almost two hours. In this way, the crystals can be successfully obtained with the size up to several millimeters if the growing time is long enough. The best growth time in the experiment is around 48 hours. Inset of Fig. 1 shows the photograph of samples we synthesized through the electrochemical reaction method. By the way, all the samples we measured were polished to a proper thickness in order to guarantee the homogeneity. The lattice structure of the sample was characterized by x-ray diffraction (XRD) at room temperature with a Bruck-D8-type diffractometer. The XRD pattern of a sample is shown in Fig. 1, the vast value of the intensity of the (00) indices from the XRD pattern demonstrates the -axis orientation of the single crystal. The -axis lattice constant is 4.2995 through calculating the indexed peaks. The sample composition was analyzed by using the energy dispersive x-ray spectrometer (EDX/EDS). We concluded that the composition of measured sample is about Ba0.66K0.32BiO3+δ, where the oxygen content cannot be accurately determined.
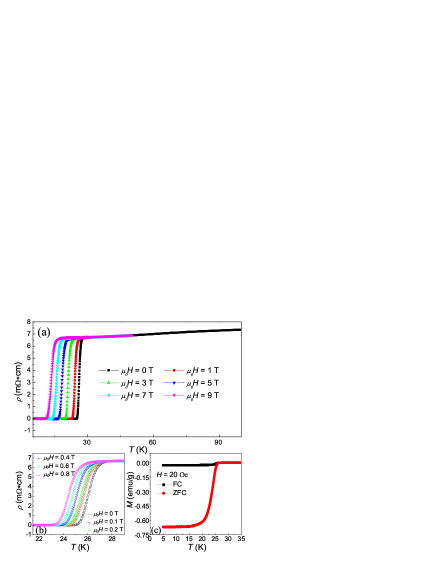
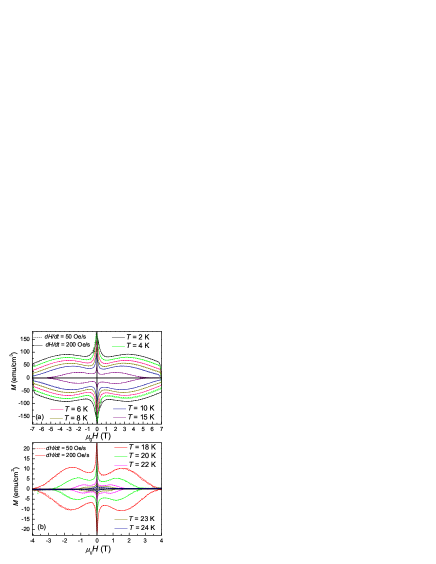
The electric transport and magnetization measurement were performed by a physical property measurement system (PPMS, Quantum Design) and SQUID vibrating sample magnetometer (SQUID-VSM, Quantum Design), respectively. Fig. 2 (a) and (b) show the temperature dependence of resistivity for the crystal Ba0.66K0.32BiO3+δ under different magnetic fields ranging from 0 T to 9 T. The onset transition temperature at zero field is about 27 K by taking a criterion of 90, here is the normal state resistivity. The diamagnetic moment of the sample is shown in Fig. 2(c) which was measured in the zero-field-cooled (ZFC) and field-cooled (FC) mode under a DC magnetic field of 20 Oe. The ZFC curve displays a transition with an onset temperature around 26.5 K. The transition temperature of the present sample is in agreement with the phase diagram reported by other groupSamataJPCS . From the results of XRD, resistivity and diamagnetic measurements, the quality of the sample has been proved to be good enough to do further study of the vortex dynamics. In Fig. 3 we show the MHL curves with a magnetic field sweeping rate of 200 Oe/s and 50 Oe/s at different temperatures ranging from 2 K to 24 K (the magnetic field is vertical to the plane of the sample). The symmetric MHL curves demonstrate that the measured sample is bulk superconductive and the vortex pinning is bulk in nature. Undoubtedly, the dia-magnetization here is not due to the surface shielding effect, and the Bean critical state model can be used.
III Models and analysis method
III.1 Thermally activated flux motion and collective flux creep
To fully understand the vortex motion in the BKBO single crystal, we start from the model of thermally activated flux motionAndersonPRL :
| (1) |
Here is the electric field induced by the vortex motion, is the attempting moving velocity of the hopping vortex lines, is the effective activation energy, and is the external magnetic field, is the local averaged magnetic induction. Based on the vortex glass Fisher1 and the collective pinning modelsVinokur , it is predicted that is positively related to , where is the glassy exponent describing the activation energy. In order to ensure that reaches zero when the external applied current approaches the critical current , then Malozemoff proposed to rewrite the activation energy in a very general way asMalozemoffPHYSICAC
| (2) |
where and are the characteristic (or called as the intrinsic) pinning energy and initial critical current density (unrelaxed), respectively. The glassy exponent gives different values for different regimes of flux creep. From the elastic manifold theory Vinokur , it is predicted that , 3/2, and 7/9 for the single vortex, small bundles, and large bundles of vortex motion respectively. Interestingly, Eq. (2) has actually covered many models describing the . For instance, when , it will go back to the Kim-Anderson modelAndersonPRL , and corresponds to the Zeldov’s logarithmic modelZeldovAPL . Furthermore, when the is much larger than , Eq. (2) will return to the form of collective pinning models. Therefore, the value of will play a significant role in understanding the vortex motion.
III.2 Models for analyzing the magnetization relaxation
For the sake of discussion, we will calculate the transient current density from the width of MHLs, where with () the magnetization at a certain magnetic field in the increasing (decreasing)-field process. According to the Bean critical state modelBEANRMP36 , the transient superconducting current density can be expressed as
| (3) |
where the unit of is emu/cm3, , are the width and length of the sample measured in cm (), respectively. In this work, we utilized the dynamical relaxation method to study the vortex dynamics, instead of using the conventional relaxation methodMJPRB ; WenHHPhysicaC95 ; WENPRB52 . The corresponding physical quantity is the magnetization-relaxation rate which is defined as:
| (4) |
The dynamical relaxation measurements are followed in this way: the sample is cooled down to a certain temperature at ambient magnetic field, and then we measure the MHL curves with two different magnetic field sweeping rates.
From the general formulas Eqs. (1) and (2) mentioned above and the definition of , we will employ the following expression to quantify the characteristic pinning energy as derived by Wen et al.WENJAC
| (5) |
here ) is a parameter which is weakly temperature dependent, is the lateral dimension of the sample. According to Eq.(5), in the low temperature region, the term of is much smaller than the term of , so we could ignore , and get , and should show a linear dependence on . However, as we will show below, in BKBO, the term is not big, but the glassy exponent is sizeable, therefore the second term becomes quite important. In the low temperature limit, we could use this approximation to extrapolate the curve down to zero temperature, the intercept gives . The relaxation rate is related to the balance of the two terms and and shows a complex temperature dependent behavior.
IV Results and discussion
IV.1 Transient superconducting current density and second peak effect
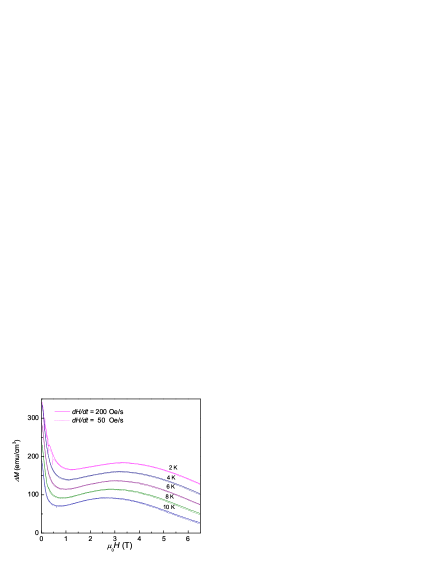
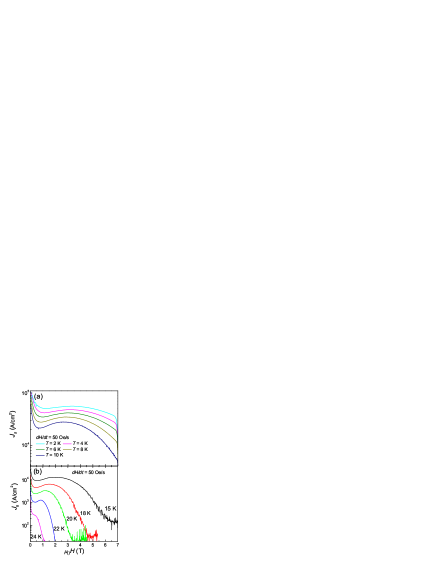
In Fig. 4, we show the field dependent with different field sweeping rates of 200 Oe/s and 50 Oe/s respectively at different temperatures ranging from 2 K to 10 K. Fig. 5 shows the field dependence of with the magnetic field sweeping rate of 50 Oe/s by using Eq. (3). The calculated at 2 K at zero magnetic field can reach up to 105 A/cm2, which is an order of magnitude larger than the values reported in literatures BARILOphysicac254 , while the is much smaller than the cuprate and iron-based superconductors. As presented in Fig. 5(b), in the high temperature region decreases greatly due to severe flux motion.
From the MHL curves in Fig. 3 and - curve in Fig. 5, we can observe second peak (SP) effect (fish-tail effect) in a very wide temperature region ranging from 2 K to 22 K. The second peak is relative to the first one near zero magnetic field in MHL or - curve, and the magnetic field of the second peak position is defined as which is dependent on temperature. We can see this clearly from Fig. 3 that the peak position of SP moves toward lower magnetic field as the temperature rises. This feature was also observed in the cuprate superconductors, such as YBa2Cu3O7 (YBCO) LKPRB49 , as well as in the iron-based superconductorsYangHAPL ; BSPRB81 . The second peak effect has been intensively studied previously, and several possible mechanisms have been proposed. These include (1) Inhomogeneities in the sample, such as nonuniform oxygen distribution in the cuprates, which generates oxygen-deficient regions acting as extra pinning centers in high magnetic fieldMDNATURE , and thus enhances the superconducting current density; (2) A crossover from fast relaxation to slow relaxation, the transition occurs between the single vortex regime and the collective pinning and creep regimes with slower relaxation at sufficiently high magnetic fields LKPRB49 ; (3) A crossover in flux dynamics from elastic to plastic vortex creep YAPRL77 . It is well-known that the SP effect in YBCO and Bi2Sr2CaCu2O8 (Bi2212) samples exhibits in different ways. In Bi2212, the SP field is low (usually a few hundreds of oersted) and weakly temperature dependent, but SP in YBCO occurs at a high magnetic field (usually a few or more than ten Tesla) and is strongly temperature dependent. Our present results in BKBO show that it is more like the SP in YBCO. This probably suggests that the SP in BKBO and YBCO is due to the similar reasons. One of possible explanations is that both systems are more three dimensional and containing oxygen vacancies. The oxygen content may not be very uniform leading to many local random pinning centers.
IV.2 Magnetization relaxation and its correlation with
It can be clearly seen from Fig. 4 that the MHL curves demonstrate a difference in magnitude with different field sweeping rates at a certain temperature. The larger the field sweeping rate is, the bigger of the MHL width will be. As we know the magnitude of the difference between the MHL curves measured at different field sweeping rates reflects how strong the vortex creep is. In the cuprate high temperature superconductors, it was found that the separation between different MHLs is quite largeWenHHPhysicaC1998 . At high temperatures, however, the magnitude of the diamagnetic moment greatly decreases with increasing magnetic field. Based on Eq. (4) for treating the magnetization relaxation, we calculated the magnetic field and temperature dependence of the dynamical relaxation rate from the data shown in Fig. 4. As presented in Fig. 6(a), it can be seen that decreases first and then increases with increasing magnetic field at temperatures of 2 K and 10 K, showing a minimum of in the intermediate magnetic field region. This corresponds very well with the width of the MHLs or the transient superconducting current density qualitatively as shown in Fig. 6(b). However, not like that reported in Ba(Fe0.92Co0.08)2As2 BSPRB81 ; KonczykowskiPRB , we do not observe a clear crossover of value near zero field, which was interpreted as a crossover from the strong intrinsic pinning near zero field to a collective pinning at a high magnetic field. This may suggest that there is just one kind of pinning mechanism for the measured BKBO single crystal.
As we know that magnetization relaxation rate is affected by not only the vortex pinning but also the interaction between vortices. In the normal circumstance, the magnetization relaxation will increase with increasing magnetic field because of the enhanced interaction between vortices at a certain temperature. The irreversible magnetization or the transient critical current density will decrease with the magnetic field as the flux creep is enhanced. However, in Fig. 6 we can observe non-monotonic magnetic field dependence of both and . Indeed, one can clearly see that when the MHL is getting wider versus magnetic field, the relaxation rate is getting smaller, showing a slower magnetization relaxation, i.e., there is a close correlation between field dependent behaviors of and (or ). This feature is very similar to those in cuprate and iron based superconductorsYeshurunSP ; BSPRB81 . What we want to notice is that the positions of minimum are roughly corresponding to the location where takes the maximum. This also reminds us that the second peak effect appearing here is just reflecting a dynamical process of the vortex entity, but not the detailed characteristics of the pinning centers, because one cannot guarantee the pining mechanism is the same in all these different superconductors. It would be very interesting to measure the magnetization relaxation in a long time scale, to reveal whether the SP effect corresponds to a static vortex phase transitionYeshurun2 .
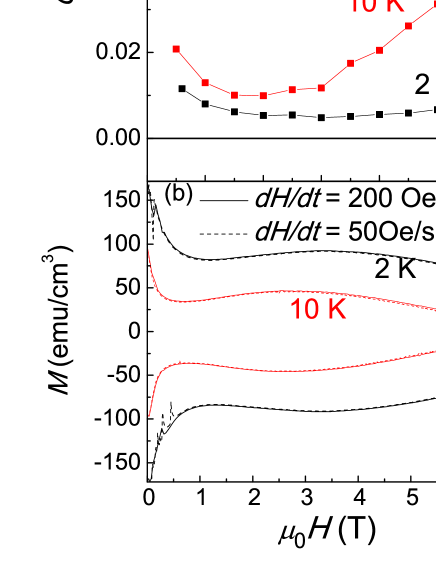
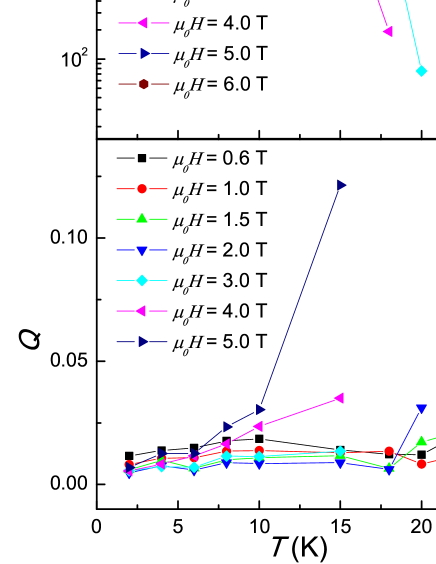
Fig. 7 shows the temperature dependence of transient superconducting current density and dynamical relaxation rate taken from field dependent values at various temperatures, respectively. We notice that in the low and intermediate temperature region, the curves of at different magnetic fields almost merge together below 6 T, which disperses clearly in high temperature region. This behavior is similar to that of Ba(Fe0.88Co0.12)2As2BSPRB81 , and may be caused by the SP effect which prevents the rapid decreasing of . Associated with the SP effect, the magnetization relaxation rate is inversely related to transient superconducting current density as shown in Fig. 7(b). As we mentioned already that there is a plateau in curve below 18 K, and below 2 T the value decreases with increasing field, all these features demonstrate that the -plateau and the SP effect are closely related. When it is in the collective creep regime, the magnetization relaxation rate is low and exhibits a plateau, thus the transient critical current density decays slowly with temperature. It seems that all these features can be explained coherently.
As addressed above, a plateau of appears in the intermediate temperature region which is followed by a severe increase in the high temperature region. This behavior of magnetization relaxation rate was also observed in cuprate superconductor YBCORGprl72 and iron-based superconductors, such as Ba(Fe0.92Co0.08)2As2 BSPRB81 and SmFeAsO0.9F0.1 YangHPRB . This plateau cannot be understood within the picture of single vortex creep with a rigid hopping length as predicted by the Kim-Anderson model, but perhaps due to the effect of collective flux creep. The reason is that, in the Kim-Anderson model,it is quite easy to derive that . Suppose is a weak temperature dependent function, we have , which contradicts the observation of a -plateau in the intermediate temperature region. As described in Eq. (5), the relaxation rate is dependent on both and . In the intermediate temperature region, the term of becomes much larger than and we will get almost constant value of , which provides a simple explanation of the plateau.
A coherent picture to interpret the complex temperature and magnetic field dependence of and is thus proposed in the following way. When the magnetic field increases from zero, the vortex system runs into the vortex glass regime with much smaller relaxation rate. In the high field region, the magnetic relaxation rate goes up drastically, meanwhile the transient superconducting current drops down quickly as shown in Fig. 7(a), which could be interpreted as a crossover from the elastic motion to a plastic one of the vortex system.
IV.3 Analysis based on the collective pinning/creep model
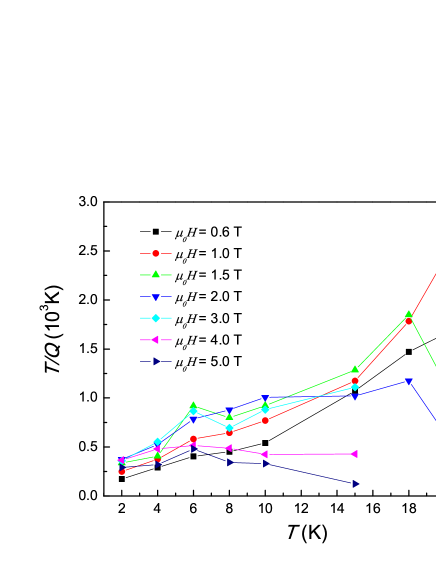
Now let’s have a quantitative consideration on the vortex dynamics based on the collective pinning/creep model. According to Eq. (5), the intercept of - curve will give and the slope gives rise to if we assume and is weakly temperature dependent. In Fig.8 we present the vs. at different magnetic fields ranging from 0.6 T to 5 T. One can see that the intercept is actually very small, about 111 K at 1 T, and 198 K at 2 T, which is much smaller than the value of over 3000 K in MgB2 MgB2Uc and also smaller than about 300-500 K in YBCO WenHHPhysicaC95 ; WENJAC . However, since is quite large and the relaxation rate is very small, the collective pinning should play the role here. As we discussed above, in the model of collective creep, the glassy exponent becomes influential on the vortex dynamics. From Eq.(5), one can see that can be determined from the slope of vs . From our data, we obtained the value in the low temperature regime at 1 T from Fig. 8. So in the intermediate temperature region, and we will get the plateau of as shown in Fig. 7(b). Meanwhile, the parameter can be determined by the slope of vs WenHHPRL1997 ; WenHHPhysicaC95 , and we get the and the glassy exponent . The value of is much larger than 1 and clearly shows a collective creep effect. Actually, can also be estimatedWenHHPRL1997 from . From this equation, one can imagine that large means a stronger glassy effect, showing a strong downward curvature in the vs curve. All these indicate that the vortex pinning and dynamics in BKBO can be described by the collective pinning/creep model with weak characteristic pinning energy but large glassy exponent .
IV.4 Characteristics of pinning force density
.
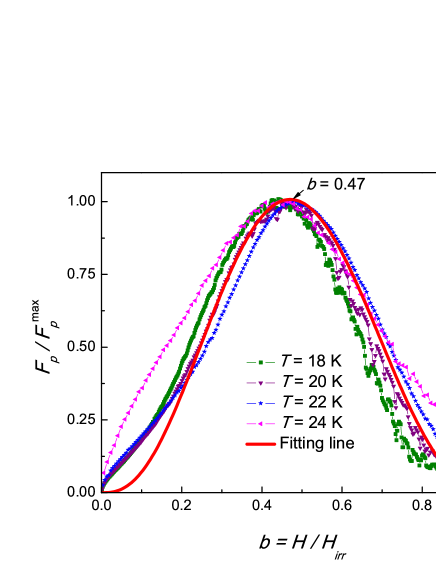
In order to get further insight into the origin of the second peak effect, we need to analyze the pinning force density which is proportional to . In Fig. 9 we show the normalized to its maximum value as a function of reduced field , and is the irreversible magnetic field determined using a criterion of A/cm2. Although there is uncertainty to determine , the curves of normalized pinning force at different temperatures seem to scale well and have the similar maximum value, which is different from the poor scaling results observed in the thick films of BKBOBKBOfilm . The maximum of the pinning force density locates at . We use the following expression to study the pinning mechanism for the sample Ba0.66K0.32BiO3+δ
| (6) |
where , and are the parameters, and the values of and can tell us the characteristic properties of the vortex pinning mechanism in the sample. We use this equation to fit the data, which is presented as the red line in Fig. 9. It can be seen that the fitting curve with and catches the main feature of the experimental data. As we know the cuprate high-temperature superconductors are usually satisfied with the relation , e.g., , were obtained for YBCO single crystals JNPHYSICAC169 , and , for BSCCO single crystal RosePHYSICAC170 . In this sample, for the maximum value of the pinning force density is near 0.5 which corresponds to the -type pinningKRAMERJAP44 , however this kind of pinning requests . Further studies are still required to resolve this discrepancy.
V Vortex phase and general discussion
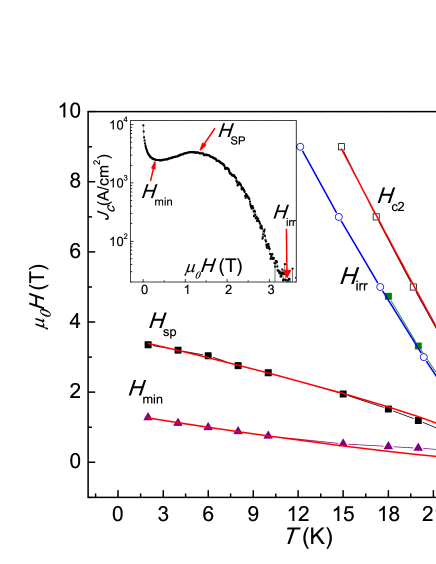
In Fig. 10, we present the vortex phase diagram of the sample Ba0.66K0.32BiO3+δ. The upper critical field and the irreversible field shown as open symbols in Fig. 10 are determined by a criterion of and in Fig. 2. The three characteristic fields are shown as solid symbols in Fig. 10, i.e., the second magnetization peak field , determined at the minimum point of or between the first and the second magnetization peak, and the irreversibility field determined from the field dependent curve in Fig. 5. In order to get more information, we use the expression to fit these curves. We got the following values: for and T, for and T, for and T. The exponent from the - curve is almost half less than that of YBCO LKPRB49 . It is clear that in BKBO, the separation between - and - is small, which is similar to YBCO and indicates a rather weak vortex fluctuation. In addition, one can see that the separation between - and - curves is quite large. One cannot interpret this large region as due to the non-uniform distribution of disorders or pinning centers. However, it is reasonable to understand this region as the plastic flux motion since this phase can gradually “melt” through losing the rigidity of the vortex manifold. It is interesting to note that the looks very similar to that in YBCO, but very different from that in Bi2212. Therefore we believe that the second peak effect, at least in BKBO and YBCO, may be induced by the similar reason. It is quite possible that the elastic energy which depends on the shear module is an influential factor for the occurrence of the second peak effect.
VI Concluding Remarks
We have investigated the vortex dynamics and phase diagram through measuring the magnetization and its relaxation on a Ba0.66K0.32BiO3+δ single crystal with transition temperature K. Second magnetization peak has been observed in wide temperature region from 2 K to 24 K. It is found that through out the non-monotonic magnetic field dependence of the magnetization, the relaxation rate is inversely related to the transient critical current density, indicating that the SP effect is dynamical in nature. It is found that many observed features can be coherently described by the collective pinning/creep model. Through the fitting and analysis, we find that the characteristic pinning energy is quite small (about 198 K at 2 T), but the glassy exponent is quite large, which induces a relatively small magnetization relaxation rate. A universal scaling law for the pinning force density vs is found, which suggests that the pinning mechanism is probably -type. The characteristics of the SP effect and magnetization relaxation as well as the vortex dynamics of the system allow us to conclude that it is more like those in the cuprate superconductor YBCO.
VII Acknowledgments
We thank Xiang Ma and Dong Sheng for the assistance in SEM/EDS measurements. This work was supported by NSF of China with the project numbers 11034011 and 11190020, the Ministry of Science and Technology of China (973 projects: 2011CBA00102, 2012CB821403) and PAPD.
References
- (1) G. Blatter, V. M. Feigelman, V. B. Geshkenbein, A. I. Larkin, and V. M. Vinokur, Rev. Mod. Phys. 66, 1125 (1994).
- (2) M. V. Feigelman, V. B. Geshkenbein, A. I. Larkin, and V. M. Vinokur, Phys. Rev. Lett. 63, 2303 (1989).
- (3) M. P. A. Fisher, Phys. Rev. Lett. 62, 1415 (1989).
- (4) D. S. Fisher, M. P. A. Fisher, and D. A. Huse, Phys. Rev. B 43, 130 (1991).
- (5) R. H. Koch, V. Foglietti, W. J. Gallagher, G. Koren, A. Gupta, and M. P. A. Fisher, Phys. Rev. Lett. 63, 1511 (1989).
- (6) E. Zeldov, D. Majer, M. Konczykowski, V. B. Geshkenbein, V. M. Vinokur, H. Shtrikman, Nature (London) 375, 373 (1995).
- (7) A. M. Petrean, L. M. Paulius, W. K. Kwok, J. A. Fendrich, and G. W. Crabtree, Phys. Rev. Lett. 84, 5852 (2000).
- (8) P. L. Gammel, L. F. Schneemeyer, J. V. Wasczak, and D. J. Bishop, Phys. Rev. Lett. 61, 1666 (1988).
- (9) X. S. Ling, J. E. Berger, D. E. Prober, Phys. Rev. B 57, 3249 (1998).
- (10) S. Bhattacharya and M. J. Higgins, Phys. Rev. Lett. 70, 2617 (1992).
- (11) B. Shen, P. Cheng, Z. S. Wang, L. Fang, C. Ren, L. Shan, and H. H. Wen, Phys. Rev. B 81, 014503 (2010).
- (12) C. J. van der Beek, P. H. Kes, Phys. Rev. B 43, 13032 (1991).
- (13) D. Majer, E. Zeldov, and M. Konczykowski, Phys. Rev. Lett. 75, 1166 (1995).
- (14) Y. Jia, P. Cheng, L.Fang, H. Q. Luo, H. Yang, C. Ren, L. Shan, C. Z. Gu, and H. H. Wen, Appl. Phys. Lett. 93, 032503 (2008).
- (15) U. Welp, R. Xie, A. E. Koshelev, W. K. Kwok, H. Q. Luo, Z. S. Wang, G. Mu, and H. H. Wen, Phys. Rev. B 79, 094505 (2009).
- (16) H. Yang, C. Ren, L. Shan, H. H. Wen, Phys. Rev. B 78, 092504 (2008).
- (17) R. Prozorov, N. Ni, M. A. Tanatar, V. G. Kogan, R. T. Gordon, C. Martin, E. C. Blomberg, P. Prommapan, J. Q. Yan, S. L. Bud’ko, P. C. Canfield, Phys. Rev. B 78, 224506 (2008).
- (18) R. Prozorov, M. A. Tanatar, E. C. Blomberg, P. Prommapan, R. T. Gordon, N. Ni, S. L. Bud’ko, P. C. Canfield , Physica C 469, 667 (2009).
- (19) H. Yang, H. Q. Luo, Z. S. Wang, H. H. Wen, Appl. Phys. Lett. 93, 142506 (2008).
- (20) R. Prozorov, M. A. Tanatar, N. Ni, A. Kreyssig, S. Nandi, S. L. Bud’ko, A. I. Goldman, P. C. Canfield, Phys. Rev. B 80, 174517 (2009).
- (21) Y. Nakajima, Y. Tsuchiya, T. Taen, T. Tamegai, S. Okayasu, M. Sasase, Phys. Rev. B 80, 012510 (2009).
- (22) L. F. Mattheiss, E. M. Gyorgy, and D. W. Johnson, Phys. Rev. B 37, 3745 (1988).
- (23) R. J. Cava, B. Batlogg, J. J. Krajewski, R. Farrow, L. W. Rupp Jr, A. E. White, K. Short, W. F. Peck, T. Kometani, Nature (London) 332, 814 (1988).
- (24) N. L. Jones, J. B. Parise, R. B. Flippen, A. W. Sleight, J. Solid State Chem. 78, 319 (1989).
- (25) S. Pei, J. D. Jorgensen, B. Dabrowski, D. G. Hinks, D. R. Richards, A. W. Mitchell, J. M. Newsam, S. K. Sinha, D. Vaknin, and A. J. Jacobson, Phys. Rev. B 41, 4126 (1990).
- (26) L. F. Schneemeyer, J. K. Thomas, T. Siegrist, B. Batlogg, L. W. Rupp, R. L. Opila, R. J. Cava, and D. W. Murphy, Nature 335, 421 (1988)
- (27) H. C. Jang, M. H. Hsieh, D. S. Lee, and H. E. Horng, Phys. Rev. B, 42, 2551 (1990).
- (28) M. Affronte, J. Marcus, C. Escribe-Filippini, A. Sulpice, H. Rakoto, J. M. Broto, J. C. Ousset, S. Askenazy, and A. G. M. Jansen, Phys. Rev. B 49, 3502 (1994)
- (29) W. K. Kwok, U. Welp, G. Crabtree, K. G. Vandervoort, R. Hulsher, Y. Zheng, B. Dabrowski, and L. G. Hinks, Phys. Rev. B 40 , 9400 (1989).
- (30) R. A. Schweinfurth, C. E. Platt, M. R. Teepl, and D. J. van Harlingen, Appl. Phys. Lett. 61, 480(1992)
- (31) S. N. Barilo, S. V. Shiryaev, V. I. Gatalskaya, J. W. Lynn, M. Baran, H. Szymczak, R. Szymczak, and D. Dew-Hughes, Phys. Rev. B 58, 12355 (1998)
- (32) J. T. Vaughey , J. P. Thiel , E. F. Hasty , D. A. Groenke , Charlotte L. Stern , K. R. Poeppelmeier , B. Dabrowski , D. G. Hinks , A. W. Mitchell, Chem. Mater. 3, 935 (1991)
- (33) Yu. F. Shepelev, A. A. Levin, Yu. I. Smolin, Physica C 215, 371 (1993)
- (34) T. K. Worthington, W. J. Gallagher, T. R. Dinger, Phys. Rev. Lett. 59, 1160 (1987)
- (35) W. J. Gallagher, J. Appl. Phys. 63, 4216 (1988)
- (36) M. L. Norton, Mat. Res. Bull. 24, 1391 (1989).
- (37) T. Nishio, H. Minami, H. Uwe, Physica C. 357, 376 (2001).
- (38) Y. Nagata, A. Mishiro, T. Uchida, M. Ohtsuka, H. Samata, J. Phys. Chem. Solids. 60, 1933-1942 (1999).
- (39) P. W. Anderson, Phys. Rev. Lett. 9, 309 (1962).
- (40) A. P. Malozemoff, Physica C. 185-189, 264 (1991).
- (41) E. Zeldov, N. M. Amer, G. Koren, A. Gupta, M. W. McElfresh and R. J. Gambino, Appl. Phys. Lett. 56, 680 (1990).
- (42) C. P. Bean, Rev. Mod. Phys. 36, 31 (1964).
- (43) M. Jirsa, L.Pust, D. Dlouhy, M. R. Koblischka, Phys. Rev. B 55, 3276 (1997).
- (44) H. H. Wen, H. G. Schnack, R. Griessen, B. Dam, J. Rector, Physica C 241 353 (1995).
- (45) H. H. Wen, Z. X. Zhao, R. J. Wijngaarden, J. Rector, B. Dam, and R. Griessen, Phys. Rev. B 52, 4583 (1995).
- (46) H. H. Wen, R. Griessen, D. G. de Groot, B. Dam, J. Rector, J. Alloys Compd. 195 427 (1993).
- (47) S. N. Barilo, V. I. Gatalskaya, S. V. Shiryaev, A. S. Shestaca, L. A. Kurochkina, T. V. Smirnovaa, V. T. Koyavab, N. S. Orlovaa, A. V. Pushkareva, Physica C 254 181 (1995).
- (48) L. Klein, E. R. Yacoby, E. R. Yacoby, Y. Yeshurun, A. Erb, G. Muller-Vogt, V. Breit, H. Wuhl, Phys. Rev. B 49, 4403 (1994).
- (49) M. Daumling, J. M. Senntjens and D. C. Larbalestier, Nature (London) 346 332 (1980).
- (50) Y. Abulafia, A. Shaulov, Y. Wolfus, R. Prozorov, L. Burlachkov, and Y. Yeshurun, D. Majer and E. Zeldov, H. Wuhl, V. B. Geshkenbein, V. M. Vinokur, Phys. Rev. Lett. 77, 1596 (1996).
- (51) H. H. Wen, P. Ziemann, H. A. Radovan, T. Herzog, Physica C 305, 185 (1998).
- (52) M. Konczykowski, C. J. van der Beek, M. A. Tanatar,H. Q. Luo, Z. S. Wang, B. Shen, H. H. Wen. Phys. Rev. B 86, 024515(2012).
- (53) Y. Yeshurun, A. P. Malozemoff, F. Holtzberg, T. R. Dinger, Phys. Rev. B 38, 11828 (1988).
- (54) Y. Yeshurun, A. P. Malozemoff, and F. Holtzberg, J. Appl. Phys. 64 5797 (1988).
- (55) R. Griessen, H. H. Wen, A. J. J. van Dalen, B. Dam, J. Rector, H. G. Schnack, S. Libbrecht, E. Osquiguil, and Y. Bruynseraede, Phys. Rev. Lett. 72, 1910 (1993).
- (56) H. Jin, H. H. Wen, H. P. Yang, Z. Y. Liu, Z. A. Ren, G. C. Che, and Z. X. Zhao, Appl. Phys. Lett. 83, 2626 (2003).
- (57) H. H. Wen, A. F. Th. Hoekstra, R. Griessen, S. L. Yan, L. Fang, and M. S. Si, Phys. Rev. Lett. 79, 1559 (1997).
- (58) S. N. Barilo, V. I. Gatalskaya, S. V. Shiryaev, T. V. Smirnova, H. Szymczak, R. Szymczak, and M. Baran, Phys. Status Solidi A 181, 471 (2000).
- (59) J. N. Li, F. R. De Boer, L. W. Roeland, M. J. V. Menken, K. Kadowaki, A. A. Menovsky and J. J. M. Franse,Physica C 169, 81 (1990).
- (60) R. A. Rose, S. B. Ota, P. A. J. De Groot and B. Jayaram, Physica C 170, 51 (1990).
- (61) E. J. Kramer, J. Appl. Phys. 44, 1360 (1973).