Phase diagram of interacting spinless fermions on the honeycomb lattice:
a comprehensive exact diagonalization study
Abstract
We investigate the phase diagram of spinless fermions with nearest and next-nearest neighbour density-density interactions on the honeycomb lattice at half-filling. Using Exact Diagonalization techniques of the full Hamiltonian and constrained subspaces, combined with a careful choice of finite-size clusters, we determine the different charge orderings that occur for large interactions. In this regime we find a two-sublattice Néel-like state, a charge modulated state with a tripling of the unit cell, a zig-zag phase and a novel charge ordered states with a 12 site unit cells we call Néel domain wall crystal, as well as a region of phase separation for attractive interactions. A sizeable region of the phase diagram is classically degenerate, but it remains unclear whether an order-by-disorder mechanism will lift the degeneracy. For intermediate repulsion we find evidence for a Kekulé or plaquette bond-order wave phase. We also investigate the possibility of a spontaneous Chern insulator phase (dubbed topological Mott insulator), as previously put forward by several mean-field studies. Although we are unable to detect convincing evidence for this phase based on energy spectra and order parameters, we find an enhancement of current-current correlations with the expected spatial structure compared to the non-interacting situation. While for the studied model the phase transition to the putative topological Mott insulator is preempted by the phase transitions to the various ordered states, our findings might hint at the possibility for a topological Mott insulator in an enlarged Hamiltonian parameter space, where the competing phases are suppressed.
pacs:
71.10.Fd, 71.27.+a, 71.30.+h, 75.40.MgI Introduction
The seminal discoveries of quantum Hall phases Prange and Girvin (1990) have provided the first examples of topological phases of matter, i.e. phases which cannot be adiabatically connected to conventional ones. More recently, several other topological insulators or superconductors have been theoretically predicted and experimentally observed Hasan and Kane (2010); Qi and Zhang (2011), giving rise to an intense activity of the community. For such materials, a very thorough understanding has been achieved thanks to the fact that a noninteracting starting point is sufficient: indeed, topological insulators can be obtained from band theory in the presence of strong spin-orbit coupling.
On the other hand, given the variety of electronic phases that are also generated by strong interactions, a highly topical question is to investigate the appearance of topological insulators due to correlations. This new route would not require intrinsic spin-orbit coupling, and thus could be advantageous to many applications. Nevertheless, we face the well-known difficulty of strongly correlated systems for which we lack unbiased tools, and often have to resort to some hypothesis. In this context, a very promising result has been obtained by Raghu et al. Raghu et al. (2008) who have shown the emergence of quantum anomalous (spin) Hall (QAH) states on the honeycomb lattice with strong density-density repulsions between next-nearest neighbors. These phases can be characterized by the existence of spontaneously appearing charge (respectively spin) currents for spinless (respectively spinful) fermions. This finding has also been reproduced in the spinless case using more systematic mean-field approaches Weeks and Franz (2010); Grushin et al. (2013). Nevertheless, in the latter study, Grushin et al. (2013) the QAH extension in the phase diagram has shrunk substantially due to the stability of charge modulation with larger unit cell.
The possibility to generate topological phases with longer-range interactions has triggered a large theoretical activity to investigate its experimental feasibility using metallic substrate Pereg-Barnea and Refael (2012), cold-atomic gases on optical lattices Dauphin et al. (2012) or RKKY interaction Liu et al. among many others.
In the light of several recent approximate and numerical studies García-Martínez et al. (2013); Daghofer and Hohenadler (2014); Đurić et al. (2014) with conflicting conclusions regarding the presence of the putative topological Mott state and competing ordered phases, we feel that a comprehensive state-of-the-art exact diagonalization study could shed some light on these issues. Based on our simulations, we will provide numerical evidence that quantum fluctuations at small are responsible for an enhanced response similar to the QAH state, but unfortunately our numerical data (obtained on finite clusters up to sites) indicates that these short-range fluctuations presumably do not turn into a true long-range ordered phase. In addition, we will provide a detailed analysis of the charge and bond orderings that occur at large interaction strength, allowing us to sketch a global phase diagram of the minimal model studied so far. In Sec. II, we detail the model and methods we use. We then discuss the large interaction (classical) limit in Sec. III. Our numerical results are given in Sec. IV, and we conclude in Sec. V.
II Model, method and phase diagram
II.1 Hamiltonian
Following the proposal by Raghu et al. Raghu et al., 2008 of an exotic topological Mott insulator in a half-filled honeycomb lattice with interaction, we will consider the following Hamiltonian :
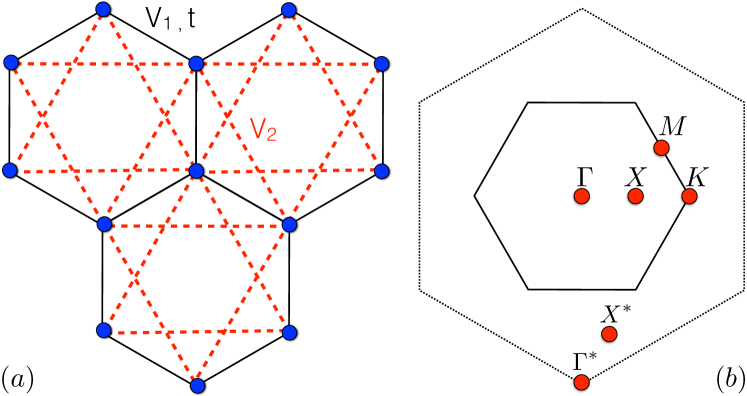
depicted in Fig. 1(a), where and are the spinless fermionic operators, is the nearest-neighbor hopping amplitude, and are the density-density repulsion or attraction strengths respectively on nearest- and next-nearest neighbors. Note that we will focus on the half-filled case where thanks to particle-hole symmetry, the chemical potential is known to be zero exactly.
Despite the particle-hole symmetry, it seems that quantum Monte-Carlo (QMC) approaches exhibit a sign problem that prohibits them. In fact, only in the simpler case which exhibits a direct phase transition from semi-metallic (SM) phase to charge density wave (CDW) as a function of , a very interesting recent proposal was made allowing to reformulate the problem without sign-problem Huffman and Chandrasekharan (2014), thus amenable to accurate, unbiased QMC simulations Wang et al. (2014). Quite remarkably, the case and can also be studied with QMC without a minus-sign problem using a Majorana representation Li et al. (2015). In the absence of a QMC algorithm for the frustrated case, we use Exact Diagonalization (ED) to get unbiased numerical results. Of course, one is limited in the sizes available but, since we are investigating in particular the topological QAH phase which is a translationally invariant () instability (see below), we can in principle use any finite-size lattice, even though some of them do not have the full space-group symmetry. On the other hand, when looking at competing charge instabilities, it is crucial to consider only clusters compatible with such orderings and we will devote some discussion on this topic in the next subsection.
II.2 Finite lattices
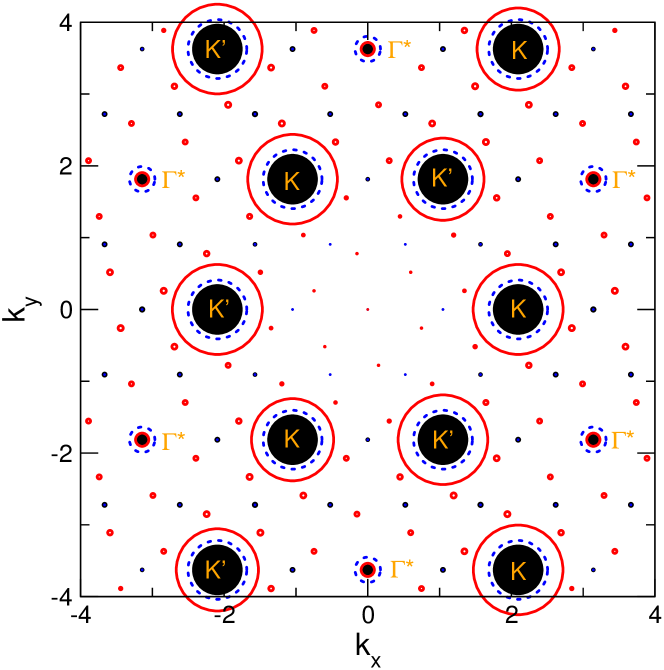
Since we plan to provide a systematic study on several clusters, we have implemented lattices sizes ranging from 12 to 42 sites, with various shapes and spatial symmetries. In particular, these clusters may or may not have some reflection or rotation symmetries (they all have inversion symmetry). Moreover, some of these lattices possess the points (see the Brillouin zone depicted in Fig. 1(b)) where the tight-binding dispersion exhibits two Dirac cones, leading to a 6-fold degeneracy of the half-filled free fermion ground-state (GS) so that correlations require some care for these clusters. We refer to Appendix A for further details on these finite-size clusters.
Our large choice of clusters provides a substantial step forward with respect to other recent ED studies, where results were obtained solely on and in Ref. García-Martínez et al., 2013 or on and in Ref. Daghofer and Hohenadler, 2014.
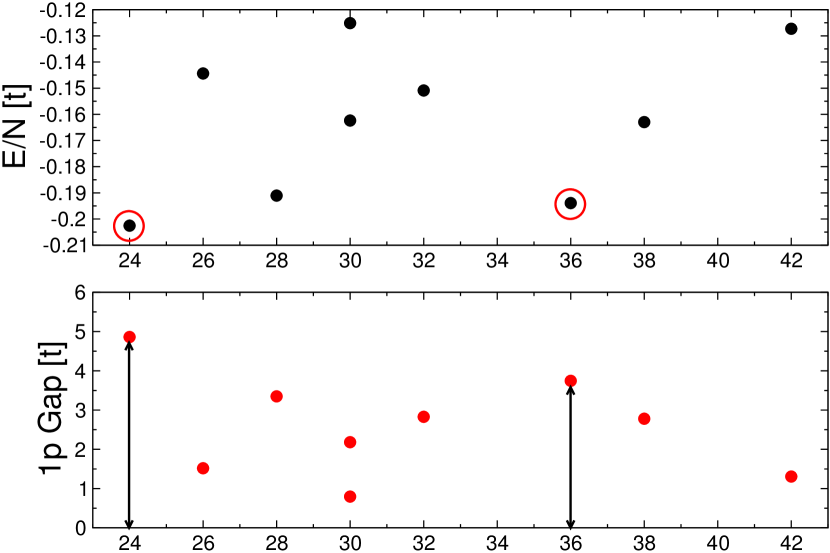
In order to illustrate the need for a systematic study of cluster geometries we present some data for the ground state energy per site. For instance, at vanishing , as shown in Fig. 2(a), clusters with the points yield the lowest energies for large , i.e. are compatible with the appearing order (to be discussed later).
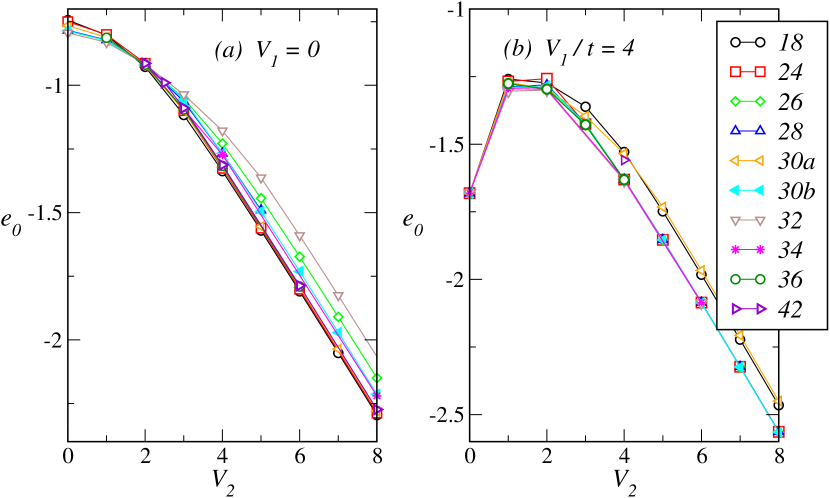
At and large , the situation becomes different as now clusters involving point(s) seem to have the lowest energies, see Fig. 2(b). This is already a clear indication of a phase transition between CDW (known to be stable at small and large ) and at least two other phases that we will characterise later.
Clearly, the choice of clusters is important depending on the parameters and the kind of instability. It was also pointed out recently Đurić et al. (2014) that the choice of boundary conditions might be crucial too. By studying the cluster with open boundary conditions (OBC), as opposed to standard periodic boundary conditions (PBC), the authors of Ref. Đurić et al., 2014 have found two level crossings for and respectively (for ). This was taken as an indication for a stable QAH phase in this region. We have checked that in this case, these level crossings correspond to two low-energy states having opposite parities with respect to inversion symmetry. However, these crossings disappear when one considers the next largest cluster with OBC, so that it probably corresponds to a short-range feature only. We generally think that using PBC is more appropriate to minimize finite-size effects, so this will be the case here.
Last, we would like to recall some features of the semi-metallic (SM) phase that exists in the absence of interactions. Since there is a vanishing density of states at the Fermi level, one needs a finite strength of a short-ranged interaction to trigger an instability Shankar (1994); Kotov et al. (2012), so that SM phase must have a finite extension in the phase diagram.
Regarding possible gap opening mechanism of the SM phase, Refs Ryu et al., 2009; Herbut et al., 2009 have listed all explicit (i.e. external) weak-coupling perturbations which can open a gap. In the spinless case considered here, the three particle-hole related gaps are: i) the Néel-like charge density wave, which breaks the A-B sublattice symmetry, ii) the Kekulé distortion pattern, which breaks translation symmetry by adopting a tripling of the unit-cell of modulated bond-strengths (this order parameter has a real and an imaginary part, thus corresponds to two masses), and iii) the integer quantum Hall mass Haldane (1988), induced by breaking the time-reversal invariance and parity symmetry upon adding complex Peierls phases on next-nearest neighbor hoppings, without enlarging the size of the unit-cell. In addition to the particle-hole gaps, there is also the possibility to open gaps by the addition of superconducting order parameters Ryu et al. (2009); Roy and Herbut (2010); Jian et al. (2015), we will however not address these instabilities in this work.
The model Hamiltonian (II.1) considered here features all the usual symmetries. If the semi-metallic phase is gapped out by interactions, then the gap opening has to happen through the interactions by spontaneously breaking some of the symmetries. The case i) quoted before is a well known instability, since the Néel CDW state is an obvious strong-coupling ground state at large . The other instabilities ii) and iii) currently lack a strong coupling picture, and need to be confirmed by numerical simulations. We note however that all three particle-hole instabilities have been reported in mean-field studies. Raghu et al. (2008); Weeks and Franz (2010); Grushin et al. (2013)
II.3 Overview of the phase diagram
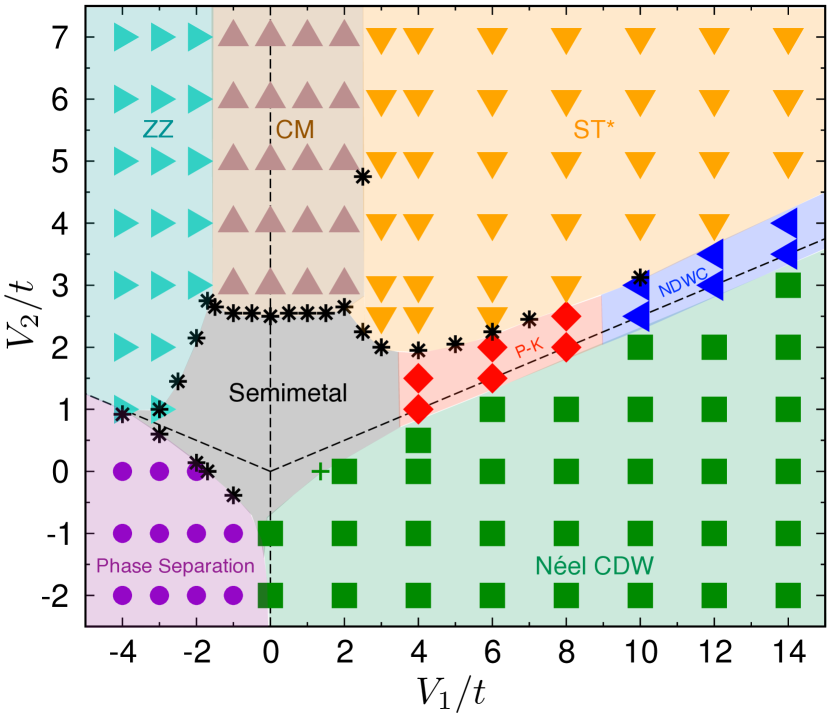
We start by drawing the global phase diagram that summarizes our main findings, see Fig. 3. Its main features are the existence of several types of charge or bond ordering for intermediate to large and/or interactions: Néel CDW, charge modulation (CM), zigzag (ZZ) phase, Néel domain wall crystal (NDWC), and plaquette/Kekulé phase (P-K) that we will clarify later. The large orange region (ST*) in the upper right part of the phase diagram features a degeneracy at the semiclassical level, and it is presently unclear whether and how an order-by-disorder mechanism will lift the degeneracy. While some of these phases (CM, P-K, CDW) had been predicted using mean-field studies Grushin et al. (2013) and confirmed numerically in some regions García-Martínez et al. (2013); Daghofer and Hohenadler (2014), the others (including NDWC and ST* phase for repulsive interactions and the ZZ phase for attractive ) had not been advocated before. Note already that the plaquette/Kekulé (P-K) phase only exists in some bounded region for intermediate (, ) values, and does not extend to strong coupling.
There is also a large region of phase separation, mostly for strong attractive interactions, in agreement with the results of Ref. Corboz et al., 2012 for . Possibly superconductivity is present in parts of the attractive region of the phase diagram, but we did not focus on this instability here.
Last but not least, we do not have any convincing evidence for the stability of the QAH phase, as found in similar recent numerical studies García-Martínez et al. (2013); Daghofer and Hohenadler (2014) but in contradiction with another numerical study using open boundary conditions and entangled-plaquette ansatz. Đurić et al. (2014)
We will now turn to the presentation of various numerical data and considerations that we have used to come up with this global phase diagram.
III Limit of large interactions (Ising limit)
The Hamiltonian (II.1) reduces to a free fermion problem in the absence of interactions, yielding a semi-metallic state with two Dirac points at half filling. In the opposite limit , the model reduces to a (generally frustrated) classical Ising model with competing antiferromagnetic (for ) or ferromagnetic (for ) nearest and next-nearest neighbor interactions. Since the phase diagram at finite but small hopping is expected to be influenced by this (frustrated) Ising limit, we find it worthwhile to explore the classical phase diagram first.
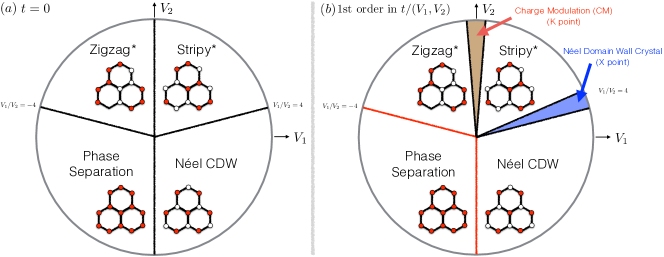
Our results are summarized in the phase diagrams sketched in Fig. 4 where we have considered the pure classical case (left panel), as well as the perturbative effect of a small (right panel). We will discuss these two cases and their phases in the following. We will exchangeably use the notation or the notation: , , with .
III.1 Classical limit:
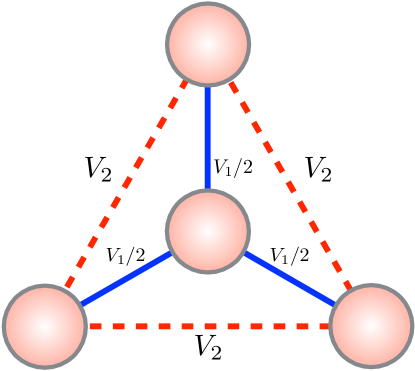
First we point out that this classical Hamiltonian can be written in a "frustration free" form, when the Hamiltonian is decomposed into parts acting on triangles spanned by three bonds and their central site (this object can alternatively be considered as a tripod, i.e. a site plus its three nearest neighbors), whose three couplings are counted only with half their strength (this is necessary because each such bond belongs to two different triangles, while the bonds belong to a unique triangle), see Fig. 5. In this decomposition each such tripod acts on 4 sites, and depending on the Hamiltonian on a tripod has a different number of local ground states. We have numerically verified that all ground states of the full problem are simultaneous ground states of each tripod term, thus the characterization "frustration free".
By finite cluster ground state enumeration techniques (with and without exploiting the frustration free property) we have established the classical phase diagram displayed in the left panel of Fig. 4. For (), the system decouples into two interpenetrating triangular lattices with antiferromagnetic interactions. The ground state manifold is thus spanned by the product of the ground spaces of each triangular sublattice, and is macroscopically degenerate (i.e. featuring an extensive ground state entropy). For the ground state manifold is much reduced, but still grows with system size, cf. Tab. 2 in Appendix B. On clusters featuring one or several point(s) in the Brillouin zone, some of these states can be understood as pristine stripy ordered states (sketched in the appropriate region in Fig. 4), combined with line defects, as illustrated in Fig. 7. It is however not clear to us whether all states in the ground space manifold on all lattices can be generated along these ideas. At we find again a single point with a rapidly growing ground state degeneracy. For we find the two Néel ground states, which are obvious ground states at , corresponding to nearest neighbor interactions only. For we find a region of phase separation, where the system wants to be either empty or completely filled with fermions. At we have another point with an extensive ground state degeneracy, albeit with a smaller number than on the reflected side . Finally the region hosts a degenerate set of states, which seem to be related to zigzag charge configurations (sketched in the appropriate region in Fig. 4), with some defect structures in addition.
III.2 Perturbed classical limit:
After having established the classical phase diagram, we include the effect of a finite hopping amplitude on the classical ground states. We limit ourselves here to perturbative arguments (mostly first order in ), and check these predictions by full scale ED in the following sections.
We proceed by discussing the fate of the regions in the classical phase diagram, and then analyze the behavior on the degenerate points.
III.2.1 Néel CDW state
We start with the least degenerate region, , where there are only two Néel ground states. These two states are symmetry related (and thus cannot be split by diagonal terms) and it is not possible to connect the two states by a finite order in perturbation theory in the thermodynamic limit. So based on perturbation theory this phase is expected to have a finite region of stability when .
III.2.2 Phase separation region
The phase separation region is also stable at finite because both the empty and the full system are inert under the action of the hopping term.
III.2.3 Zigzag state (ZZ)
Next we consider the extended region , featuring zigzag ground states and some types of domain walls. To first order in it is not possible to hop and stay in the ground state manifold. Exact diagonalizations of the full microscopic models on various clusters (see Sec. IV) with true classical ground states reveal however an order-by-disorder mechanism, where a diagonal term in high-order perturbation theory seems to lift the degeneracy and select the pristine zigzag state, see Fig. 6. This state is six-fold degenerate. A similar state translated to spin language appears in the Heisenberg-Kitaev model on the honeycomb lattice. Chaloupka et al. (2013)
III.2.4 Stripy* region
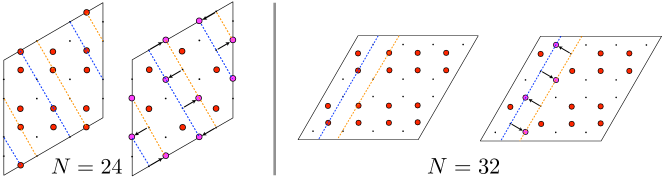
Finally we consider the extended region , featuring stripy ground states and some degree of domain walls. To first order in it is not possible to hop and stay in the ground state manifold. However on a finite cluster there is a finite order at which the moves sketched in Fig. 7 become possible. As the order at which this process first occurs diverges with the linear extent of the cluster, such tunneling events seem irrelevant at small in the thermodynamic limit. As we currently do not fully understand the structure of the ground space manifold, we can not rule out the appearance of other perturbative processes connecting ground states without wrapping around the torus.
In order to shed some light on this issue, we diagonalize the full Hamiltonian at , for a number of samples. The resulting spectra are shown in Fig. 8. In contrast to the zigzag case studied before, here we do not observe a clearly structured order-by-disorder selection of a new ground state. The results for these system sizes can be rationalized as the spectrum of an abstract tight binding model, where the sites are the different ground states in the classical ground space, while the hopping matrix elements are of the cluster wrapping type just discussed. As the perturbative orders of these processes strongly depend on the shape of the cluster, the strong correlation of the bandwidth of the split ground space with the formal order in perturbation theory seems to validate our picture. It is thus presently not clear whether the ground state degeneracy will be lifted at a finite order in perturbation theory in the thermodynamic limit or not. The qualitative presence of a high-order diagonal term in the zigzag case discussed before could also carry over to the present stripy* case, but is masked on moderate finite size samples by the leading cluster-wrapping splitting terms.
Now we turn to the points in the classical phase diagram which feature a massive ground state degeneracy. These are the points (), and .
III.2.5 Charge modulated (CM) state
At we have two independent triangular sublattices with antiferromagnetic interactions. It is known that each state which has two or one charges on each -triangle is a valid ground state. Wannier (1950) When working at half filling the ground space of the full problem can be obtained by enumerating all ground states on one triangular sublattice and then summing up the product of the two sublattice Hilbert spaces over all particle bipartitions such that the total number of particles amounts to half filling (i.e. ).
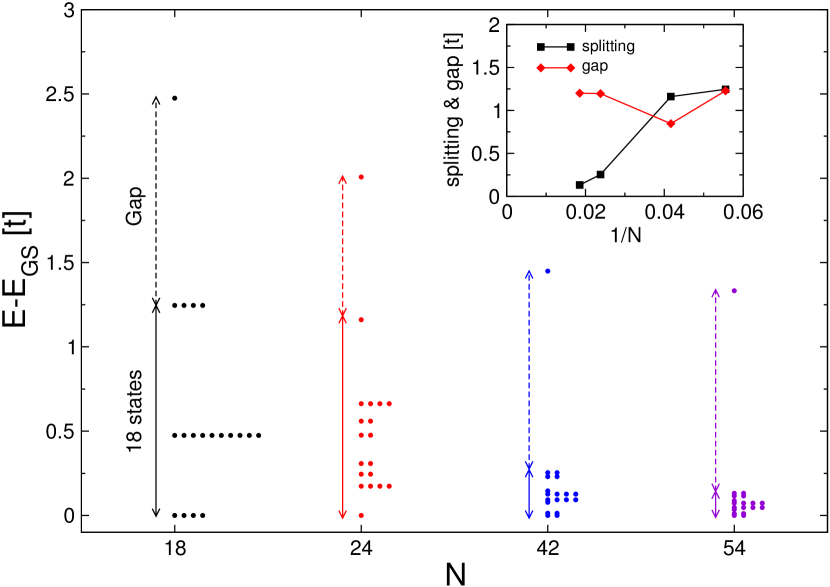
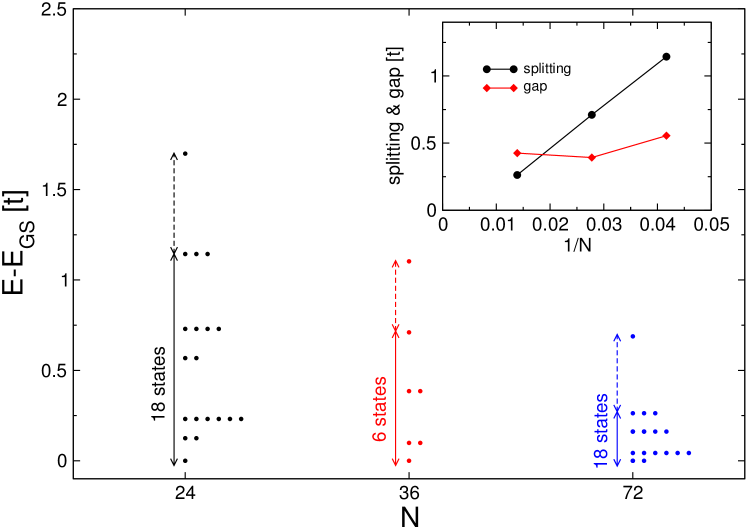
The effect of a finite is to hop particles from one triangular sublattice to the other one. There are indeed many states in the ground state manifold where such first order hoppings are possible while staying in the ground state manifold. The problem thus maps to a hopping problem on an abstract lattice living in the constrained Hilbert space, where the sites are the allowed configurations. This abstract lattice is not homogeneous and features sites with different coordination numbers. It is not known to us how to solve this hopping problem analytically. As a starting point it is instructive to identify the maximally flippable states (i.e. abstract sites with the largest coordination number) of this problem. By explicit enumeration we have identified the 18 - configurations as the maximally flippable states (the number is independent of , given that the sample geometry is compatible with - states). These states feature a threefold degenerate charge analog of the magnetic states on one sublattice, while the other sublattice has three possible charge analogs of the magnetic state. Another factor of two is obtained by swapping the role of the two sublattices.
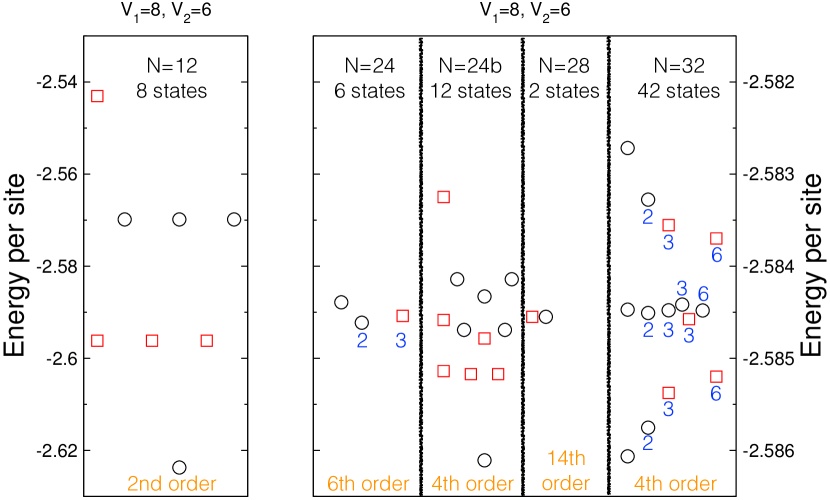
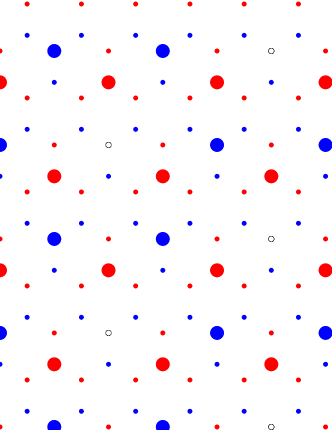
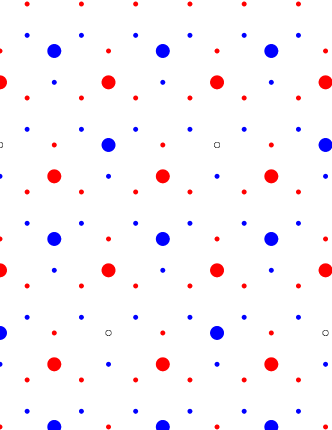
The question is now whether the ground state of the full effective model is localized on those maximally flippable states, or whether the hopping network favors delocalized wave functions. We have numerically solved the effective model for samples with and sites and show the low-lying energy spectra in Fig. 9. We note the presence of 18 low-lying states (indicated by the full arrow in Fig. 9), separated by a gap (dashed arrow) from the higher lying states. While this picture is not yet very sharp for and , for and however the bandwidth of the 18 low-lying states is quite small compared to the gap to the higher states. We interpret this spectrum as the localization of the low-lying eigenstates on the 18 maximally flippable states. This is further corroborated by the fact that these eigenfunctions have their maximal amplitudes on the 18 - states. We have also obtained the static charge structure factor
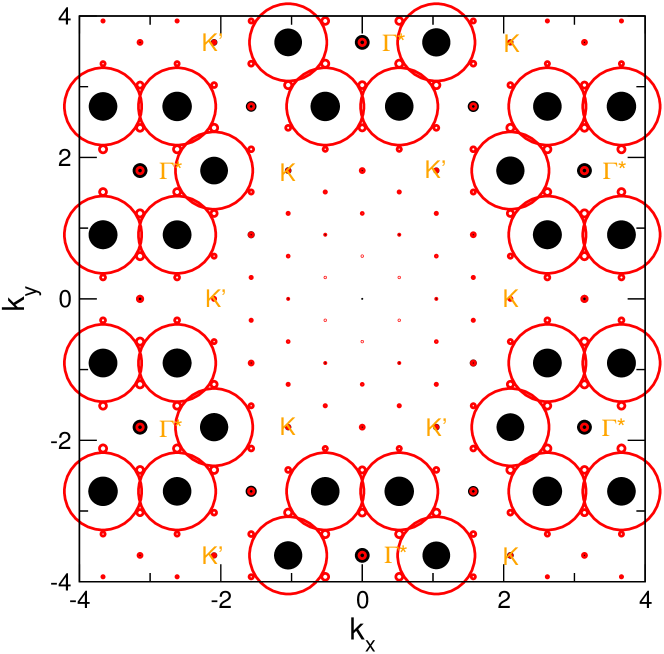
| (2) |
in the ground state of the effective model. In Fig. 10 we display this quantity for and , as well as for an equal superposition of the 18 - states on sites. Note that we plot the data in an extended Brillouin zone scheme. There are obvious Bragg peaks at the momenta stemming from the tripling of the unit cell in each triangular sublattice. Furthermore in the plain superposition of the 18 - states a sublattice imbalance is present, as the densities on the two triangular sublattices are different (1/3 versus 2/3), leading to another set of Bragg peaks at the momentum. In the actual ground state of the effective model this peak is renormalized substantially. If our advocated picture of a localization of the ground state wave functions on the 18 - states holds true, then we also expect the Bragg peaks at to survive, although with a sizable reduction of the amplitude. In a recent paper Daghofer and Hohenadler Daghofer and Hohenadler (2014) also investigated this issue and concluded an absence of the sublattice imbalance based on exact diagonalizations of the original Hamiltonian (II.1) on and . Our results plotted in the extended zone scheme however reveal at least the presence of a local maximum in at , consistent with our claim of a weak sublattice imbalance in the thermodynamic limit. Note that this state would be insulating, i.e. unrelated to the presumed metallic pinball liquid phase on the triangular lattice. Hotta and Furukawa (2006)
We close the discussion of the case by noting that this point enlarges to a finite region with respect to the addition of when . The reason is that the ground state of the hopping problem in the degenerate ground state manifold is able to gain energy proportional to in the order-by-disorder framework. When switching on , one needs a finite amount of to destabilize the CM phase, because the stripy* region and the zigzag phase do not gain energy from the hopping term at first order in .
III.2.6 Néel domain wall crystal (NDWC)
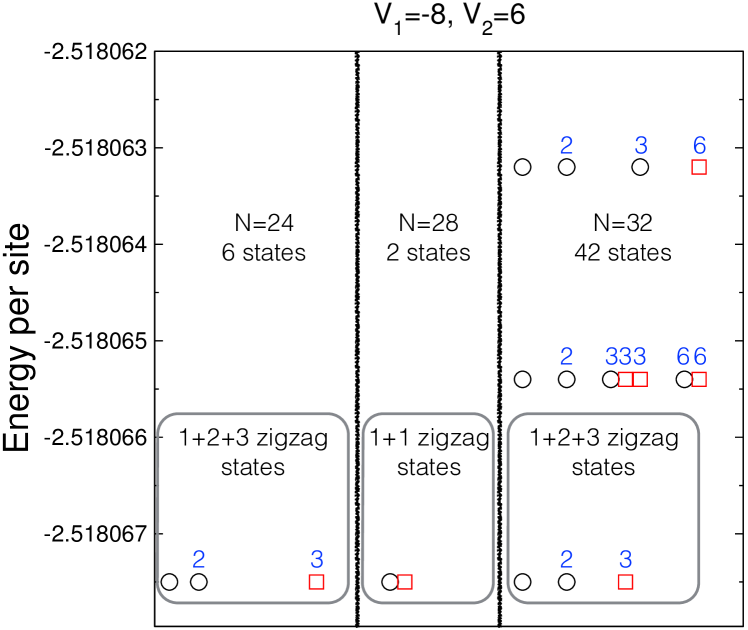
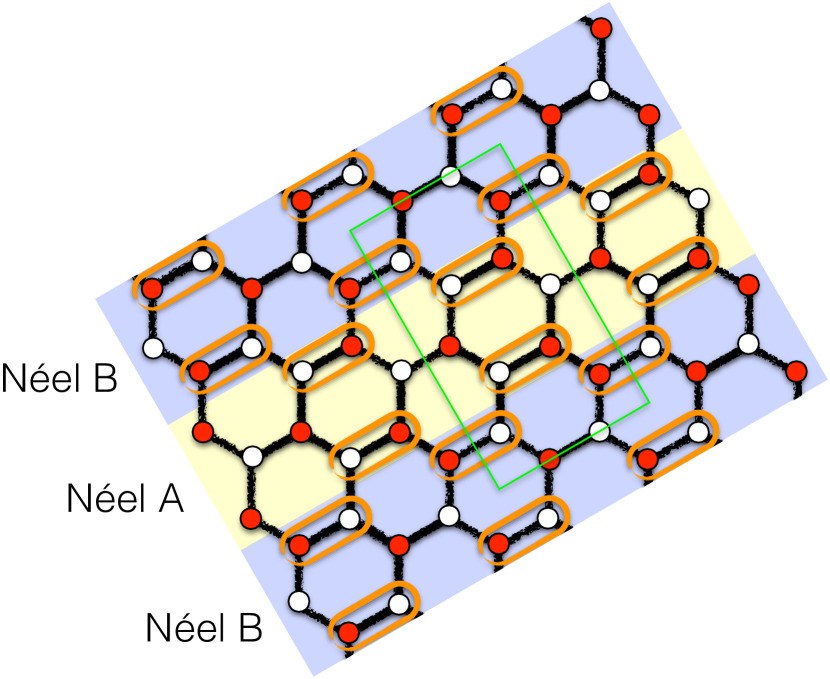
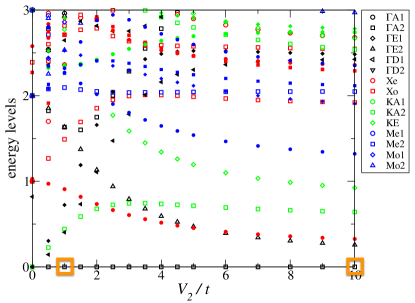
Now let us discuss the behavior at . As noted before, this point features a sizable ground state degeneracy at the classical level. Since - to the best of our knowledge - this manifold has not been studied so far, we proceed by numerically diagonalizing the first order effective Hamiltonian obtained by projecting the fermionic hopping Hamiltonian into the classical ground state manifold. In Fig. 11 we present the energy per site for various clusters. It appears that among the studied clusters the samples with and sites have a particularly low energy per site ( is close, but its energy per site is higher than , so we discard it). It seems that this low energy correlates with a high maximal flippability of configurations on these clusters 111: 18 states with 8 off-diagonal matrix elements each; : 14 states with 10 off-diagonal matrix elements each; : 6 states with 12 off-diagonal matrix elements each; : 18 states with 24 off-diagonal matrix elements each., compared to the other clusters. In Fig. 12 we display one such maximally flippable state for . Our understanding of this state is that it is formed of alternating strips of the two Néel CDW states. Along the domain walls between the two CDW states there are many bonds which are flippable to first order in . This state is 18 fold degenerate. There are 3 directions in which the domain walls can run, and for fixed orientation, there are 3 distinct bond choices for the domain walls. The remaining factor of two is due to the assignment of the two Néel CDW states. We have further checked a sample with and again found 18 maximally flippable states, in agreement with our analysis. In Fig. 13 we display the low lying eigenstates of the effective first-order Hamiltonian in the degenerate subspace for system sizes and sites. The collapse of the lowest 18 states is clearly visible, providing strong evidence for symmetry breaking of the NDWC type. The results of the effective model simulations for the charge structure factor are shown in Fig. 14 and further corroborate this picture.
We also expect the point to enlarge to an actual phase at small but finite , because the two neighboring phases in the Ising limit (the stripy* region and the Néel CDW) both do not gain energy to first order in .
III.2.7 ,
The ground state configurations at , do not seem to be flippable to first order in , and we have therefore refrained from a detailed study of this line.
To conclude this section we show the resulting semiclassical qualitative phase diagram in the right part of Fig. 4.
IV Numerical results
In this section, we will present our systematic numerical study using ED and typical observables that were used to compute our global phase diagram in Fig. 3. We will first present some useful tools to detect phase transitions as well as to characterize phases. Then we will provide numerical evidence for the finite extension of the phases that were discussed in the limit of large interactions in Sec. III. Last but not least, we will discuss the stability of phases (with a stronger quantum character) at intermediate coupling, namely the semi-metal (SM), the plaquette/Kekulé phase and the absence of the conjectured topological Mott insulator phase.
IV.1 Numerical tools
IV.1.1 Energetics
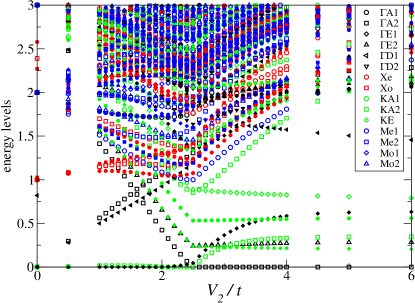
Let us start by showing some full low-energy spectra, where we label each eigenstate according to its quantum numbers. 222We use the full lattice symmetry, as well as particle-hole symmetry. For space symmetries, we label sectors using momentum and irreducible representation corresponding to the point-group compatible with this momentum. For instance, on cluster which possesses all symmetries, we have used group at the point, group at the point, group at the point and group at the point. In Fig. 15-16, we present these spectra for a fixed and respectively on the cluster which has the full point-group symmetry and also possesses the relevant and points in its Brillouin zone (see Appendix A).
When and is small, we expect a finite region of SM phase with low-energy excitations at the Dirac point (). Increasing , there is a sudden level crossing when . Beyond this value, if we count the lowest energy levels well separated from the others, we get 18 states, which may indicate some ordering of some kind in the thermodynamic limit (see discussion in Sec. III.2).
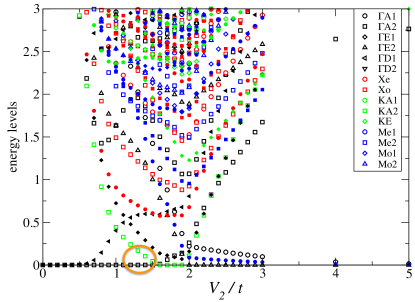
When , starting at small , there are two almost-degenerate states at the point with opposite particle-hole symmetries, compatible with the Néel CDW state. Increasing leads to some intermediate phase with low-energy states at momentum compatible with a Kekulé-like (or plaquette) pattern, and finally for large the emergence of 6 low-energy states with momenta and .
IV.2 Stability of the classical Ising-like phases
Let us now move to a more precise characterization of the possible patterns occurring for large interactions. Quite generically, large density interactions are expected to lead to some kind of charge ordering. In the equivalent spin language, these terms are of the Ising type and the resulting Ising model would correspondingly exhibit some spin ordering. For model (II.1), they were discussed in Sec. III and are denoted under the names: CDW, NDWC, stripy* region, CM or zigzag.
IV.2.1 CDW phase
When , since the honeycomb lattice is bipartite, a simple charge-density wave (CDW) where particles are localized on one sublattice is expected for , so that degeneracy is two. Since this phase does not break translation symmetry but only inversion, symmetry analysis predicts that on a finite cluster there should be a collapse of the lowest and states. 333Note that the choice of the real space Fermi normal ordering can have an impact on the absolute symmetry sectors of the finite size clusters, relative quantum numbers should however be invariant This is indeed what is observed in Fig. 16 at small for instance. When , our numerical data are compatible with a vanishing gap at zero momentum (data not shown) because of the inversion symmetry breaking in the CDW phase. Note however that the system remains an insulator.
A clearer picture of this CDW state is provided by density-density correlations. On Fig. 17, we plot these connected correlations obtained with a cluster showing a clear transition from a semi-metallic phase to the Néel CDW for large (at ). About the critical value, let us mention that a recent unbiased QMC approach Wang et al. (2014) has concluded that .
Based on our previous semiclassical analysis, we expect that the CDW phase cannot extend beyond the line , at least towards strong coupling.
IV.2.2 Charge modulated phase
As we have discussed in Sec. III, the large limit is less trivial since the classical Ising model possesses an extensive ground-state degeneracy. However, one expects on general grounds that quantum fluctuations will provide some selection mechanism within these low-energy states. Our discussion in Sec. III.2.5 has led us to conclude in favor of some charge-modulation (CM) state which is 18-fold degenerate and exhibits charge imbalance between the two sublattices, in agreement with Refs. Grushin et al., 2013; García-Martínez et al., 2013 and slightly different from the similar CM state without charge imbalance Daghofer and Hohenadler (2014).
Our ground-state energy plot in Fig. 2(a) has indeed shown that the emergent phase is compatible with clusters having the point, as is the case for the proposed tripled unit cell. Moreover, the low-energy spectra on these clusters, such as in Fig. 15 (or similarly , data not shown), do confirm the presence of 18 low-energy states at large in agreement with the expected degeneracy. The question whether all those states will collapse or if there will remain a finite gap (and thus a smaller degeneracy) is left for future studies, but our effective model diagonalizations in the strong coupling limit indicate a complete collapse of the 18 levels, c.f. Fig. 9.
IV.2.3 Stripy* region
For large , the lowest energies are found on clusters having the point (see Fig. 2(b)), which indicates a different instability. Moreover, our symmetry resolved spectra (see Fig. 16 for instance) predict a 6-fold degeneracy for large (with 3 states at momentum and 3 at equivalent momenta M) in disagreement with both the CM phase or the Kekulé one (see later). As discussed in Sec. III.2.4 based also on ED, the fate of the stripy* region at finite is not clear. Results for close to the phase transitions to the neighboring phases still do not shed light on a possible selection process among the classically degenerate ground states.
IV.2.4 Néel domain wall crystal
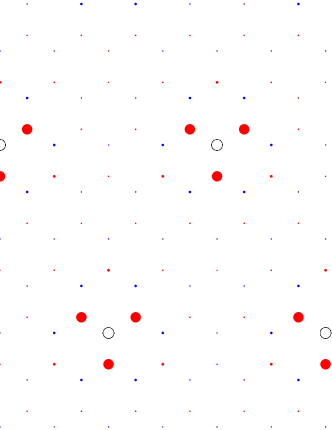
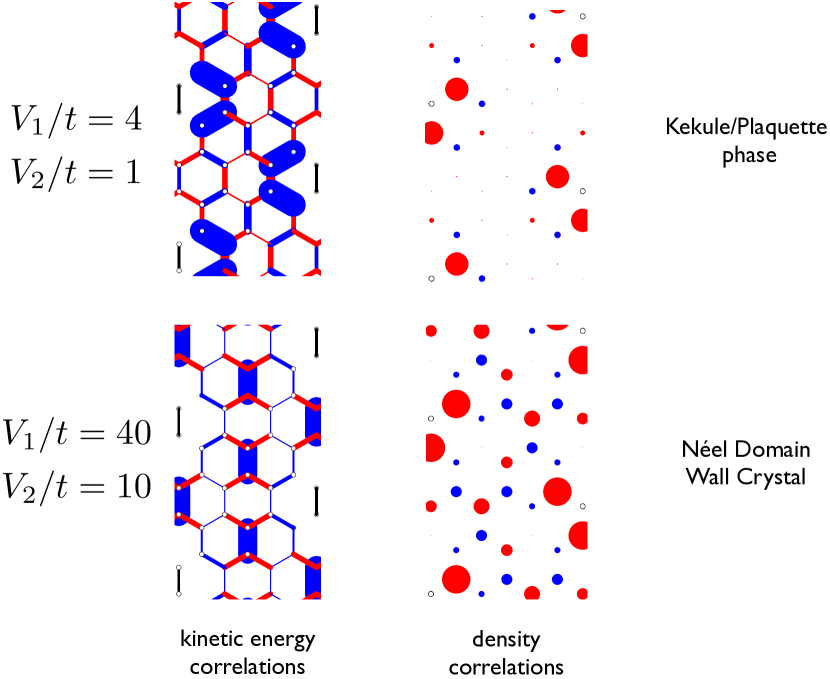
Since the ratio is a special point in the classical phase diagram we investigate here the phase diagram along the line , with the ratio fixed. In Fig. 18 we display the low energy spectrum for the site sample along this line. At very small we expect the stable semimetallic phase emerging out of . We then detect an intermediate Kekulé or plaquette phase for values . These values are confirmed by directly computing kinetic correlations and checking if they match the expected pattern for a plaquette phase. However for larger values the system enters the realm of the NDWC phase, involving the physics discussed in subsection III.2.6. The occurrence of two very distinct phases beyond the semimetallic phase is also visible in the ground state correlations shown in Fig. 19.
IV.2.5 Zizag phase
As already discussed in Sec. III.2, ED with large negative and positive provide spectral evidence for a quantum order-by-disorder selection of a pristine zigzag state, as shown for instance in Fig. 6. For the clusters having the 3 points in their Brillouin zone (see Appendix A), we do observe 6-fold quasi degenerate ground-states. By computing connected density correlations on any of these states, we obtain a pattern compatible with zigzag state. Indeed, a simple direct computation of connected density correlations on the zigzag state leads to values or depending on distances between sites, which agrees to a very high accuracy with the exact results computed on or ground-states in this region, see Fig. 20.
Having clarified the phases at large interaction strengths, which are connected to the classical limit, we now consider the intermediate interaction regime where new quantum phases are expected to emerge.
IV.3 Emergence of a resonating quantum plaquette phase or Kekulé one
In Refs. Grushin et al., 2013; García-Martínez et al., 2013, it has been argued using mean-field or ED respectively that a Kekulé pattern can be stabilized when and are close. This would correspond to a 3-fold degeneracy Albuquerque et al. (2011) 444We disagree with the advocated general 4-fold degeneracy mentioned in Ref. García-Martínez et al., 2013. The four-fold degeneracy is actually an artifact of the sample Corboz et al. (2013) of the ground-state (more precisely one state at and two states at ).
However, while the Kekulé phase was seen to remain stable up to large in Refs. Grushin et al., 2013; García-Martínez et al., 2013, our numerical data on large clusters do not confirm these findings (see Sec. IV.2) since it is replaced either by the stripy* region or the NDWC phase. However, we do confirm its existence, but for intermediate values only.
A first evidence is given by the low-energy spectrum of at fixed (see Fig. 16) where in some intermediate range, the lowest energies are compatible with this plaquette/Kekulé phase. A second one is provided via a direct computation of the (connected) kinetic energy correlations on a larger cluster in Fig. 21, which are in perfect agreement with the expected pattern. Albuquerque et al. (2011)
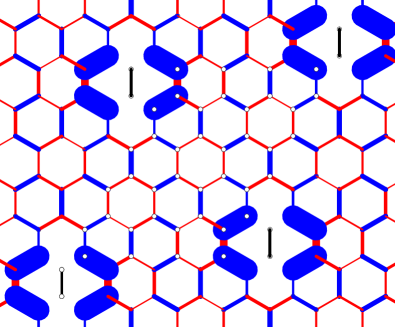
There is a small caveat here, since it is rather difficult to distinguish a static Kekulé pattern from a plaquette crystal, where the three strong bonds on a hexagon resonate. Indeed both phases break the same symmetries and have the same degeneracy so that a clear identification is often difficult. Read and Sachdev (1990); Moessner et al. (2001); Albuquerque et al. (2011) Let us mention that for Heisenberg model on the honeycomb lattice with competing , (and ) interactions, there exists an intermediate region with a clear plaquette character. Albuquerque et al. (2011); Zhu et al. (2013); Ganesh et al. (2013); Gong et al. (2013) Moreover, in this case, the plaquette phase seems connected to the ordered phase through a possibly continuous phase transition. Albuquerque et al. (2011); Ganesh et al. (2013) In our spinless fermionic model, we have not fully clarified the nature of this intermediate phase, but this would be an interesting project as well as the nature of the transition both to the semi-metallic and the Néel phases, which is unfortunately beyond what can be done using ED technique, but which might be fermionic examples of phase transitions beyond the Landau paradigm.
IV.4 Stability of the topological phase
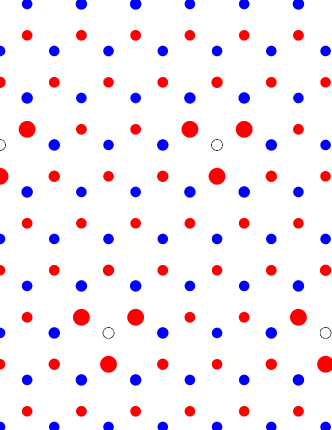
The proposal made by Raghu et al.Raghu et al. (2008) is that, when dominates, the system undergoes a transition to a topologically distinct phase that spontaneously break time-reversal symmetry. A simple picture of this phase can be obtained by drawing circulating currents on a given sublattice. In order to check this picture, we have computed current-current correlations on a given sublattice. Note that these correlations are strictly zero for all distances when . They are plotted for different in Fig. 22 in the case of lattice and at fixed where the instability is expected to be the strongest.555Our numerical current structure factor (see its definition below) are indeed the strongest when on clusters and for instance. We have used the expected orientation pattern of the QAH phase, i.e. where all currents would be in the clockwise direction on each hexagon for instance. We see on Fig. 22 that when we increase , the signal starts by increasing in amplitude, and then some defects (in red) start to appear on the cluster, in particular in the case where QAH is supposed to be the strongest around . Let us emphasize again that QAH is perfectly compatible with all clusters (since it is a instability) and as a result no frustration is expected. Therefore, the appearance of defects reveal some competing phases. Still the overall pattern is almost perfect, which is remarkable and does not occur in the only case for instance. For even larger , the signal suddenly disappears (see Figs. 23 and 24 for several clusters, other data not shown), signalling the entrance in the CM phase (see above). Given that the semimetallic phase should have a finite extension for small , this constrains the putative QAH phase in a small region around .
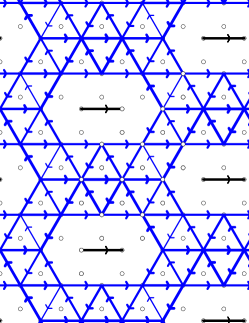
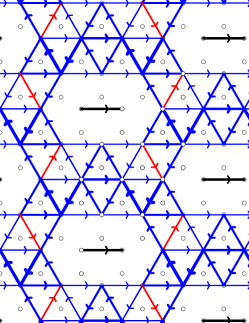
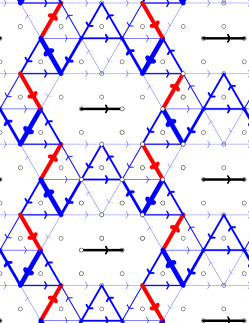
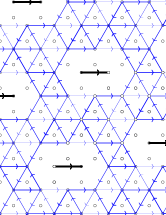
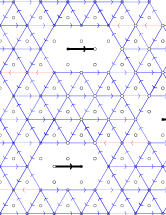
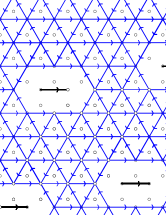
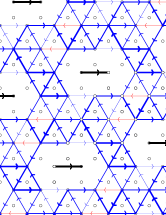
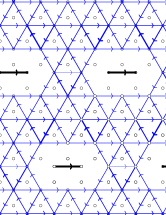
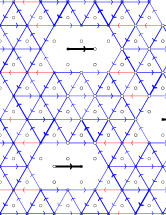
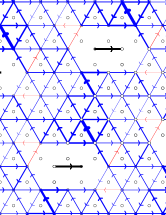
In order to estimate the finite-size effects, we have performed extensive simulations on a large number of samples (data not shown). We can clearly identify some clusters on which the patterns are far from being perfect (i.e. have many defects), which can be related either to lower symmetry, or to poorly two-dimensional aspect ratio. Indeed, when looking at clusters having symmetry at least, we do observe nice current correlations with no or few defects at small . Therefore, there are definitely correlations compatible with QAH phase, but one needs to investigate whether these are short-range features only or not.
In order to do so, we have to measure some order parameter. We have chosen the current structure factor, i.e. the sum of current correlations with the signs taken from the QAH pattern:
| (3) |
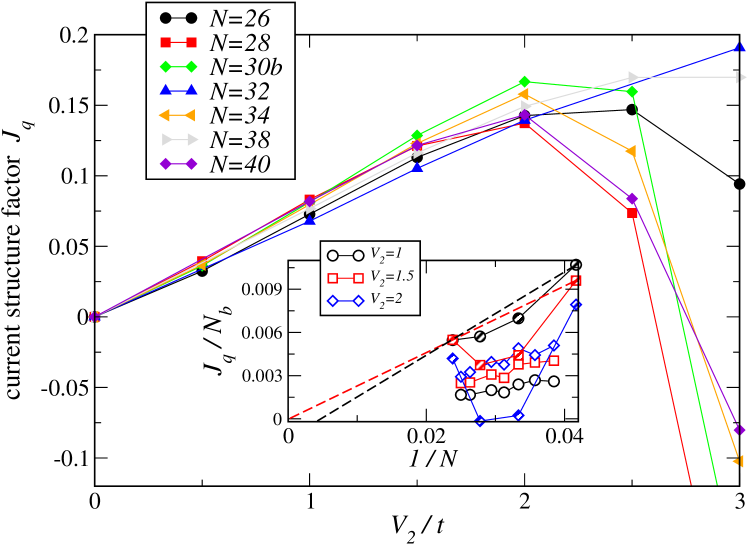
where the sum runs over all bonds on a given sublattice 666We sum over all bonds which do not share any common site with the reference bond, i.e there are terms. and the correspond to the expected QAH orientation (all currents clockwise or anticlockwise depending on the choice of reference bond ). When using clusters with less symmetry, we average over the inequivalent directions of the reference bond. This is indeed a valid order parameter and long-range order requires that it diverges in the thermodynamic limit as . Overall, we see in Fig. 25 a clear increase of current correlations for moderate , indicating that such an interaction indeed favours current formations, in agreement with mean-field prediction. There are of course non-trivial finite-size effects due to the fact that not all clusters have the same symmetry (see Appendix A).
In the inset of Fig. 25, we plot this structure factor divided by the number of terms for where the QAH seems to be the strongest from our data, and also from the mean-field estimate of the QAH region Raghu et al. (2008): . For clusters without the point, the behaviour of this current structure factor has some non-monotonic size dependence due to the fact that clusters have different shapes, but its absolute value is quite small, and finite-size extrapolations are compatible with a vanishing value. We also plot separately the data points for clusters having the point (which have a larger signal due to the degenerate ground state at half filling at ) but if we focus on and which are the best two-dimensional clusters of this kind (good aspect ratio and symmetry at least), data are also compatible with the absence of long-range order in the thermodynamic limit. Our results are in agreement with other recent numerical studies García-Martínez et al. (2013); Daghofer and Hohenadler (2014) but in contrast with another work. Đurić et al. (2014) We hope that future progress in simulations of two-dimensional strongly correlated systems will allow to confirm the absence of a QAH phase for this microscopic model, but will be able to stabilise it in a larger parameter space. Indeed, it is obvious that the semi-metallic state has a strong response in the QAH channel, so that if other instabilities could be prevented (using additional interactions to frustrate them), there remains an interesting possibility to stabilise QAH phase in a truly long-range ordered fashion.
V Conclusion
We have investigated a model of spinless fermions on honeycomb lattice with (generally competing) density-density interactions using extensive numerical exact diagonalizations on various clusters. Based on a careful analysis, our main result is summarized in the global phase diagram in Fig. 3. On the one hand, we have clarified the phase diagram in the strong coupling regime () using some non-trivial results on the classical model and some quantum order-by-disorder arguments. On the other hand, we have used numerical simulations of the full quantum model on finite clusters. As a result, for intermediate or large interactions, we have provided evidence for several crystalline phases: Néel CDW, CM, plaquette/Kekulé, Néel domain wall crystal, the stripy* region and the zigzag phase, some of which had not been considered yet.
When considering the role of interaction alone, it had been suggested in the literature Raghu et al. (2008) that it could stabilize a topological phase, which has triggered an intense activity. We have measured the corresponding (charge) current correlations, and while there is definitely some increase due to the interaction, our finite-size analysis indicate that the topological phase is not present in the thermodynamic limit, and there is a direct transition between the semi-metallic phase and a charge-modulated one. However, it is very interesting to notice that interaction is able to create short-range current correlations, so that some additional ingredients could possibly stabilize it. Future work along these lines should also consider the spinful case where a topological spontaneous quantum spin hall phase with spin currents has been proposed. Raghu et al. (2008)
As a last remark, let us remind that other models are known to exhibit Dirac cones and thus could potentially also host such a topological phase: for instance, on the square lattice -flux model at half-filling, a topological insulating phase is predicted using mean-field technique Weeks and Franz (2010) but numerical study have not confirmed its stability. Jia et al. (2013) It is also noteworthy that a generalized tight-binding model on the kagomé lattice always contain Dirac cones at some particular filling Asano and Hotta (2011), which leaves room to investigate the exciting possibility to stabilize a topological phase with interactions.
Note added: While finalizing this manuscript we became aware of concurrent iDMRG work Motruk et al. (2015) with consistent results regarding the presence and absence of the various phases in the repulsive regime.
Acknowledgements.
We thank M. Daghofer, A. Grushin, M. Hohenadler, J. Motruk and F. Pollmann for discussions. We thank F. Pollmann and collaborators for sharing their consistent iDMRG results prior to publication. This work was performed using HPC resources from CALMIP and GENCI-IDRIS (Grant 2014-050225) as well as LEO2/3 and VSC2/3. SC thanks Institut Universitaire de France (IUF) for financial support. AML was supported by the FWF (I-1310-N27/DFG FOR1807).Appendix A Lattice geometries
Since we are using several kinds of lattices, we give their definitions in Table 1 using and translations to define the torus with periodic boundary conditions.
| Name | a | b | sym. group | (2) | (3) | (6) |
|---|---|---|---|---|---|---|
| 12 | no | yes(1) | no | |||
| 18 | yes | no | no | |||
| 24 | yes | yes | yes | |||
| 24b | no | yes(1) | no | |||
| 26 | no | no | no | |||
| 28 | no | yes (1) | no | |||
| 30a | yes | no | no | |||
| 30b | no | no | no | |||
| 32 | no | yes | no | |||
| 34 | no | no | no | |||
| 36 | yes | yes (1) | yes (2) | |||
| 38 | no | no | no | |||
| 42 | yes | no | no | |||
| 54 | yes | no | no | |||
| 72 | yes | yes | yes |
Appendix B Counting of Ising Groundstates
In this section we provide a table with the dimensions of the classical ground spaces at half filling for the clusters described in Appendix A.
| - | 8 | - | - | ||
| - | - | 666 | 38 | ||
| 96 | 6 | 5’526 | 6 | 446 | |
| b | - | 12 | - | 12 | - |
| - | - | 3’042 | 340 | ||
| - | - | 8’964 | 2 | 858 | |
| a | - | - | 30’618 | 692 | |
| b | - | - | 11’300 | 888 | |
| 630 | 42 | 1’764 | 42 | 1’520 | |
| - | - | 230’014 | 14 | 3’454 | |
| - | - | - | - | 5’208 | |
| - | - | 1’211’004 | - | 8’880 | |
| - | - | 59’711’598 | - | - | |
| - | 186 | - | 186 | 8’705’390 |
References
- Prange and Girvin (1990) R. E. Prange and S. M. Girvin, The Quantum Hall Effect, 2nd ed. (New York: Springer-Verlag, 1990).
- Hasan and Kane (2010) M. Z. Hasan and C. L. Kane, Rev. Mod. Phys. 82, 3045 (2010).
- Qi and Zhang (2011) X.-L. Qi and S.-C. Zhang, Rev. Mod. Phys. 83, 1057 (2011).
- Raghu et al. (2008) S. Raghu, X.-L. Qi, C. Honerkamp, and S.-C. Zhang, Phys. Rev. Lett. 100, 156401 (2008).
- Weeks and Franz (2010) C. Weeks and M. Franz, Phys. Rev. B 81, 085105 (2010).
- Grushin et al. (2013) A. G. Grushin, E. V. Castro, A. Cortijo, F. de Juan, M. A. H. Vozmediano, and B. Valenzuela, Phys. Rev. B 87, 085136 (2013).
- Pereg-Barnea and Refael (2012) T. Pereg-Barnea and G. Refael, Phys. Rev. B 85, 075127 (2012).
- Dauphin et al. (2012) A. Dauphin, M. Müller, and M. A. Martin-Delgado, Phys. Rev. A 86, 053618 (2012).
- (9) T. Liu, B. Douçot, and K. Le Hur, ArXiv:1409.6237.
- García-Martínez et al. (2013) N. A. García-Martínez, A. G. Grushin, T. Neupert, B. Valenzuela, and E. V. Castro, Phys. Rev. B 88, 245123 (2013).
- Daghofer and Hohenadler (2014) M. Daghofer and M. Hohenadler, Phys. Rev. B 89, 035103 (2014).
- Đurić et al. (2014) T. Đurić, N. Chancellor, and I. F. Herbut, Phys. Rev. B 89, 165123 (2014).
- Huffman and Chandrasekharan (2014) E. F. Huffman and S. Chandrasekharan, Phys. Rev. B 89, 111101(R) (2014).
- Wang et al. (2014) L. Wang, P. Corboz, and M. Troyer, New Journal of Physics 16, 103008 (2014).
- Li et al. (2015) Z.-X. Li, Y.-F. Jiang, and H. Yao, Phys. Rev. B 91, 241117(R) (2015).
- Shankar (1994) R. Shankar, Rev. Mod. Phys. 66, 129 (1994).
- Kotov et al. (2012) V. N. Kotov, B. Uchoa, V. M. Pereira, F. Guinea, and A. H. Castro Neto, Rev. Mod. Phys. 84, 1067 (2012).
- Ryu et al. (2009) S. Ryu, C. Mudry, C.-Y. Hou, and C. Chamon, Phys. Rev. B 80, 205319 (2009).
- Herbut et al. (2009) I. F. Herbut, V. Juričić, and B. Roy, Phys. Rev. B 79, 085116 (2009).
- Haldane (1988) F. D. M. Haldane, Phys. Rev. Lett. 61, 2015 (1988).
- Roy and Herbut (2010) B. Roy and I. F. Herbut, Phys. Rev. B 82, 035429 (2010).
- Jian et al. (2015) S.-K. Jian, Y.-F. Jiang, and H. Yao, Phys. Rev. Lett. 114, 237001 (2015).
- Corboz et al. (2012) P. Corboz, S. Capponi, A. M. Läuchli, B. Bauer, and R. Orús, EPL 98, 27005 (2012).
- Chaloupka et al. (2013) J. Chaloupka, G. Jackeli, and G. Khaliullin, Phys. Rev. Lett. 110, 097204 (2013).
- Wannier (1950) G. H. Wannier, Phys. Rev. 79, 357 (1950).
- Hotta and Furukawa (2006) C. Hotta and N. Furukawa, Phys. Rev. B 74, 193107 (2006).
- Note (1) : 18 states with 8 off-diagonal matrix elements each; : 14 states with 10 off-diagonal matrix elements each; : 6 states with 12 off-diagonal matrix elements each; : 18 states with 24 off-diagonal matrix elements each.
- Note (2) We use the full lattice symmetry, as well as particle-hole symmetry. For space symmetries, we label sectors using momentum and irreducible representation corresponding to the point-group compatible with this momentum. For instance, on cluster which possesses all symmetries, we have used group at the point, group at the point, group at the point and group at the point.
- Note (3) Note that the choice of the real space Fermi normal ordering can have an impact on the absolute symmetry sectors of the finite size clusters, relative quantum numbers should however be invariant.
- Albuquerque et al. (2011) A. F. Albuquerque, D. Schwandt, B. Hetényi, S. Capponi, M. Mambrini, and A. M. Läuchli, Phys. Rev. B 84, 024406 (2011).
- Note (4) We disagree with the advocated general 4-fold degeneracy mentioned in Ref. \rev@citealpnumGarcia2013. The four-fold degeneracy is actually an artifact of the sample Corboz et al. (2013).
- Read and Sachdev (1990) N. Read and S. Sachdev, Phys. Rev. B 42, 4568 (1990).
- Moessner et al. (2001) R. Moessner, S. L. Sondhi, and P. Chandra, Physical Review B 64, 144416 (2001).
- Zhu et al. (2013) Z. Zhu, D. A. Huse, and S. R. White, Phys. Rev. Lett. 110, 127205 (2013).
- Ganesh et al. (2013) R. Ganesh, J. van den Brink, and S. Nishimoto, Phys. Rev. Lett. 110, 127203 (2013).
- Gong et al. (2013) S.-S. Gong, D. N. Sheng, O. I. Motrunich, and M. P. A. Fisher, Phys. Rev. B 88, 165138 (2013).
- Note (5) Our numerical current structure factor (see its definition below) are indeed the strongest when on clusters and for instance.
- Note (6) We sum over all bonds which do not share any common site with the reference bond, i.e there are terms.
- Jia et al. (2013) Y. Jia, H. Guo, Z. Chen, S.-Q. Shen, and S. Feng, Phys. Rev. B 88, 075101 (2013).
- Asano and Hotta (2011) K. Asano and C. Hotta, Phys. Rev. B 83, 245125 (2011).
- Motruk et al. (2015) J. Motruk, A. G. Grushin, F. de Juan, and F. Pollmann, Phys. Rev. B 92, 085147 (2015).
- Corboz et al. (2013) P. Corboz, M. Lajkó, K. Penc, F. Mila, and A. M. Läuchli, Phys. Rev. B 87, 195113 (2013).