Electronic structure of Li1+x[Mn0.5Ni0.5]1-xO2 studied by photoemission and x-ray absorption spectroscopy
Abstract
We have studied the electronic structure of Li1+x[Mn0.5Ni0.5]1-xO2 ( = 0.00 and 0.05), one of the promising cathode materials for Li ion battery, by means of x-ray photoemission and absorption spectroscopy. The results show that the valences of Mn and Ni are basically 4+ and 2+, respectively. However, the Mn3+ component in the = 0.00 sample gradually increases with the bulk sensitivity of the experiment, indicating that the Jahn-Teller active Mn3+ ions are introduced in the bulk due to the site exchange between Li and Ni. The Mn3+ component gets negligibly small in the = 0.05 sample, which indicates that the excess Li suppresses the site exchange and removes the Jahn-Teller active Mn3+.
pacs:
71.28.+d, 79.60.-iLayered transition-metal oxides, in which transition-metal atoms form two-dimensional triangular lattices with edge-sharing O6 octahedra, are known as cathode materials for rechargeable batteries. In particular, LixCoO2 has been widely studied for the practical use as a positive electrode material in commercial Li ion batteries Mizushima . Rechargeable batteries using LixCoO2 cathodes exhibit the highest performance among batteries using similar transition metal oxides Mizushima ; Plichta ; Gibbard ; Nagura . However, Co is relatively expensive and alternative cathode materials should be developed with less expensive transition-metal elements. Since Mn and Ni are less expensive than Co, LiMnNiO2 is one of the promising materials Ohzuku ; Cushing . LiMn0.5Ni0.5O2 has the layered -NaFeO2 structure (rhombohedral system, space group Rm), and consists of the O2 ( = Mn and Ni) layers and the interlayers of Li ions. The Li ions occupy the octahedral sites between the O2 layers. In the charging process, Ni2+ ejects two electrons and changes to Ni4+. By increasing the ratio of Li in Li1+x[Mn0.5Ni0.5]1-xO2, the capacity retention is improved as increases up to 0.05 Idemoto . If Jahn-Teller active Mn3+ species exist, the capacity retention would be degraded due to the Jahn-Teller distortion of Mn3+O6 octahedron. Moreover, the exchange between the Ni2+ and Li+ ions plays important roles Idemoto . In order to clarify the effect of the excess Li ions on the electronic structure, we have performed x-ray photoemission spectroscopy (XPS) and x-ray absorption spectroscopy (XAS) measurements of Li1+x[Mn0.5Ni0.5]1-xO2.
Powder samples of Li1+x[Mn0.5Ni0.5]1-xO2 ( = 0.00 and 0.05) were grown by solid state reaction. The samples were pressed onto the carbon tapes which were attached to the sample holder, and were introduced to the chambers under the ultrahigh vacuum. XPS measurements were performed by using JEOL JPS-9200 with a Mg K x-ray source (1253.6 eV). XAS measurements were performed at beamline 7A, Photon Factory, KEK. In the total electron yield (TEY) mode, the total electrons were counted by measuring the sample current. In the fluorescence yield (FY) mode, the O 1 x-ray emission was measured for the inverse partial fluorescence yield (IPFY) method Wadati_2010 ; Wadati_2012 .
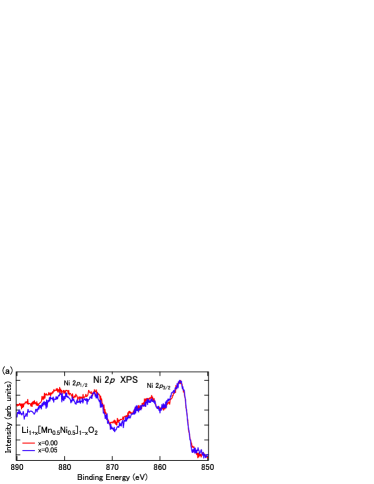
Figures 1(a) and (b) show the Ni 2 and Mn 2 XPS spectra of Li1+x[Mn0.5Ni0.5]1-xO2 ( = 0.00 and 0.05). In the Ni 2 XPS, the peak around 860 eV corresponds to Ni 2 and the peak around 880 eV corresponds to Ni 2. In the Mn 2 XPS, the peaks around 643 eV and 655 eV correspond to the Mn 2 and Mn 2 branches, respectively. The peak shift with is not observed in the Mn 2 and Ni 2 core levels, showing that the valences of Mn and Ni do not depend on appreciably.
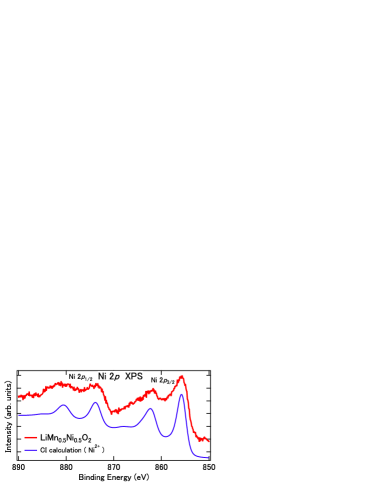
In Fig. 2, the Ni 2 XPS is compared with the configuration interaction (CI) calculation on a NiO6 clsuter model with = 4.5 eV, = eV, and = 7.0 eV. In the present cluster model, the ground state with symmetry is given by the linear combination of , , and configurations, where denotes an O 2 hole. The energy difference between and corresponds to and that between and is basically given by . The final states are described by the linear combinations of , , and configurations, where denotes an Ni 2 hole. The Coulomb interaction between the Ni 3 electrons are given by the Slater integrals , , and . The average Ni 3-Ni 3 Coulomb interaction is expressed by and is an adjustable parameter. and are fixed to 80% of the atomic Hartree-Fock values deGroot . The Coulomb interaction between the Ni 2 core hole and the Ni 3d electron is expressed by the Slater integrals (2p,3d), , and . The average Ni 2-Ni 3 Coulomb interaction is expressed by and is fixed to . and are fixed to 80% of the atomic Hartree-Fock values deGroot . The energy difference between and corresponds to and that between and is . The transfer integrals between the Ni 3 and O 2 orbitals are given by and where the ratio / is fixed at -2.16. As shown in Fig. 2, the charge-transfer satellite is well reproduced by the calculation. The obtained parameters satisfy , indicating that the Ni2+ state falls in the charge-transfer regime. Since is negative, the main and satellite peaks are dominated by the and configurations, respectively.


We performed XAS measurements with various in the TEY mode. The probing depth of the TEY XAS measurement is larger than that of the XPS measurement. Figure 3(a) and (b) show the Ni 2 TEY XAS spectra and their comparison with the reference data Medarde . The peak around 850 eV corresponds to the Ni 2 edge and the peak around 867 eV corresponds to the Ni 2 edge. The lineshape shows that the valence of Ni is dominated by 2+ and does not change as the ratio of Li increases.
In the Mn 2 XAS shown in Fig. 3(c), the peak around 640 eV corresponds to the transition from the Mn 2 core level to the Mn 3 state and the peak around 643 eV corresponds to the transition from the Mn 2 core level to the Mn 3 state. The other peak around 653 eV corresponds to the Mn 2 edge. The lineshape indicates that the valence of Mn is almost 4+. However, it is observed that the height of the edge relative to the edge gets slightly lower as the ratio of Li increases. Considering the fact that the Ni 2 spectral change is negligible, the Mn 2 spectral change with should be taken into account seriously.
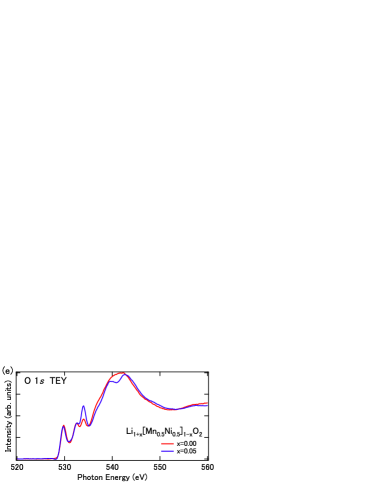
Figure 3(e) shows the O 1 TEY XAS spectra that represent the transitions from the O 1 core level to the O 2 orbitals mixed into the unoccupied Mn and Ni 3 states. Interestingly, the peak around 533 eV gains its intensity with and would be related to the Mn valence change observed in the Mn 2 XAS.
Figure 4(a) shows the Ni 2 TEY XAS spectrum and its comparison with the CI calculation. By using the parameters obtained in Fig. 2, we calculated the theoretical spectrum and attempted to reproduce the experimental result. The theoretical spectrum (calculated by = 4.5 eV, = eV, and = 7.0 eV) is in good agreement with the experimental spectrum, indicating that the Ni 2 TEY XAS spectra are consistent with the Ni 2 XPS spectra. In the Ni 2 XAS, the final states are described by the linear combinations of and configurations. Since is positive, the main peak is dominated by the configurations and the satellite peak is very small. In this sense, the charge transferred configurations are irrelevant in the case of Ni 2 XAS.
Figure 4(b) shows the Mn 2 TEY XAS spectrum and its comparison with the calculated spectra for the transitions from to . Since is positive and the charge transfer satellite is not observed, the Mn 2 XAS lineshape can be evaluated without including the charge transferred configurations. Instead of the O 2-Mn 3 transfer integrals, the energy splitting between the and orbitals (10) is adjusted to reproduce the experimental result. The estimated value of 10 is 2.0 or 2.5 eV as shown in Fig. 4(b). By using 10 = 2.5 eV, we calculated the Mn3+ spectrum for the transitions from to . Then, we added the spectrum of Mn3+ to that of Mn4+, trying to reproduce the experimental spectra of Li1+x[Mn0.5Ni0.5]1-xO2 ( = 0.00 and 0.05). Figure 4(c) shows the Mn 2 XAS spectra and their comparison with the theoretical spectra which correspond to the mixed valence of Mn4+ and Mn3+. In the experimental result, the intensity of peak ( 640.2 eV) relative to that of peak ( 642.7 eV) is reduced with . The theoretical spectra indicate that the intensity of peak ( 640.5 eV) relative to that of peak ( 642.5 eV) gets stronger as the ratio of Mn3+ increases. Therefore, it is considered that the Mn3+ ions exist at = 0.00 and the amount of Mn3+ decreases with .
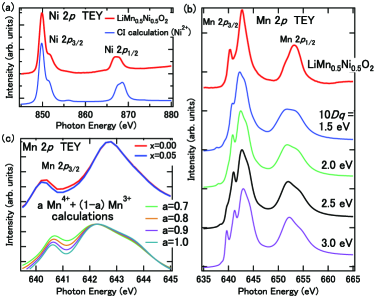
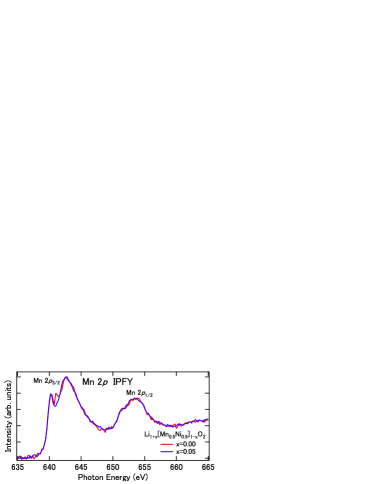
Figure 5 shows the IPFY XAS spectra of Mn 2. The peak around 640 eV corresponds to the transition from the Mn 2 core level to the Mn 3 state and the peak around 643 eV corresponds to the transition from the Mn 2 core level to the Mn 3 state. The other peak around 653 eV corresponds to the Mn 2 edge. The sharp peak around 640 eV is specific for Mn4+ where the orbitals are unoccupied. In addition, we observed a small peak between the peaks around 640 eV and 643 eV at = 0.00. The small peak corresponds to the Mn 2 edge of Mn3+, indicating that the = 0.00 sample contains the Mn3+ ions at the bulk. The small peak vanished with increasing , suggesting that the Mn3+ ions change into the Mn4+ ions as the ratio of Li increases up to x = 0.05.
The Ni 2 and Mn 2 XPS spectra, which are very surface sensitive, indicate that the Ni and Mn valence states do not change at the surface between = 0.00 and 0.05 in Li1+x[Mn0.5Ni0.5]1-xO2. The small contribution of Mn3+ is suggested for = 0.00 in the Mn 2 TEY XAS which is more bulk sensitive than the Mn 2 XPS. The most bulk sensitive IPFY XAS spectra indicate that the Jahn-Teller active Mn3+ component exists at = 0.00 and is dramatically suppressed by increasing x. The existence of Mn3+ at = 0.00 can be attributed to the site exchange between Ni and Li. The fact that the Mn3+ peak is removed with indicates that the almost all the Mn3+ ions are changed to Mn4+ by introducing the excess Li up to x = 0.05 and probably by suppressing the site exchange. It is considered that the Jahn-Teller active Mn3+ ions at the bulk deteriorate the cycle performance of the Li ion battery. Therefore, the decrease of Mn3+ or the decrease of the site exchange with is useful to improve the performance.
The present work has been performed under the approvals of the Photon Factory Program Advisory Committee (Proposal No. 2013G680).
References
- (1) K. Mizushima, P. C. Jones, P. J. Wiseman, and J. B. Goodenough, Mater. Res. Bull. 15, 783 (1980).
- (2) E. Plichta, S. Slane, M. Uchiyama, M. Salomon, D. Chua, W. B. Ebner, and H. W. Lin, J.Electrochem. Soc. 136, 1865 (1989).
- (3) H. F. Gibbard. J.Power Sources 26, 81 (1989).
- (4) T. Nagura and K. Tazawa, Prog. Batteries Sol. Cells 9, 20 (1990).
- (5) T. Ohzuku and Y. Makimura, Chem. Lett. 30, 744 (2001).
- (6) B. L. Cushing and J. B. Goodenough, Solid State Science 4, 1487 (2002).
- (7) Y. Idemoto, T. Hasegawa, N. Kitamura, and Y. Uchimoto, Electrochemistry 79, 15 (2011).
- (8) H. Wadati, D. G. Hawthorn, T. Z. Regier, G. Chen, T. Hitosugi, T. Mizokawa, A. Tanaka, and G. A. Sawatzky, Appl. Phys. Lett. 97, 022106 (2010).
- (9) H. Wadati, A. J. Achkar, D. G. Hawthorn, T. Z. Regier, M. P. Singh, K. D. Truong, P. Fournier, G. Chen, T. Mizokawa, and G. A. Sawatzky, Appl. Phys. Lett. 100, 193906 (2012).
- (10) F. M. F. de Groot, J. C. Fuggle, B. T. Tole, and G. A. Sawatzly, Phys. Rev. B 40, 5715 (1990).
- (11) M. Medarde, A. Fontaine, J. L. Garca-Muoz, J. Rodrguez-Carvajal, M. de Santis, M. Sacchi, G. Rossi, and P. Lacorre, Phys. Rev. B 46, 14975 (1992).
- (12) A. N. Vasiliev, O. S. Volkova, L. S. Lobanovskii, I. O. Troyanchuk, Z. Hu, L. H. Tjeng, D. I. Khomskii, H.-J. Lin, C. T. Chen, N. Tristan, F. Kretzschmar, R. Klingeler, and B. Bchner, Phys. Rev. B 77, 104442 (2008).