Influence of Crystalline Nanoprecipitates on Shear-Band Propagation in Cu-Zr-Based Metallic Glasses
Abstract
The interaction of shear bands with crystalline nanoprecipitates in Cu-Zr-based metallic glasses is investigated by a combination of high-resolution TEM imaging and molecular-dynamics computer simulations. Our results reveal different interaction mechanisms: Shear bands can dissolve precipitates, can wrap around crystalline obstacles, or can be blocked depending on the size and density of the precipitates. If the crystalline phase has a low yield strength, we also observe slip transfer through the precipitate. Based on the computational results and experimental findings, a qualitative mechanism map is proposed that categorizes the various processes as a function of the critical stress for dislocation nucleation, precipitate size, and distance.
Published in:
T. Brink et al.,
Phys. Rev. Applied 5, 054005 (2016)
DOI: 10.1103/PhysRevApplied.5.054005
This article is available under the terms of the
Creative
Commons Attribution 3.0 License. Further distribution of this
work must maintain attribution to the authors and the published
article’s title, journal citation, and DOI.
I Introduction
Metallic glasses (MGs) have advantageous mechanical properties, such as a high yield strength and a large elastic limit, but suffer from brittle failure, especially under tension, at temperatures significantly below the glass transition.Inoue (2000); Ashby and Greer (2006) Under compression, improved ductility is found for composites of MGs and crystalline secondary phases, namely, for Cu-Zr-based,Fan and Inoue (1997); Lee et al. (2006); Hajlaoui et al. (2007); Fornell et al. (2010); Li et al. (2011) Cu-Ti-based,Calin et al. (2003) and Zr-Ti-based MGs.Hays et al. (2000, 2001); Hofmann et al. (2008) Under tension, a small ductility with 1% to 2% strain is observed for Cu-Zr composites containing nanocrystals.Pauly et al. (2010a); Barekar et al. (2010); Pauly et al. (2010b) With a higher volume fraction of the crystalline phase, not only compressive but also significant tensile ductility is reported for Zr-Ti-based,Hofmann et al. (2008); Qiao et al. (2013) Ti-based,Kim et al. (2011) and Cu-Zr-based MGs.Liu et al. (2012); Wu et al. (2014)
For dendritic precipitates, there is a correlation between the location of dendrites and the occurrence of shear-band patterns.Hays et al. (2000, 2001) The improved ductility is generally ascribed to the increased number of shear bands and their limited length given by the constraints of the crystalline phase.Hofmann et al. (2008) Thus, a high volume fraction of ductile crystalline phase improves the ductility in compression and microindentation tests, while a brittle secondary phase does not.Fu et al. (2007) This is confirmed by Song et al., who suggest a crystalline volume fraction between and in Cu-Zr-based MGs for obtaining good mechanical properties,Song et al. (2013) which is consistent with the fact that tensile ductility is observed only in glasses with high volume fractions of ductile crystalline phases.Hofmann et al. (2008); Kim et al. (2011); Liu et al. (2012); Wu et al. (2014)
While the enhancement of macroscopic ductility of MGs with high volume fractions of a ductile crystalline phase can be explained by simple composite models, the influence of nanoprecipitates on the mechanical properties of MGs containing a much lower volume fraction of crystalline matter is still not clear. Similar to the case of dendritic precipitates, shear-band patterns were also observed in glasses containing small spherical crystallites with sizes around .Hajlaoui et al. (2007) These nanoprecipitates can grow during deformation in certain metallic glasses.Lee et al. (2006); Cao et al. (2007); Pauly et al. (2010a); Barekar et al. (2010); Pauly et al. (2010b); Fornell et al. (2010) An increased growth rate of nanocrystallites in shear bands is observed,Chen et al. (2006) which has been related to enhanced atomic mobility inside shear bands.Wilde and Rösner (2011); Bokeloh et al. (2011) Deformation-grown nanocrystallites are observed to contain twins,Cao et al. (2007); Pauly et al. (2010a, b) which occur only in larger crystallites, e.g., with a size greater than in a Cu-Zr-Al MG.Pauly et al. (2010b) These deformation-grown precipitates are the possible reason for strain hardening during nanoindentation, Fornell et al. (2010) as well as increased plastic strain during compression.Lee et al. (2006) It is proposed that the participation of the crystallites in the plastic deformation is the reason for the enhanced ductility: Wu et al. demonstrate that reducing the stacking-fault energy of B2 CuZr by alloying leads to increased twinning and higher ductility under tension.Wu et al. (2012) Pauly et al. propose that a martensitic transformation from the B2 phase to the B phase with a subsequent volume change is responsible for toughening in Cu-Zr-based metallic glasses.Pauly et al. (2010a) This interpretation, however, is not generally accepted. Corteen et al., in contrast, note that the volume change of the martensitic transformation is very small and cannot contribute significantly to toughening.Corteen et al. (2011) They instead suggest that precipitates increase plasticity by favoring the nucleation of new shear bands over the growth of critical shear bands. Indeed, recent simulation and experimental results provide evidence for the fact that crystal–glass interfaces serve as nucleation sites for shear bands and are therefore responsible for the simultaneous nucleation of multiple shear bands.Albe et al. (2013); Zaheri et al. (2014); Wang et al. (2014a) In tensile tests and corresponding molecular dynamics (MD) simulations of nanolaminates of copper nanocrystals separated by thin Cu-Zr glass layers, the crystal–glass interface acts as a source or sink for dislocations. Shear transformation zones (STZs) are activated by interactions with dislocations.Wang et al. (2007); Arman et al. (2011); Brandl et al. (2013)
Computational studies on the interaction of crystalline precipitates with shear bands provide further insights into nanoscale mechanisms. Lund and Schuh conduct quasi-2D molecular-statics simulations of a binary Lennard-Jones system with a nanocrystal inclusion.Lund and Schuh (2007) They identify three mechanisms of deformation, depending on the ratio of shear-band thickness to crystal size. For small crystals, the deformation is accommodated either in the interface (for example, by rotation) or by dissolution of the crystal. For wide shear bands and intermediate crystal sizes, dislocations in the crystal nucleate at the interface. Finally, for crystals larger than the shear band, they observe homogeneous dislocation nucleation due to stress building in the nanocrystal center. However, it is somewhat unclear how the observed homogeneous dislocation nucleation depends on the artificially induced shear band and the resulting stress state in the system. Shi and Falk conduct molecular-dynamics simulations on a monoatomic amorphous model system with a high fraction of bcc nanocrystallites.Shi and Falk (2008) They find that deformation is induced at the interfaces and that shear bands bend around crystallites away from a direction of maximum resolved shear stress. They also observe blocking of shear bands by crystallites. Because of the high fraction of crystalline phase, the system more closely resembles a nanocrystalline structure. The observation of the initiation of plastic deformation at interfaces still matches the simulations by Albe et al. Albe et al. (2013) and underlines the importance of the crystal–glass interface in these composite systems.
While it has been shown that interfaces promote shear-band nucleation and that precipitates can act as obstacles or can deform together with the matrix, there is no comprehensive study that investigates the influence of the size and number density of the precipitates. Furthermore, some mechanisms governing the interaction between a propagating shear band and a preexisting precipitate have been observed but not investigated and discussed in detail. Therefore the goal of this study is to investigate the interaction of a shear band with preexisting precipitates in Cu-Zr-based MGs. In the experimental part of the study, we anneal Zr-Cu-Ag-Al melt-spun ribbons to induce the formation of nanocrystalline precipitates. We present transmission electron microscopy (TEM) images of the samples before and after deformation by cold rolling and identify the effects of crystalline precipitates on the shear-band propagation. Using molecular-dynamics computer simulations, we model composite systems with a metallic-glass matrix and crystalline precipitates. We control the initiation of a shear band using a stress concentrator and put precipitates in its propagation path. The focus of the simulations is on the size effects of “hard” precipitates that do not partake in the plastic deformation. Additionally, we study the shear-band interaction with “soft,” plastically deformable precipitates. Finally, we derive a deformation map from the combined observations of simulations and experiments that classifies the observed mechanisms.
II Experiment
II.1 Experimental setup
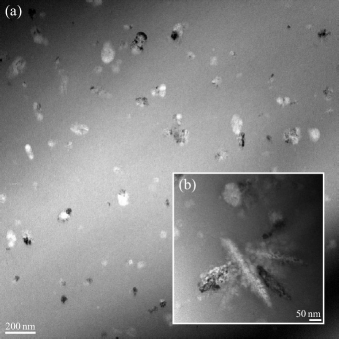
We prepare metallic-glass samples of nominal composition Zr53.8Cu31.6Ag7.0Al7.6 from pure components (Cu: 99.999%, Zr: 99.998%, Ag: 99.999%, Al: 99.999%; all in at.%) by prealloying using arc melting. After repeated arc melting with intermittent turning of the specimen to enhance homogenization, the entire ingots are inserted into quartz-glass crucibles for melt spinning. The weight loss during alloying is minimal and subsequent composition analyses by energy-dispersive x-ray diffraction (EDX) confirm that the composition of the material is equal to the nominal composition within the accuracy of the measurement. For melt spinning, the ingots are inductively melted under an Ar atmosphere and the melt is ejected onto a rotating Cu wheel (tangential wheel velocity: ), resulting in completely amorphous thin ribbon samples of approximately - thickness. X-ray diffraction on the as-quenched ribbon samples does not indicate the presence of any crystalline fraction exceeding the sensitivity threshold of this method. Parts of the ribbon samples are cut to perform differential scanning calorimetry (DSC) measurements in a Perkin Elmer Diamond DSC device. Both isochronal and isothermal measurements under a purified Ar gas flow are conducted and in conjunction with microstructure analyses the time and temperature dependence of the evolving crystalline fraction is determined. On the basis of these results, the samples for deformation processing are annealed in the DSC device at for . This thermal treatment results in the formation of nanocrystalline precipitates with an average diameter of about and a number density on the order of . The resulting microstructure is shown in Fig. 1. Given that the width of shear bands is on the order of ,Rösner et al. (2014) there is no straight path for propagating shear bands to avoid the interaction with nanoprecipitates in these samples.
After the DSC heat treatment, the partially crystalline material is deformed by cold rolling at room temperature in one step to true strain values of about at room temperature, applying a strain rate of the order of . Subsequently, specimens for TEM investigations are prepared by grinding, dimpling, and finally precision ion polishing (PIPS, Gatan), using a low acceleration voltage of and low incidence angles () to minimize damage by the preparation process. The electron transparent samples are then analyzed in dark-field, bright-field, and high-resolution transmission electron microscopy modes in a Zeiss Libra 200FE TEM operated at an acceleration voltage of . Since intrinsic shear bands formed upon cold rolling could not be found during the TEM inspections of the thin foil regions, the shear bands generated as a result of sample preparation and/or subsequent sample manipulation are studied instead. Thus, the final sample state resembles the state in an in situ TEM experiment comparable to the work in Ref. Wilde and Rösner, 2011, where the shear bands are generated at crack tips in the thin TEM foil.
II.2 Experimental results
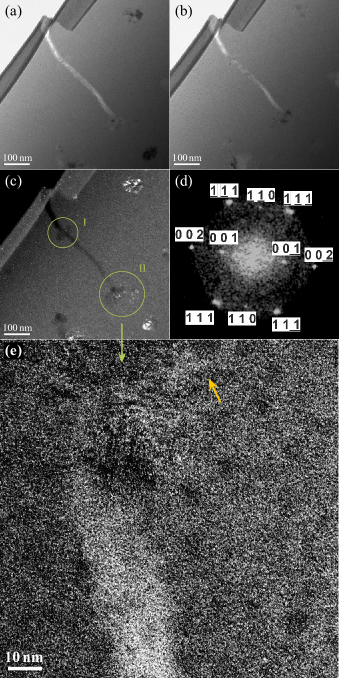
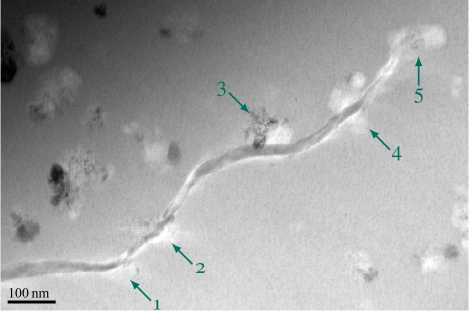
Figure 2 shows a shear band in a sample after TEM preparation. It is noticeable that the shear band switches propagation directions in the vicinity of precipitates. Between precipitates 2 and 3, the shear band has an additional bend. The propagation path, in general, suggests that the shear band is “attracted” to the precipitates, possibly due to a stress field resulting from the density change on crystallization, which explains the change of direction between precipitates 2 and 3. Because of the processing of the samples, it can be excluded that the repeated bending of the shear band results from a change of the external stress state: The deformation by cold rolling is performed in a single step, and the observed shear bands were created during TEM preparation, resembling an in situ experiment. As the path change in the presence of precipitates is rather large (in Fig. 2 around ) and correlated to the position of the precipitates, it is most likely induced by the presence of the precipitates. The literature supports this, as shear bands in homogeneous metallic glasses (Cu-Zr-based or otherwise) are straight on the length scale presented here.Kumar et al. (2007); Wang et al. (2008); Rösner et al. (2014); Schmidt et al. (2015) It is therefore clear that the precipitates play a major role in influencing shear-band propagation and thereby the macroscopic plastic deformation of the material. TEM images of a second shear band, shown in Fig. 3, shed more light on this interaction. The shear band interacts with two precipitates: A crack follows the path of the shear band up to the first precipitate and the shear band continues from the first to the second precipitate. Because of the visible crack opening near the first precipitate, it can be ruled out that the shear band originates from the second precipitate. While the first precipitate is passed, the second precipitate, which is encountered centrally, stops the shear band. This can also be observed at the end of the shear band in Fig. 2. A detailed analysis of the gray-scale intensity distribution of the high-resolution TEM (HRTEM) image in Fig. 3(e) indicates that the shear band changes its path slightly near the crystalline precipitate but does not proceed further or shows slip transfer into the precipitate. Additionally, a smaller, shear-band-like region emerges almost perpendicular to the previous propagation direction (yellow arrow). This indicates either a shear-band deflection, or a nucleation of a new, perpendicular shear band. Based on the highly local nature of the intensity distribution and based on the comparison of the contrast of other precipitates, preparation artifacts can be excluded. Thus, this type of interaction observed here is part of the intrinsic interaction mechanism between precipitates and advancing shear bands. The power spectrum in Fig. 3(d) indicates a precipitate with B crystal structure,Schryvers et al. (1997) which is consistent with prior observations in Cu-Zr-based MGs.Pauly et al. (2010a)
It is clear that the interaction of a propagating shear band with a distribution of crystalline precipitates depends on the actual stress state near the shear-band tip, the already-accommodated stress by the shear-band propagation and the details of the local distribution of crystalline precipitates, their sizes, and the residual stresses in the glass matrix due to the formation of the precipitates. Depending on these factors, there are various explanations for the observed paths: The path changes are caused either by a deflection of the shear band, by the blocking and subsequent renucleation of a new shear band, or by several nascent shear bands growing together. The unhindered “passing” of a precipitate can be explained either by a temporary path change of the shear band or by the participation of the precipitate in the plastic deformation. Because of the necessarily limited amount of data that can be obtained in the experiment, we undertake MD simulations to test the aforementioned hypotheses and investigate their relation to the sample geometry.
III Simulation
III.1 Simulation setup and analysis
![[Uncaptioned image]](/html/1505.00723/assets/video1.png)
In order to gain more insights into the nanoscale mechanisms of shear-band interaction with precipitates, we perform a number of MD computer simulations, which allow for an “in situ” observation of shear-band propagation. We use the software lammps Plimpton (1995) to quench metallic-glass samples, insert precipitates, and perform mechanical testing. The simulated metallic glass is a alloy modeled with a Finnis–Sinclair-type potential by Mendelev et al.Mendelev et al. (2009) Metallic-glass samples with dimensions and are prepared by melting the material at and subsequent quenching to with a cooling rate of .
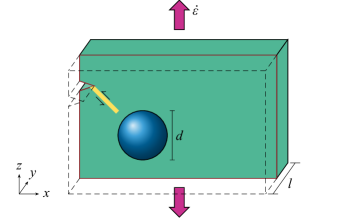
We use the sample geometry illustrated in Fig. 4 to investigate the influence of preexisting precipitates on an approaching shear band. Size effects are studied by varying the diameter of the precipitates and by controlling the distance between periodic precipitate images by varying the box width . Sample sizes are , with , , , and . With a single precipitate per simulation box, this corresponds to number densities for the precipitates of , , , and , respectively. The Cu-Zr glass samples are replicated to reach the desired box dimensions, and spherical precipitates with diameters from to were inserted. For this, a hole is cut into the glass matrix with a size chosen to accommodate the precipitate without overlapping atoms. For the CuZr precipitate, we use the experimentally observed B2 structure.Pauly et al. (2007); Sun et al. (2005); Das et al. (2007); Jiang et al. (2007) The B structure, which was found in the precipitates in the experimental part of this paper, is a distortion of the B2 structure.Schryvers et al. (1997) A notch controls the origin of the shear band and makes sure that it always hits the precipitate. Periodic boundary conditions are applied in the and directions and open boundaries in the direction. The resulting structure is equilibrated at for with a barostat at ambient pressure in periodic directions. After equilibration, no long ranging stress field around the precipitate is left; any mismatches are accommodated by the glass during the interface creation.
The resulting composite samples are deformed at under a constant tensile strain rate of in the direction up to a total strain of at least . The trajectories from equilibrated to fully deformed samples are analyzed to observe the shear-band propagation path. The shear band is identified using the von Mises local shear invariant Shimizu et al. (2007) as implemented in the visualization tool Ovito.Stukowski (2010) Atoms with a local shear greater than around are assigned to the shear band. To observe plastic deformation events in the crystalline phase, we perform atomic structure identification, which can identify crystal structures, stacking faults, and other defects.Stukowski (2012)
III.2 Wrapping and blocking
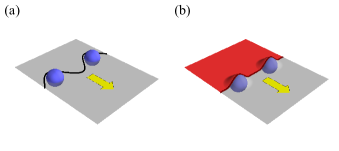
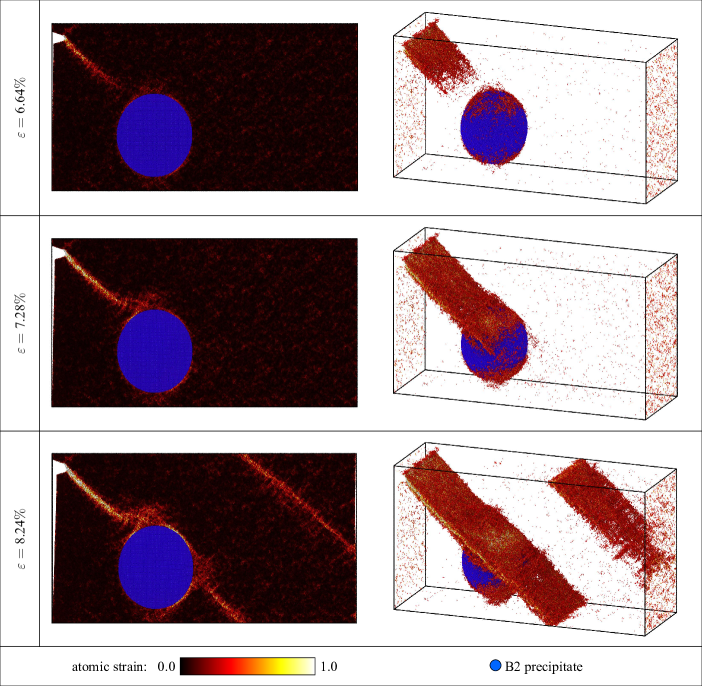
The first observed interaction mechanism between a propagating shear band and a preexisting precipitate is shown in Fig. 5 and Video 1. Here, the shear band wraps around the precipitate like a carpet moving over a small obstacle. The particle does not deform and simply moves along with one half of the glass matrix. We call this mechanism the wrapping mechanism. This kind of athermal mechanism is virtually unknown in crystalline materials. The closest analog in a crystal—dislocation climb—is purely thermally activated. It is therefore instructive to compare the two material classes, as shown in Fig. 6. In a crystalline material, a dislocation moves on defined slip planes. A change of slip plane is possible only for the screw components of the dislocation,Cottrell (1953) is connected with a high energy barrier, and is usually observed only in stage III work hardening.Hirth and Lothe (1982) Therefore, the Orowan mechanism applies: The dislocation is bent around the obstacle and finally forms dislocation rings [Fig. 6(a)].Gottstein (2004) These rings may pile up, thereby hardening the material. In a metallic glass, as in any isotropic material, all slip directions are equivalent. Only an applied external stress differentiates the directions. Under tensile stress, the planes oriented in angles towards the tensile axis experience the highest resolved stress. An obstacle can be avoided simply by temporarily and locally changing the slip path, thereby wrapping around the obstacle [Fig. 6(b)]. Depending on the precipitate distance, this wrapping mechanism is observed for precipitates with diameters smaller than to in our simulations.
![[Uncaptioned image]](/html/1505.00723/assets/video2.png)
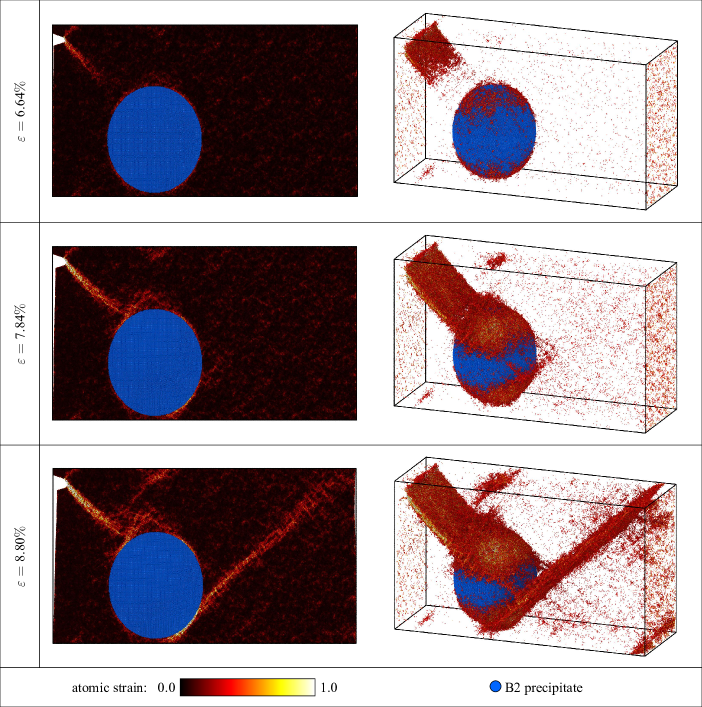
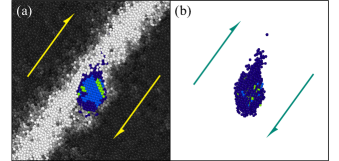
An alternative mechanism appears for increasing diameters and decreasing distances between precipitates: The shear band is blocked by the precipitate. This causes the simultaneous nucleation of a second shear band perpendicular to the first one on the opposite side of the precipitate as shown in Fig. 7 and in Video 2. Again, there is no slip transfer to the crystalline phase. The paths of the shear bands in this simulation and in the HRTEM image of the experimental sample [Fig. 3(e)] are comparable. Both show what looks like a shear band that starts to wrap around the precipitate but does not propagate further. In the experiment, though, no fully formed shear band appears perpendicular to the original one. This may be a result of the more complex stress state or the fact that a new shear band can nucleate at another precipitate that is not visible in the images. Still, a region resembling a nascent shear band appears perpendicular to the original propagation direction, strengthening the agreement with the simulation results.
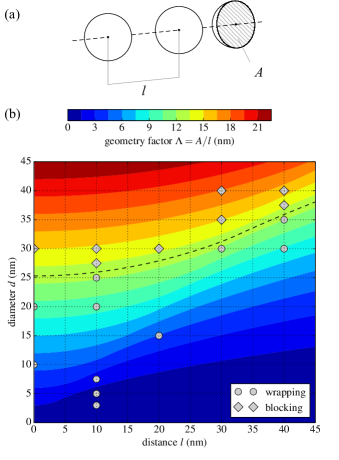
A systematic investigation of the parameters of precipitate distance and size reveal a clear correlation with the mechanism. For a more quantitative analysis, we define an empirical parameter , which is given by the ratio of the cross-sectional area of the precipitate divided by the distance of precipitate centers as shown in Fig. 8(a). Similar to the derivation of the Orowan stress, the crystalline volume fraction can be estimated from the average crystallite distance by the relationGottstein (2004)
| (1) |
Using that, we can express only in terms of volume fraction and precipitate geometry:
| (2) |
For nonoverlapping precipitates (), it is and reduces to
| (3) |
When the precipitates overlap (), we reduce the area to remove the overlapping circle segments. In the limit , corresponds to of an infinite cylinder parallel to the shear-band front. Figure 8(b) shows a contour plot of the parameter as a function of the precipitate diameter and distance. The data points in the plot represent results from our MD simulations, divided into those showing the wrapping and those showing the blocking mechanism. For the simulation geometry used in this work, there exists a given that clearly separates the two mechanisms:
| (4) |
This is not universal, as, for example, the distance between precipitate and notch is not varied. A test simulation finds that increasing the distance from the notch and therefore increasing shear-band length favors the wrapping mechanism.
Using these formulas, we can also estimate for the experimental results. Given a number density of precipitates and particle diameters of around , we obtain
| (5) | ||||
| (6) |
This is consistent with the fact that the shear bands that are observed in the glass samples are blocked by the precipitates. Still, the value is close to , which means that slightly smaller precipitates (or precipitates that are not hit centrally, virtually decreasing the prefactor ) may be susceptible to wrapping.
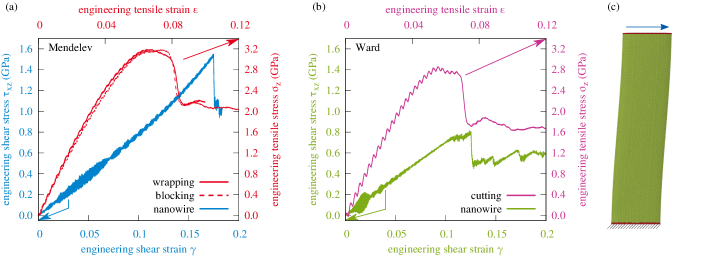
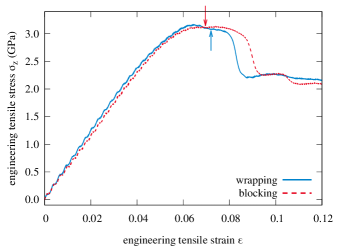
Figure 9 shows examples of the stress-strain curves of samples that exhibit either the wrapping or the blocking mechanism. Neither a pronounced ductility nor significant strain hardening can be observed. This lack of strain hardening is in accordance with experimental data for tensile tests on Cu-Zr-based metallic glasses with crystalline precipitates.Pauly et al. (2010a); Barekar et al. (2010); Pauly et al. (2010b) It also fits with a recent study of compression tests of Cu-Zr-based metallic glass, that finds an effect of particle size on mechanical parameters but no particle hardening.Wang et al. (2014b)
III.3 Plastic deformation of the crystalline phase
![[Uncaptioned image]](/html/1505.00723/assets/video3.png)
The precipitates discussed until now were all “hard,” i.e., not susceptible to plastic deformation under the simulation conditions: Because of the high antiphase-boundary energy in the B2 structure, superdislocations or twinning with respect to a martensitic transformation would be needed for a plastic deformation of the precipitates. The stress available at the shear-band tip is not sufficient to nucleate these defects, which explains why no plastic deformation of the crystalline phase can be observed in our simulations. In experiments, deformation-grown precipitates show twinning defects which may cause softening effects and make the precipitate susceptible to plastic deformation.Cao et al. (2007) As a model for a softer precipitate, we thus exchange the B2 crystal phase for fcc copper.
For precipitates that are small relative to the shear-band width, the nanocrystals undergo mechanical dissolution.Lund and Schuh (2007); Albe et al. (2013) This is also observed in our setup with - particles as shown in Fig. 10. In samples with larger diameters, the precipitates do not deform plastically but instead show the same wrapping and blocking interactions as described before for the “hard” precipitates. Even if the glide plane is oriented parallel to the shear-band direction to maximize resolved shear stress on the preferred fcc slip plane, we do not observe slip transfer into the nanoprecipitate. The corresponding stress-strain curves are shown in Fig. 11(a). To explain this, we estimate the critical stress for heterogeneous dislocation nucleation in fcc copper by shearing a nanowire on the plane in the direction [see Fig. 11(c) for the simulation setup]. For this, we hold the lower layer of atoms fixed and move the top layer of atoms with a constant velocity in the direction to achieve volume-conserving shear. The diameter of the nanowire is , i.e., on the order of the smaller precipitates to maximize surface effects. The resulting shear stress over shear curve is also plotted in Fig. 11(a). The yield stress of the nanowire, , is an estimate for the stress needed for heterogeneous dislocation nucleation at the glass-precipitate interface. For comparing the shear stress in the nanowire with the tensile stress in the composite, we assume a Schmid factor of and scale the tensile axis by a factor compared to the shear stress axis. This graphically estimates an upper bound of the shear stress that arrives at the precipitate, corresponding values are given in Table 1. The upper bound of the estimated maximum resolved shear stress in the composite is comparable to the lower bound for heterogeneous dislocation nucleation. While this suggests that dislocation nucleation may be possible, it is important to keep in mind that the nanowire shear test provides only a lower bound in an idealized case and that the actual shear stress available to nucleate a dislocation may be lower than , which is why no plastic deformation of the precipitate is observed. Evidently, the value of in the Mendelev potential is much too high, and therefore the Cu precipitates are “harder” than expected, which is a deficiency of the potential model for pure Cu.
| (GPa) | (GPa) | (GPa) | |
|---|---|---|---|
| Mendelev | |||
| Ward |
Because of this, we switch to a different potential, which provides a better description of crystalline Cu. The Finnis–Sinclair-type potential by Ward et al. Ward et al. (2012) is created by using preexisting potentials for the elemental phases Zhou et al. (2004) and fitting the cross terms to the intermetallic phases. As shown in the Appendix, this potential has a more realistic unstable stacking-fault energy and critical stress for homogeneous dislocation nucleation than the Mendelev potential. As shown in Fig. 11(b) and Table 1, the critical stress for heterogeneous nucleation is much lower than even the steady-state stress in the composite, easily allowing plastic deformation of the particle.
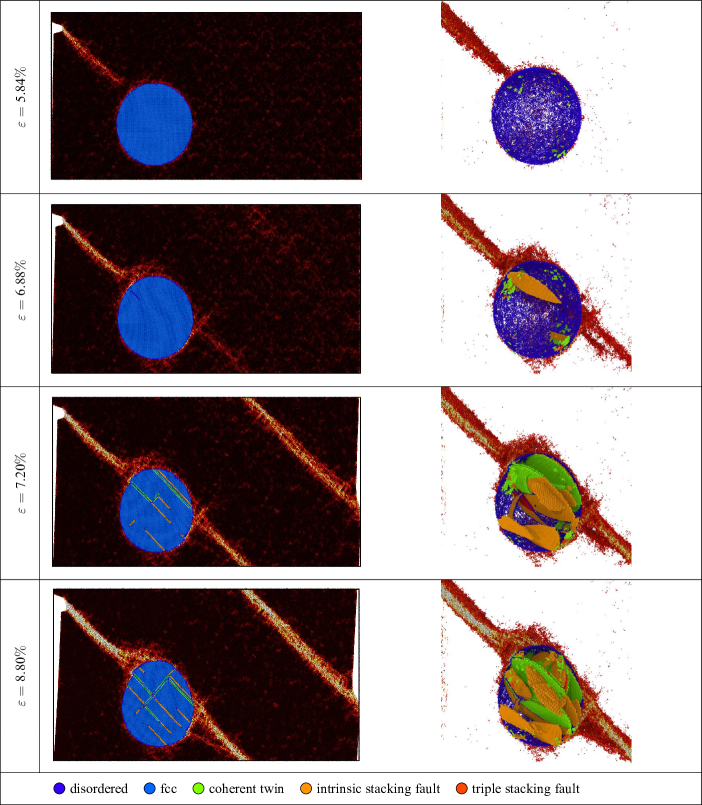
The results for a - copper precipitate are shown in Fig. 12 and in Video 3. The precipitate is cut by the shear band, and slip transfer through the particle can be observed. This mechanism replaces the previously discussed blocking of the shear band if the nanoprecipitates are “soft”: For the crystal to partake in the plastic deformation, dislocation nucleation must be possible at shear stresses below the highest resolved shear stress in the metallic glass at yield. Despite the participation of the crystalline phase in the plastic deformation, the stress-strain curve in Fig. 11(b) shows the distinctive stress drop connected with a single critical shear band and no strain hardening. The reason is that in this setup the crystalline phase accounts only for roughly of the sample. This means that the macroscopic mechanical properties are still dominated by the metallic glass. As the shear band can simply cut through the crystal, the precipitate poses no obstacle to the percolation of the critical shear band. For a larger crystalline volume, a ductile crystalline phase could possibly also constrain the shear bands.Hofmann et al. (2008)
IV Discussion
Using TEM imaging, we observe shear-band bending around or close to precipitates, an attraction of shear bands to the precipitates, and shear bands being blocked by precipitates. In our MD simulations, we find four mechanisms of interaction between shear bands and precipitates:
-
(i)
precipitates that are small relative to the shear-band width dissolve mechanically,
-
(ii)
shear bands can wrap around precipitates,
-
(iii)
shear bands are blocked by precipitates, and
-
(iv)
shear bands cut through precipitates, and slip transfer into the crystalline phase takes place.
Which of these mechanisms is active for a given precipitate depends on the competition between the propagation of the existing shear band, the heterogeneous nucleation of a new shear band, and the heterogeneous dislocation nucleation in the precipitate. The wrapping-to-blocking transition can be quantified by the parameter . Below , the wrapping mechanism is favored. This value can be be explained by the following simple argument. When the shear band reaches a precipitate which does not deform, the shearing of the sample momentarily stops. The stress in the shear band resulting from the externally applied tensile stress amounts to
| (7) |
This stress acts mainly on the shear-band front, allowing us to write
| (8) |
where is the width of the shear band. At the moment that the shear band hits the precipitate, the force must be equal to a reaction force from the precipitate (actio est reactio). Using the projected precipitate area (cf. Fig. 13), we can convert that force into a normal stress:
| (9) |
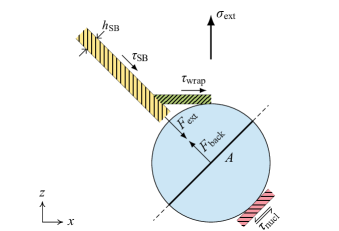
We assume that predominantly acts on one half of the obstacle (area ), which is supported by the deformation pattern of the plastically deformed particle (Fig. 12 and Video 12). This back stress results in a shear stress in the plane of the wrapping shear band (green shear band in Fig. 13). With , it is
| (10) |
must surpass a critical value to allow the initiation of the wrapping mechanism; otherwise the shear band simply stops propagating. This is not observed in our simulations, suggesting that at yield is greater than
| (11) |
The competing mechanism, blocking the shear band and nucleating a new one (red shear band in Fig. 13), can simply be expressed by a critical shear stress . Because of the low temperature in the simulation and a stress close to the yield stress, we consider only the athermal case and do not invoke a nucleation term which takes into account the relative volume of the interface. With , the transition from wrapping to blocking takes place where
| (12) | ||||
| (13) |
This derivation also works in the case of externally applied shear stress, by replacing with .
Assuming that nucleating a new shear band at the interface and propagating the wrapping shear band along the interface have similar critical stresses, we can simplify Eq. 13 to
| (14) |
Shear bands in Cu-Zr-based glasses have widths of around ,Ritter and Albe (2011) which fits to the observed in our model systems. As stated earlier, the wrapping mechanism becomes more favorable again if the shear band is longer before it hits the precipitate. The reason is that this gives the shear band time to deviate slightly from its path, so that it does not hit the precipitate centrally, thus effectively reducing . In practice, this is not a big problem, as the free shear-band length is constrained to approximately anyway due to the distribution of precipitates in the sample. While this derivation is only approximate, it seems to be sufficient to explain the observed phenomena and guide future efforts in tuning the mechanical behavior of crystal–glass composites. Furthermore, it is easily possible to explain the fourth mechanism, a slip transfer into the crystalline phase. The critical stress for heterogeneous nucleation of a dislocation in the precipitate must be provided by the shear band via . If , we can simply replace by in Eqs. 12 and 13, thereby replacing the blocking mechanism with the plastic deformation of the precipitate. A lowered also lowers .
A simple deflection of the shear band is not observed and seems unlikely, as any deviation of the shear band from its path leads to a reduced resolved shear stress and thereby to a driving force to put it back “on track.” Contrary to the experiment, a change of shear-band path towards the precipitate was also not observed. Because the precipitates in our simulations are inserted artificially and do not have a large stress field around them, this seems reasonable. In thermally grown precipitates, a stress field due to density mismatch between glass and crystal seems likely. Still, due to the geometry of the MD simulations, the shear band has two equivalent propagation pathways from the notch but always chooses the one leading towards the precipitate. This seems to be a weaker form of the attraction observed experimentally.
With these results, we can attempt an explanation of the experimentally observed phenomena. First of all, the blocking of the shear band is a one-to-one correspondence between simulation and experiment. Comparing Fig. 3(e) with Fig. 7, we can see that the path of the shear band looks identical. The shear band wraps partly around the precipitate but is then blocked and does not propagate. Contrary to the simulation, no fully formed shear band but only a small shear-band-like region appears at the opposite crystal–glass interface. This may be a result either of the more complex stress state in the experiment or the fact that other precipitates are available at which the new shear band may nucleate. For the winding shear-band path, we can now exclude a simple deflection as discussed above. A possible explanation would be the concurrent nucleation of nascent shear bands at the crystal–glass interfaces which grow together into a single mature shear band. While the interfaces are known to be nucleation sources for shear bands,Albe et al. (2013); Zaheri et al. (2014); Wang et al. (2014a) our simulations show that the nucleation of a shear band at a stress concentrator like a notch or a crack always takes precedence to nucleation at interfaces or surfaces. The shear bands shown in the TEM images all originate from crack tips, making it unlikely that the shear band shown in Fig. 2 consists of several concurrently nucleated shear bands. This leaves the explanation that this winding path is a series of subsequent blocking and renucleation events.
The observed corresponds to precipitate diameters somewhere between and , depending on the interparticle distance. This critical diameter is on the order of magnitude reported in several experimental studies for twinning in B2 crystals in Cu-Zr-Al-based metallic glasses of .Pauly et al. (2010b); Kuo et al. (2014) It also fits an experimental work on Al-based glasses, where crystallites growing during deformation are sheared apart when they reach a critical size of about .Hebert et al. (2006) Cu50Zr45Ti5 metallic glasses exhibit a critical size of about for twinning of B2 precipitates.Wang et al. (2014b) The interparticle distances in these experiments are on the same order of magnitude as for our simulations. This supports an explanation of a transition from wrapping to slip transfer in these systems.
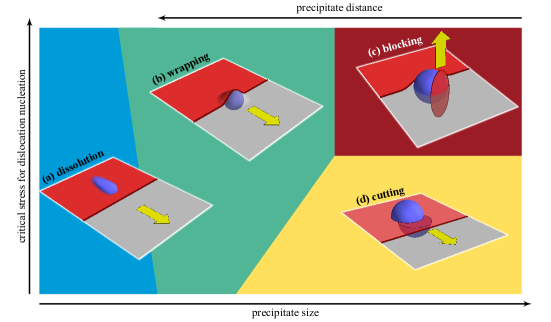
Figure 14 summarizes the competition between the different mechanisms. Mechanical dissolution of the crystalline particles occurs only if their size is comparable to the shear-band size.Lund and Schuh (2007) With further increasing precipitate sizes, the shear band can still wrap around the obstacle until the size reaches a threshold value. This critical size also depends on the precipitate distance, as discussed before, expressed in the parameter . If wrapping is no longer possible, a precipitate which reacts only elastically to the applied stress will block the shear band. If the precipitate is susceptible to plastic deformation, slip transfer into the precipitate will take place.
Concerning the mechanical performance of such in situ composites with crystalline precipitates that originate from nucleation and growth within the glass, the current results suggest that the discussed geometrical effects serve to improve the macroscopic mechanical performance. None of the presented mechanisms seem to inhibit the percolation of a critical shear band, yet, catastrophic slip along a shear band leading to complete failure is delayed in the case of winding shear bands due to the increase of the shear-band path length as well as the raised activation barriers for slip along shear bands that have a more complex topology. The wrapping mechanism does not pose an obstacle to shear-band propagation, but can be avoided by appropriate adjustment of the crystalline volume fraction and precipitate diameter. “Soft” precipitates additionally open possibilities to adjust the plastic deformation by participating in it. Consistently, by increasing the volume fraction of the ductile crystalline phase, the constraints on shear-band propagation can be increased, immediate failure can be prevented (cf. Ref. Hofmann et al., 2008), and the composite displays macroscopic mechanical behavior according to a mixing rule, further allowing one to tailor the properties.
V Conclusions
Using TEM imaging, we observe shear-band bending around or close to precipitates, an attraction of shear bands to the precipitates, and shear bands being blocked by precipitates. MD simulations reveal that the shear-band bending is most likely the result of the subsequent blocking and renucleation of shear bands. Moreover, we identify shear bands wrapping around precipitates and slip transfer into the crystalline phase. By describing the competition between the critical stress for wrapping, the nucleation of a new shear band, and the nucleation of dislocations in the crystal, we could derive a mechanism map for metallic glasses with nanocrystalline precipitates. This detailed description of shear-band propagation not only helps to understand the mechanical failure of these composites but also aids in tuning them.
Acknowledgements.
The authors thank J. Bünz and M. Gerlitz for help with sample preparation and DSC characterization. Financial support by the Deutsche Forschungsgemeinschaft (DFG) through project grants nos. AL 578/13-1, AL 578/6-2, and WI 1899/12-1 is gratefully acknowledged. Computing time was granted by the John von Neumann Institute for Computing (NIC) and provided on the supercomputer JUROPA at Jülich Supercomputing Centre (JSC), as well as by the Gauss Centre for Supercomputing (GCS) through the NIC on the GCS share of the supercomputer JUQUEEN at JSC. GCS is the alliance of the three national supercomputing centers HLRS (Universität Stuttgart), JSC (Forschungszentrum Jülich), and LRZ (Bayerische Akademie der Wissenschaften), funded by the German Federal Ministry of Education and Research and the German State Ministries for Research of Baden-Württemberg, Bayern, and Nordrhein-Westfalen. Additional computing time was made available by the Technische Universität Darmstadt on the Lichtenberg cluster.*
Appendix A Generalized stacking-fault energy in fcc copper
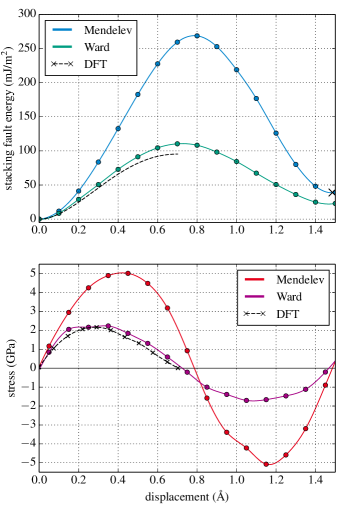
The generalized stacking-fault energy in fcc copper is calculated by using both Mendelev Mendelev et al. (2009) and Ward Zhou et al. (2004); Ward et al. (2012) potentials. Density-functional theory (DFT) calculations from Ogata et al. Ogata et al. (2002) using the same method are used for comparison. This is plotted in Fig. 15. The Ward potential much more accurately describes the stacking-fault energy than the Mendelev potential, which has a critical stress for homogeneous dislocation nucleation which is more than two times too high.
References
- Inoue (2000) A. Inoue, Acta Mater. 48, 279 (2000).
- Ashby and Greer (2006) M. F. Ashby and A. L. Greer, Scr. Mater. 54, 321 (2006).
- Fan and Inoue (1997) C. Fan and A. Inoue, Mater. Trans. JIM 38, 1040 (1997).
- Lee et al. (2006) S.-W. Lee, M.-Y. Huh, E. Fleury, and J.-C. Lee, Acta Mater. 54, 349 (2006).
- Hajlaoui et al. (2007) K. Hajlaoui, A. R. Yavari, A. LeMoulec, W. J. Botta, F. G. Vaughan, J. Das, A. L. Greer, and A. Kvick, J. Non-Cryst. Solids 353, 327 (2007).
- Fornell et al. (2010) J. Fornell, E. Rossinyol, S. Suriñach, M. D. Baró, W. H. Li, and J. Sort, Scr. Mater. 62, 13 (2010).
- Li et al. (2011) J. B. Li, J. S. C. Jang, S. R. Jian, K. W. Chen, J. F. Lin, and J. C. Huang, Mater. Sci. Eng. A 528, 8244 (2011).
- Calin et al. (2003) M. Calin, J. Eckert, and L. Schultz, Scr. Mater. 48, 653 (2003).
- Hays et al. (2000) C. C. Hays, C. P. Kim, and W. L. Johnson, Phys. Rev. Lett. 84, 2901 (2000).
- Hays et al. (2001) C. C. Hays, C. P. Kim, and W. L. Johnson, Mater. Sci. Eng. A 304–306, 650 (2001).
- Hofmann et al. (2008) D. C. Hofmann, J.-Y. Suh, A. Wiest, G. Duan, M.-L. Lind, M. D. Demetriou, and W. L. Johnson, Nature 451, 1085 (2008).
- Pauly et al. (2010a) S. Pauly, S. Gorantla, G. Wang, U. Kühn, and J. Eckert, Nat. Mater. 9, 473 (2010a).
- Barekar et al. (2010) N. S. Barekar, S. Pauly, R. B. Kumar, U. Kühn, B. K. Dhindaw, and J. Eckert, Mater. Sci. Eng. A 527, 5867 (2010).
- Pauly et al. (2010b) S. Pauly, G. Liu, S. Gorantla, G. Wang, U. Kühn, D. H. Kim, and J. Eckert, Acta Mater. 58, 4883 (2010b).
- Qiao et al. (2013) J. W. Qiao, T. Zhang, F. Q. Yang, P. K. Liaw, S. Pauly, and B. S. Xu, Sci. Rep. 3, 2816 (2013).
- Kim et al. (2011) C. P. Kim, Y. S. Oh, S. Lee, and N. J. Kim, Scr. Mater. 65, 304 (2011).
- Liu et al. (2012) Z. Liu, R. Li, G. Liu, K. Song, S. Pauly, T. Zhang, and J. Eckert, AIP Adv. 2, 032176 (2012).
- Wu et al. (2014) F.-F. Wu, K. C. Chan, S.-T. Li, and G. Wang, J. Mater. Sci. 49, 2164 (2014).
- Fu et al. (2007) X. L. Fu, Y. Li, and C. A. Schuh, Scr. Mater. 56, 617 (2007).
- Song et al. (2013) K. K. Song, S. Pauly, B. A. Sun, J. Tan, M. Stoica, U. Kühn, and J. Eckert, AIP Adv. 3, 012116 (2013).
- Cao et al. (2007) Q. P. Cao, J. F. Li, Y. Hu, A. Horsewell, J. Z. Jiang, and Y. H. Zhou, Mater. Sci. Eng. A 457, 94 (2007).
- Chen et al. (2006) M. Chen, A. Inoue, W. Zhang, and T. Sakurai, Phys. Rev. Lett. 96, 245502 (2006).
- Wilde and Rösner (2011) G. Wilde and H. Rösner, Appl. Phys. Lett. 98, 251904 (2011).
- Bokeloh et al. (2011) J. Bokeloh, S. V. Divinski, G. Reglitz, and G. Wilde, Phys. Rev. Lett. 107, 235503 (2011).
- Wu et al. (2012) Y. Wu, D. Q. Zhou, W. L. Song, H. Wang, Z. Y. Zhang, D. Ma, X. L. Wang, and Z. P. Lu, Phys. Rev. Lett. 109, 245506 (2012).
- Corteen et al. (2011) J. Corteen, M. Rainforth, and I. Todd, Scr. Mater. 65, 524 (2011).
- Albe et al. (2013) K. Albe, Y. Ritter, and D. Şopu, Mech. Mater. 67, 94 (2013).
- Zaheri et al. (2014) A. Zaheri, F. Abdeljawad, and M. Haataja, Model. Simul. Mater. Sc. 22, 085008 (2014).
- Wang et al. (2014a) Y. S. Wang, G. J. Hao, Y. Zhang, J. P. Lin, L. Song, and J. W. Qiao, Surf. Interface Anal. 46, 293 (2014a).
- Wang et al. (2007) Y. Wang, J. Li, A. V. Hamza, and T. W. Barbee, Proc. Natl. Acad. Sci. 104, 11155 (2007).
- Arman et al. (2011) B. Arman, C. Brandl, S. N. Luo, T. C. Germann, A. Misra, and T. Çağin, J. Appl. Phys. 110, 043539 (2011).
- Brandl et al. (2013) C. Brandl, T. C. Germann, and A. Misra, Acta Mater. 61, 3600 (2013).
- Lund and Schuh (2007) A. C. Lund and C. A. Schuh, Philos. Mag. Lett. 87, 603 (2007).
- Shi and Falk (2008) Y. Shi and M. L. Falk, Acta Mater. 56, 995 (2008).
- Rösner et al. (2014) H. Rösner, M. Peterlechner, C. Kübel, V. Schmidt, and G. Wilde, Ultramicroscopy 142, 1 (2014).
- Kumar et al. (2007) G. Kumar, T. Ohkubo, T. Mukai, and K. Hono, Scr. Mater. 57, 173 (2007).
- Wang et al. (2008) K. Wang, T. Fujita, Y. Zeng, N. Nishiyama, A. Inoue, and M. Chen, Acta Mater. 56, 2834 (2008).
- Schmidt et al. (2015) V. Schmidt, H. Rösner, M. Peterlechner, G. Wilde, and P. M. Voyles, Phys. Rev. Lett. 115, 035501 (2015).
- Schryvers et al. (1997) D. Schryvers, G. S. Firstov, J. W. Seo, J. V. Humbeeck, and Y. N. Koval, Scr. Mater. 36, 1119 (1997).
- Plimpton (1995) S. Plimpton, J. Comp. Phys. 117, 1 (1995), http://lammps.sandia.gov/.
- Mendelev et al. (2009) M. I. Mendelev, M. J. Kramer, R. T. Ott, D. J. Sordelet, D. Yagodin, and P. Popel, Philos. Mag. 89, 967 (2009).
- Pauly et al. (2007) S. Pauly, J. Das, C. Duhamel, and J. Eckert, Adv. Eng. Mater. 9, 487 (2007).
- Sun et al. (2005) Y. F. Sun, B. C. Wei, Y. R. Wang, W. H. Li, T. L. Cheung, and C. H. Shek, Appl. Phys. Lett. 87, 051905 (2005).
- Das et al. (2007) J. Das, S. Pauly, C. Duhamel, B. C. Wei, and J. Eckert, J. Mater. Res. 22, 326 (2007).
- Jiang et al. (2007) F. Jiang, D. H. Zhang, L. C. Zhang, Z. B. Zhang, L. He, J. Sun, and Z. F. Zhang, Mater. Sci. Eng. A 467, 139 (2007).
- Shimizu et al. (2007) F. Shimizu, S. Ogata, and J. Li, Mater. Trans. 48, 2923 (2007).
- Stukowski (2010) A. Stukowski, Model. Simul. Mater. Sc. 18, 015012 (2010), http://ovito.org/.
- Stukowski (2012) A. Stukowski, Model. Simul. Mater. Sc. 20, 045021 (2012).
- Cottrell (1953) A. H. Cottrell, Dislocations and Plastic Flow in Crystals (Clarendon Press, 1953).
- Hirth and Lothe (1982) J. P. Hirth and J. Lothe, Theory of Dislocations, 2nd ed. (Krieger Publishing Company, 1982).
- Gottstein (2004) G. Gottstein, Physical Foundations of Materials Science (Springer, 2004).
- Wang et al. (2014b) G. Wang, S. Pauly, S. Gorantla, N. Mattern, and J. Eckert, J. Mater. Sci. Technol. 30, 609 (2014b).
- Ward et al. (2012) L. Ward, A. Agrawal, K. M. Flores, and W. Windl, preprint , (2012), arXiv:1209.0619 [cond-mat.mtrl-sci].
- Zhou et al. (2004) X. W. Zhou, R. A. Johnson, and H. N. G. Wadley, Phys. Rev. B 69, 144113 (2004).
- Ritter and Albe (2011) Y. Ritter and K. Albe, Acta Mater. 59, 7082 (2011).
- Kuo et al. (2014) C. N. Kuo, J. C. Huang, J. B. Li, J. S. C. Jang, C. H. Lin, and T. G. Nieh, J. Alloys Compd. 590, 453 (2014).
- Hebert et al. (2006) R. J. Hebert, J. H. Perepezko, H. Rösner, and G. Wilde, Scr. Mater. 54, 25 (2006).
- Ogata et al. (2002) S. Ogata, J. Li, and S. Yip, Science 298, 807 (2002).