Quasi-periodic oscillation of a coronal bright point
Abstract
Coronal bright points (BPs) are small-scale luminous features seen in the solar corona. Quasi-periodic brightnings are frequently observed in the BPs and are generally linked with underneath magnetic flux changes. We study the dynamics of a BP seen in the coronal hole using the Atmospheric Imaging Assembly (AIA) images, the Helioseismic and Magnetic Imager (HMI) magnetogram on board the Solar Dynamics Observatory (SDO) and spectroscopic data from the newly launched Interface Region Imaging Spectrograph (IRIS). The detailed analysis shows that the BP evolves throughout our observing period along with changes in underlying photospheric magnetic flux and shows periodic brightnings in different EUV and FUV images. With highest possible spectral and spatial resolution of IRIS, we attempted to identify the sources of these oscillations. IRIS sit-and-stare observation provided a unique opportunity to study the time evolution of one foot point of the BP as the slit position crossed it. We noticed enhanced line profile asymmetry, enhanced line width, intensity enhancements and large deviation from the average Doppler shift in the line profiles at specific instances which indicate the presence of sudden flows along the line of sight direction. We propose that transition region explosive events (EEs) originating from small scale reconnections and the reconnection outflows are affecting the line profiles. The correlation between all these parameters is consistent with the repetitive reconnection scenario and could explain the quasi-periodic nature of the brightening.
Subject headings:
Sun: oscillations — Sun: corona — Sun: transition region — Sun: UV radiation1. Introduction
Coronal bright points (BPs) are bright dynamical features seen in quiet-sun and coronal holes. The dynamics and evolution was studied in X-rays and EUV wavelengths (Vaiana et al., 1973; Golub et al., 1974, 1976a, 1976b; Habbal & Withbroe, 1981; Zhang et al., 2001; Tian et al., 2008a; Zhang et al., 2012; Li et al., 2013). They generally live for a few hours to few days and have sizes less than . BPs are believed to be composed of loops connected locally with the photospheric bipolar magnetic fields (Golub et al., 1976b; Sheeley & Golub, 1979). With recent high resolution EUV images it is clear that a BP is not a point or simple loop-like structure but looks like a miniature active region with multiple magnetic poles with several connectivities. Moreover, depending on the emergence and cancellation of the magnetic polarities, the BPs evolve with time and show a lot of dynamics. Theoretical model argues that the interaction between two opposite polarities creates a X-point magnetic reconnection that locally heats the corona and produces BPs (Priest et al., 1994; Parnell et al., 1994). The locations of BPs appear to be related to the giant convection cells (McIntosh et al., 2014). Zhang et al. (2012, 2014) suggested that small bipolar emerging magnetic loops might reconnect with an overlying large loop or open field lines and produce brightenings. They also proposed that BPs might consist of two components, one is long-lived smooth component due to gentle quasi-separatrix layer (QSL) reconnections and other is quasi-periodic impulsive component, called as BP flashes.
Sheeley & Golub (1979) reported that the BPs evolve with a 6 minutes time scale. Several observations in X-ray and EUV show periodic variation in the intensity of BPs over a broad range of periodicity (Sheeley & Golub, 1979; Nolte et al., 1979; Habbal & Withbroe, 1981; Strong et al., 1992; Kumar et al., 2011; Tian et al., 2008b; Kariyappa et al., 2011; Chandrashekhar et al., 2013). Some suggested that these oscillations are caused by the leakage of acoustic waves (p-modes), which propagate along the magnetic flux tubes and converts into magnetoacoustic mode at higher atmosphere (Bogdan et al., 2003; Kuridze et al., 2008; Srivastava & Dwivedi, 2010). Others believe that the intensity oscillations are due to repeated magnetic reconnections. (Madjarska et al., 2003; Ugarte-Urra et al., 2004; Doyle et al., 2006).
Several studies have been carried out to understand the periodic nature, but their origin remains inconclusive. Here, we study a BP inside a coronal hole (CH) as seen in the AIA EUV coronal images (Lemen et al., 2012) and in HMI magnetogram (Schou et al., 2012) on the SDO and simultaneously with the newly launched IRIS (De Pontieu et al., 2014). Combining imaging and spectroscopic observations, we study the dynamical changes within this bright point and its variability. We show that the time variability can be explained in terms of a repeated magnetic reconnection scenario.
2. Data analysis and Results
2.1. Observation and Data Reduction
Observational data was obtained from IRIS, AIA and HMI instruments form 5:14 UT to 6:34 UT on 11 May 2014. We used AIA images centered at 335 Å, 193 Å, 171 Å and 1600 Å. AIA and HMI images have pixel size and were co-aligned. IRIS data was taken in sit-and-stare mode. It was pointing towards a coronal hole (centered at ). Slit-jaw images (SJI) were available only with the 1330 Å filter. We have used IRIS Level 2 processed data which takes care of dark current, flat field and geometrical corrections etc. The exposure time and cadence of 1330 Å SJI and spectra were 8 sec and 9.6 sec respectively. IRIS have a pixel size of . AIA and HMI data was then co-aligned with IRIS data. IRIS 1330 Å and AIA 1600 Å were used for co-alignment. De-rotation was performed on all AIA and HMI images to co-align the data cubes.
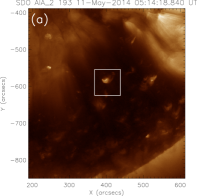
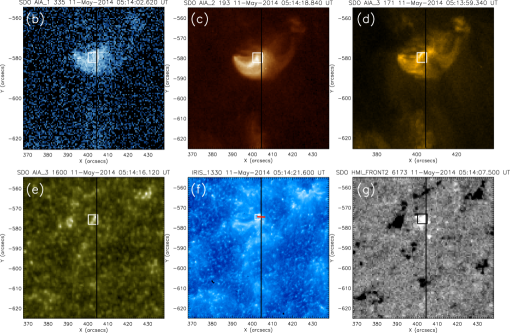
Figure 1 (a) shows the coronal hole in AIA 193 Å image. The magnetogram (Figure 1 (g)) shows that the CH is dominated by negative polarity magnetic field (colorbar can be seen in Figure 2). We made a 48 hours movie with AIA 193 Å images and HMI magnetograms with 1 hour cadence. It reveals that the BP appears around 16:00 UT on 10 May 2014 with emergence of some positive flux and disappears around 17:00 UT on 12 May 2014 (with a life time 38 hours) with the complete disappearance of the positive flux. The positive flux cocentration within this BP over the dominated background negative flux is the probable reason of the existence of the BP. Figure 1 shows the BP as seen in various AIA channels (b-e), IRIS 1330 Å SJI image (f) and HMI LOS magnetogram (g). The vertical black line on each image represents the position of the IRIS slit. It clearly shows that the IRIS slit is crossing one foot point of the bright point, where the magnetic field is positive.
2.2. Magnetic field evolution
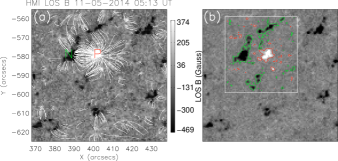
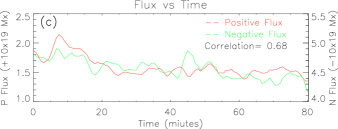
Figure 2 (a) shows the HMI line of sight (LOS) magnetogram. Potential field extrapolation was performed by assuming a constant force-free magnetic field (with (Nakagawa & Raadu, 1972; Alissandrakis, 1981). The white lines connecting different polarities ( Gauss) represent the extrapolated field lines. Strong connectivity between primary polarity P (positive) and N (negative) can be seen. It agrees well with the intensity images as seen in IRIS SJI and AIA images. Our ROI lies well within a CH, primarily dominated by negative flux over the entire region. Based on the main connectivity with the positive flux (P), we have selected a region marked as a white box in Figure 2 (b) to calculate the magnetic flux. Contours with +20 and -20 Gauss are drawn in red and green respectively and fluxes are calculated within these contours. After calculating the fluxes for each time frame, smoothed over 3 frames, light curves (LC) are shown in Figure 2 (c). There appears to be a good correlation between positive and negative flux with a correlation coefficient (CC) of 0.68. It indicates that both positive and negative flux amplitudes vary in a similar manner. Movie 1 (available online) shows small scale magnetic flux emergence and cancellation. It is possible that newly emerging small bipolar loops are reconnecting with the overlying pre-existing large loop (P-N) as suggested by (Priest et al., 1994; Zhang et al., 2012, 2014), which could explain the good correlation. In section 2.4, we show signatures of reconnection and their relation with flux changes.
2.3. Imaging observations
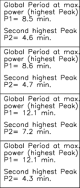
We have focused on the dynamics of one foot point (positive polarity P). We study the time evolution of this small region as seen with simultaneous multi-wavelength images corresponding to the transition region (TR) and coronal layers. We have computed average intensities inside the small white box on top of the foot-point as shown in Figure 1 (b-f). The size of the white box in AIA was 8x8 pixel () and IRIS was 15x15 pixel (). AIA box size was selected slightly larger to accommodate the loop expansion higher up and also to reduce movement effects of the loop if any. The smoothed light curves (LCs) over 3 time frames are shown in the Figure 3. Left panels show (from top to bottom) the LCs of IRIS 1330 Å, AIA 1600 Å, 171 Å and 193 Å respectively. We have performed wavelet analysis (Torrence & Compo, 1998) on each LC after removing background trend. We use Morlet function, a complex sine wave modulated by a Gaussian, for convolution with the time series in the wavelet transform. The global wavelet power spectrum are shown in the middle panel of Figure 3. A confidence level of 99% is overplotted by dotted white line. The confidence level was set by assuming white noise (Torrence & Compo, 1998). Measured periods are printed on the right panels. The global wavelet power plots clearly show the presence of periodicities. A dominant period around 8 minutes is present in IRIS 1330 Å and AIA 1600, 171 Å LCs. Though the global wavelet plots of AIA 171 Å and 193 Å show the presence of strongest peak 12 minutes there is a weaker power around 8 minutes.
Now we try to explore the source of this oscillations. Several observational evidence show a positive correlation between the EUV and X-ray emission with the underlying photospheric magnetic flux (Preś & Phillips, 1999; Handy & Schrijver, 2001; Ugarte-Urra et al., 2004; Pérez-Suárez et al., 2008). Preś & Phillips (1999) have observed that X-ray and EUV emissions are temporally correlated with the photospheric magnetic flux. They also suggested the possibility of several small “network flares” occurring during the lifetime of these BPs. Chandrashekhar et al. (2013) have found a good temporal correlation between magnetic flux associated with the foot points and the intensity brightening and suggested that the possibility of repeated reconnection scenario. Note that most of these were imaging observations. In the following subsection we study the time evolution from the IRIS spectroscopic data which provides additional information of the possible sources of these oscillations. IRIS sit-and-stare observation provides an ideal opportunity to study the time evolution of this foot point as the slit position is crossing it.


2.4. Spectroscopic Analysis
At first, a single Gaussian fit was performed on the averaged (over all the pixel along the slit and time) profile of photospheric Si I 1401.513 Å line for absolute calibration of wavelength. Now, for our spectroscopic study, we have selected a position () which corresponds to one foot point of the bright point loop system. The position is marked by a red tick mark on IRIS 1330 Å SJI in Figure 1 (f). An average over 3 pixels along the slit and a running average of 3 points along dispersion was applied to the spectra to improve signal-to-noise ratio. After that, a single Gaussian fit was applied to each IRIS Si IV 1393.76 Å line profile to derive line intensity, Doppler shift, and FWHM of the line. To compute the asymmetry in the line profile, we performed Red-Blue (RB) asymmetry analysis (De Pontieu et al., 2009; Tian et al., 2011b; Martínez-Sykora et al., 2011). A single Gaussian fit was performed only in the core of the profile to find line centroid (similar to that in Tian et al. (2014)). Red and blue wings was then subtracted and normalized to peak intensity to construct RB asymmetry profile (in percentage). Finally, we have constructed the RB asymmetry light curve by taking average over 15 - 40 Km/s velocity range for each profile. Positive and negative values represent enhancements in the red and blue wings respectively.
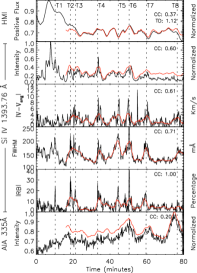
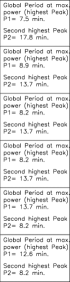
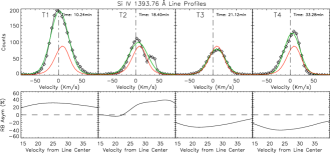
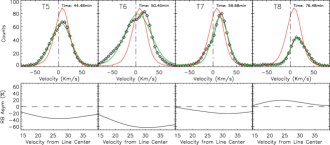
Now, the variation of all the line parameters with time along with HMI positive flux and AIA 335 Å intensity are shown in Figure 4. Different rows (from top to bottom) correspond to HMI positive flux, intensity, deviation from average Doppler shift (), FWHM, absolute RB asymmetry () of Si IV 1393.76 Å line and AIA 335 Å intensity respectively. Now for the correlation studies between different parameters and to find out the periodic nature, we have selected a time interval of 16-80 minutes. The initial rapid change in flux affects the power analysis, so we have omitted first 16 minutes for this analysis. We use trend subtracted smoothed LCs as represented by red lines in Figure 4 for easier comparison. The wavelet analysis was applied over the smoothed curve to investigate the oscillation properties. Global wavelet power spectrum along with 99% confidence level are shown in middle panels. Observed periodicities are then printed on the right side. The power analysis on the line parameters show the omnipresence of a strong periodicity around 8 and 13 minutes. Correlation coefficients (CC) of all the line parameters with the absolute RB asymmetry are printed on each panel. We correlate different LCs with RB asymmetry LC as the RB asymmetry provides a good measurement of the distortion in line profile form Gaussian. To investigate it further, we will focus on specific instances and will have a closer look at the variation of line profiles. We notice sudden changes in the line parameters at certain times. In Figure 4, horizontal grids represent the particular instances where certain changes occur. The line profiles at T1, T2, T3, T4, T5, T6, T7 and T8 time instances are shown in Figure 5 along with averaged (in red) and Gaussian fit (in green) profile. The RB asymmetry profiles are shown in the lower panel. It clearly shows strong asymmetry in the profiles at those particular instances due to existence of some secondary emission component. Movie 2 (available online) shows the evolution of the line profiles.

The correlation between intensity, FWHM, and can be easily explained in terms of sudden flows along the line of sight. In active region boundaries, all the line parameters coherently changes due to quasi-periodic upflows in the medium (De Pontieu & McIntosh, 2010; Tian et al., 2011a, 2012). In our study, we observed both red and blueward asymmetries time to time (see Figure 5) which is different from AR boundary study where predominantly blueward asymmetry is reported. Our observations can be explained in terms of both high-speed upflows and downflows. Transition region explosive events (EEs) could be a possible explanation (Brueckner & Bartoe, 1983; Dere et al., 1989; Innes et al., 1997; Chae et al., 1998; Teriaca et al., 2004; Huang et al., 2014). EEs are believed to result from reconnection which will affect the line profiles. Reconnection jets (regardless of the direction) usually lead to enhancements at the line wing (or wings), which would lead to large RB values, larger line width, larger intensity. The presence of these additional flow components usually also leads to large perturbation of the Doppler shift. This sudden changes in the line parameters is consistent with the behavior of bursty EEs. We find periodic occurrence of EEs at one footpoint of a coronal BP. The observed periodicities at one footpoint of the BP at the different temperature channels is similar to the observed periodic changes in different line parameters which may indicate that recurring EEs are likely producing the oscillatory signal seen in the BP.
Chae et al. (1998) reported that EEs happen preferentially in regions with weak and mixed polarity magnetic fluxes. They also noticed that majority of EEs occur during the cancellation of photospheric magnetic field. In our study, we find correlation between RB asymmetry and underneath positive flux. We use cross correlation technique to find if the two LCs are showing similar variation with some time delay (similar to Tian et al. (2012)). It shows that LC have a time delay (TD) of 1.12 minutes from magnetic flux LC. Hence, It can be conjectured that the line profiles are strongly affected during magnetic flux cancellation phase. It could be that the new emerging flux reconnects with pre-existing field which cancels the local flux and creates EEs. The periodic behavior might be explained by repeated reconnection. One can also notice while carefully looking at the variations, that the RB asymmetry do not change randomly, it changes slowly with a sharp increase around specific instances and then slowly decreases. This matches well with a slow reconnection scenario (Wang & Shi, 1993). Slow magnetic reconnections occurring in lower atmosphere could initiate fast reconnection in the TR and then decreases slowly. After some relaxation time it repeats.
We also searched for the signature of heating due to reconnections. The AIA 335Å channel corresponds to ionization temperature of about 2.5 x K with a wide temperature response. In Figure 4, the 335 Å light curve shows increase of intensity during the time when the line profiles show sudden changes. Due to reconnection, magnetic energy releases and heats the medium locally at TR. This localized heating close to the reconnection point may increase temperature at certain pockets in the TR and AIA may see some of these emissions. Hence, depending on the heating, higher temperature emission can enhance during the reconnection time. The AIA 335 Å light curves show similar property. We wish to address this conjecture in our future work while looking at coronal spectral lines.
3. Conclusion
We study the dynamics of a bright point within a coronal hole using combined imaging, spectroscopic and magnetic measurements. We focused our analysis on one foot point of a bipolar loop structure. Throughout our observation, both positive and negative magnetic flux shows correlated variations. This may suggest that emerging flux interacts with the pre-existing overlying fields, which results in reconnection and cancellation of the flux at the site of bright point. We conjecture that the periodic behavior of the positive flux may correspond to repeated reconnections which leads to a series of continuous periodic brightenings as seen in different EUV and FUV lines. We propose that EEs are created due to X-point magnetic reconnection and resultant outflows generally affect the line profiles. The presence of the secondary component emission in the line profiles confirms that. Furthermore, we observed enhanced line profile asymmetry, enhanced line width, large deviation from the average Doppler shift at specific instances. The correlation between all these parameters is consistent with the scenario of repetitive alteration of the line profile by bursty reconnection outflows. We not only observe similar periodicities at different line parameters of Si IV line but also with AIA channels and they are concurrent in time and space and hence seems to be related. During EEs (see Fig. 4) we see a corresponding change in the magnetic field - this is a one-to-one correspondence and certainly indicates the close relationship between the two.
References
- Alissandrakis (1981) Alissandrakis, C. E. 1981, A&A, 100, 197
- Bogdan et al. (2003) Bogdan, T. J., et al. 2003, ApJ, 599, 626
- Brueckner & Bartoe (1983) Brueckner, G. E., & Bartoe, J.-D. F. 1983, ApJ, 272, 329
- Chae et al. (1998) Chae, J., Wang, H., Lee, C.-Y., Goode, P. R., & Schühle, U. 1998, ApJ, 497, L109
- Chandrashekhar et al. (2013) Chandrashekhar, K., Krishna Prasad, S., Banerjee, D., Ravindra, B., & Seaton, D. B. 2013, Sol. Phys., 286, 125
- De Pontieu & McIntosh (2010) De Pontieu, B., & McIntosh, S. W. 2010, ApJ, 722, 1013
- De Pontieu et al. (2009) De Pontieu, B., McIntosh, S. W., Hansteen, V. H., & Schrijver, C. J. 2009, ApJ, 701, L1
- De Pontieu et al. (2014) De Pontieu, B., et al. 2014, Sol. Phys., 289, 2733
- Dere et al. (1989) Dere, K. P., Bartoe, J.-D. F., Brueckner, G. E., & Recely, F. 1989, ApJ, 345, L95
- Doyle et al. (2006) Doyle, J. G., Popescu, M. D., & Taroyan, Y. 2006, A&A, 446, 327
- Golub et al. (1974) Golub, L., Krieger, A. S., Silk, J. K., Timothy, A. F., & Vaiana, G. S. 1974, ApJ, 189, L93
- Golub et al. (1976a) Golub, L., Krieger, A. S., & Vaiana, G. S. 1976a, Sol. Phys., 49, 79
- Golub et al. (1976b) —. 1976b, Sol. Phys., 50, 311
- Habbal & Withbroe (1981) Habbal, S. R., & Withbroe, G. L. 1981, Sol. Phys., 69, 77
- Handy & Schrijver (2001) Handy, B. N., & Schrijver, C. J. 2001, ApJ, 547, 1100
- Huang et al. (2014) Huang, Z., Madjarska, M. S., Xia, L., Doyle, J. G., Galsgaard, K., & Fu, H. 2014, ApJ, 797, 88
- Innes et al. (1997) Innes, D. E., Inhester, B., Axford, W. I., & Wilhelm, K. 1997, Nature, 386, 811
- Kariyappa et al. (2011) Kariyappa, R., Deluca, E. E., Saar, S. H., Golub, L., Damé, L., Pevtsov, A. A., & Varghese, B. A. 2011, A&A, 526, A78
- Kumar et al. (2011) Kumar, M., Srivastava, A. K., & Dwivedi, B. N. 2011, MNRAS, 415, 1419
- Kuridze et al. (2008) Kuridze, D., Zaqarashvili, T. V., Shergelashvili, B. M., & Poedts, S. 2008, Annales Geophysicae, 26, 2983
- Lemen et al. (2012) Lemen, J. R., et al. 2012, Sol. Phys., 275, 17
- Li et al. (2013) Li, D., Ning, Z. J., & Wang, J. F. 2013, New A, 23, 19
- Madjarska et al. (2003) Madjarska, M. S., Doyle, J. G., Teriaca, L., & Banerjee, D. 2003, A&A, 398, 775
- Martínez-Sykora et al. (2011) Martínez-Sykora, J., De Pontieu, B., Hansteen, V., & McIntosh, S. W. 2011, ApJ, 732, 84
- McIntosh et al. (2014) McIntosh, S. W., Wang, X., Leamon, R. J., & Scherrer, P. H. 2014, ApJ, 784, L32
- Nakagawa & Raadu (1972) Nakagawa, Y., & Raadu, M. A. 1972, Sol. Phys., 25, 127
- Nolte et al. (1979) Nolte, J. T., Solodyna, C. V., & Gerassimenko, M. 1979, Sol. Phys., 63, 113
- Parnell et al. (1994) Parnell, C. E., Priest, E. R., & Golub, L. 1994, Sol. Phys., 151, 57
- Pérez-Suárez et al. (2008) Pérez-Suárez, D., Maclean, R. C., Doyle, J. G., & Madjarska, M. S. 2008, A&A, 492, 575
- Preś & Phillips (1999) Preś , P., & Phillips, K. H. J. 1999, ApJ, 510, L73
- Priest et al. (1994) Priest, E. R., Parnell, C. E., & Martin, S. F. 1994, ApJ, 427, 459
- Schou et al. (2012) Schou, J., et al. 2012, Sol. Phys., 275, 229
- Sheeley & Golub (1979) Sheeley, Jr., N. R., & Golub, L. 1979, Sol. Phys., 63, 119
- Srivastava & Dwivedi (2010) Srivastava, A. K., & Dwivedi, B. N. 2010, MNRAS, 405, 2317
- Strong et al. (1992) Strong, K. T., Harvey, K., Hirayama, T., Nitta, N., Shimizu, T., & Tsuneta, S. 1992, PASJ, 44, L161
- Teriaca et al. (2004) Teriaca, L., Banerjee, D., Falchi, A., Doyle, J. G., & Madjarska, M. S. 2004, A&A, 427, 1065
- Tian et al. (2008a) Tian, H., Curdt, W., Marsch, E., & He, J. 2008a, ApJ, 681, L121
- Tian et al. (2011a) Tian, H., McIntosh, S. W., & De Pontieu, B. 2011a, ApJ, 727, L37
- Tian et al. (2011b) Tian, H., McIntosh, S. W., De Pontieu, B., Martínez-Sykora, J., Sechler, M., & Wang, X. 2011b, ApJ, 738, 18
- Tian et al. (2012) Tian, H., McIntosh, S. W., Wang, T., Ofman, L., De Pontieu, B., Innes, D. E., & Peter, H. 2012, ApJ, 759, 144
- Tian et al. (2008b) Tian, H., Xia, L.-D., & Li, S. 2008b, A&A, 489, 741
- Tian et al. (2014) Tian, H., et al. 2014, Science, 346, 1255711
- Torrence & Compo (1998) Torrence, C., & Compo, G. P. 1998, Bulletin of the American Meteorological Society, 79, 61
- Ugarte-Urra et al. (2004) Ugarte-Urra, I., Doyle, J. G., Madjarska, M. S., & O’Shea, E. 2004, A&A, 418, 313
- Vaiana et al. (1973) Vaiana, G. S., Davis, J. M., Giacconi, R., Krieger, A. S., Silk, J. K., Timothy, A. F., & Zombeck, M. 1973, ApJ, 185, L47
- Wang & Shi (1993) Wang, J., & Shi, Z. 1993, Sol. Phys., 143, 119
- Zhang et al. (2001) Zhang, J., Kundu, M. R., & White, S. M. 2001, Sol. Phys., 198, 347
- Zhang et al. (2014) Zhang, Q. M., Chen, P. F., Ding, M. D., & Ji, H. S. 2014, A&A, 568, A30
- Zhang et al. (2012) Zhang, Q. M., Chen, P. F., Guo, Y., Fang, C., & Ding, M. D. 2012, ApJ, 746, 19