GEMINI/GeMS observations unveil the structure of the heavily obscured globular cluster Liller 1111Based on observations obtained at the Gemini Observatory, which is operated by the Association of Universities for Research in Astronomy, Inc., under a cooperative agreement with the NSF on behalf of the Gemini partnership: the National Science Foundation (United States), the National Research Council (Canada), CONICYT (Chile), the Australian Research Council (Australia), Ministério da Ciência, Tecnologia e Inovação (Brazil) and Ministerio de Ciencia, Tecnología e Innovación Productiva (Argentina). Based on observations gathered with ESO-VISTA telescope (program ID 179.B-2002).
Abstract
By exploiting the exceptional high-resolution capabilities of the near-IR camera GSAOI combined with the multi-conjugate adaptive optics system GeMS at the GEMINI South Telescope, we investigated the structural and physical properties of the heavily obscured globular cluster Liller 1 in the Galactic bulge. We have obtained the deepest and most accurate color-magnitude diagram published so far for this cluster, reaching (below the main sequence turn-off level). We used these data to re-determine the center of gravity of the system, finding that it is located about south-east from the literature value. We also built new star density and surface brightness profiles for the cluster, and re-derived its main structural and physical parameters (scale radii, concentration parameter, central mass density, total mass). We find that Liller 1 is significantly less concentrated (concentration parameter ) and less extended (tidal radius and core radius ) than previously thought. By using these newly determined structural parameters we estimated the mass of Liller 1 ( for a Kroupa IMF), which is comparable to that of the most massive clusters in the Galaxy ( Centauri and Terzan 5). Also Liller 1 has the second highest collision rate (after Terzan 5) among all star clusters in the Galaxy, thus confirming that it is an ideal environment for the formation of collisional objects (such as millisecond pulsars).
1 Introduction
Liller 1 is one of the 7 globular clusters (GCs) located within 1 kpc from the Galactic centre, at a Galactocentric distance of only 0.8 kpc, and very close to the galactic plane (, ; Harris 1996, 2010 edition, hereafter H96). This region of the Galaxy is strongly affected by a large foreground extinction: the average color excess estimated by different authors in the direction of the cluster ranges from about 3.00 to 3.09 (Frogel et al. (1995); Ortolani et al. 1996, 2001; Valenti et al. (2010)) with significant evidence of differential reddening (Ortolani et al., 2001). Such a large value of the extinction has severely hampered the observations of Liller 1 in the optical bands. Indeed very few papers about this cluster can be found in the literature: the only available optical color-magnitude diagram (CMD) of Liller 1 is the one published by Ortolani et al. (1996) by using ESO-NTT data. More in general, the first CMD ever obtained for Liller 1 is the (K,J-K) CMD published by Frogel et al. (1995). However in both cases data are very shallow and the authors were able to sample only the brightest part of the red giant branch (RGB). The deepest photometry of Liller 1 published so far, was obtained by Davidge (2000) and Ortolani et al. (2001) using the Canada-France-Hawaii Telescope and the Hubble Space Telescope, respectively. However, these samples are not deep enough to properly characterize the main sequence turn-off (MS-TO) region of the cluster. A more recent photometric analysis of Liller 1 was performed by Valenti et al. (2010) by using the large near-IR wide field of view (FoV) imager SofI mounted at the ESO-NTT. The obtained CMD samples the brightest portion of the RGB reaching the cluster red clump level ().
Liller 1 is one of the most metal-rich GC in the Galactic bulge. In fact by using high-resolution IR spectroscopy (Origlia et al., 1997), both Origlia et al. (2002) and Stephens & Frogel (2004) measured a metallicity of about one half solar ([Fe/H] dex). A similar value ([Fe/H] dex) was also estimated by Valenti et al. (2010) from a set of photometric indices (see Ferraro et al. 2000) characterizing the location and the morphology of the RGB in the () CMD, and calibrated as a function of the metallicity (Valenti et al., 2004a, b).
One of the most astonishing characteristics of Liller 1 is the extremely large value of the collision rate parameter. Verbunt & Hut (1987) showed that Liller 1 has the second highest value of stellar encounter rate (after Terzan 5; see also Lanzoni et al. 2010) among all star clusters in the Galaxy, thus suggesting that it represents an ideal environment where exotic objects, generated by collisions, can form. In fact, it is commonly believed that dynamical interactions in GCs facilitate the formation of close binary systems and exotic objects like Cataclysmic Variables (CVs), Low Mass X-ray Binaries (LMXBs), Millisecond Pulsars (MSPs) and Blue Straggler Stars (BSSs) (e.g. Bailyn, 1992; Paresce et al., 1992; Ferraro et al., 2001, 2009a, 2012; Ransom et al., 2005; Pooley & Hut, 2006). Moreover, Hui et al. (2010) found that clusters with large collisional parameters and high metallicity (see also Bellazzini et al., 1995) usually host more MSPs. Indeed Terzan 5222Note that this stellar system is suspected to not be a genuine GC, because it harbors at least three stellar populations with different iron abundances (Ferraro et al., 2009b; Origlia et al., 2011, 2013; Massari et al., 2014). hosts the largest population of MSPs among all Galactic GCs (Ransom et al., 2005). A strong -ray emission has been recently detected in the direction of Liller 1 by the Large Area Telescope (LAT) on board the Fermi Telescope (Tam et al., 2011). This is the most intense emission detected so far from a Galactic GC, again suggesting the presence of a large number of MSPs. However, no direct radio detection of these objects has been obtained so far in this system (Ransom et al., 2005). The only exotic object identified in the cluster is the rapid burster MXB 1730-335, an LMXB observed to emit radio waves and type I and type II X-ray bursts (Hoffman et al., 1978). It seems to be located in the central region of Liller 1, but no optical/IR counterpart of this object has been found so far (Homer et al., 2001).
In this paper we present the deepest near-IR photometry of Liller 1 yet obtained and new determinations of its main structural and physical parameters. In Section 2 we discuss the observations and data analysis. Section 3 presents the results obtained, including new determinations of: the distance modulus and reddening (Sect. 3.1), the center of gravity (Sect. 3.2), the star density profile, the structural parameters and the surface brightness (SB) profile (Sect. 3.3), the total luminosity, total mass and central mass density of the cluster (Sect. 3.4). The summary and conclusions are presented in Section 4.
2 Observations and data analysis
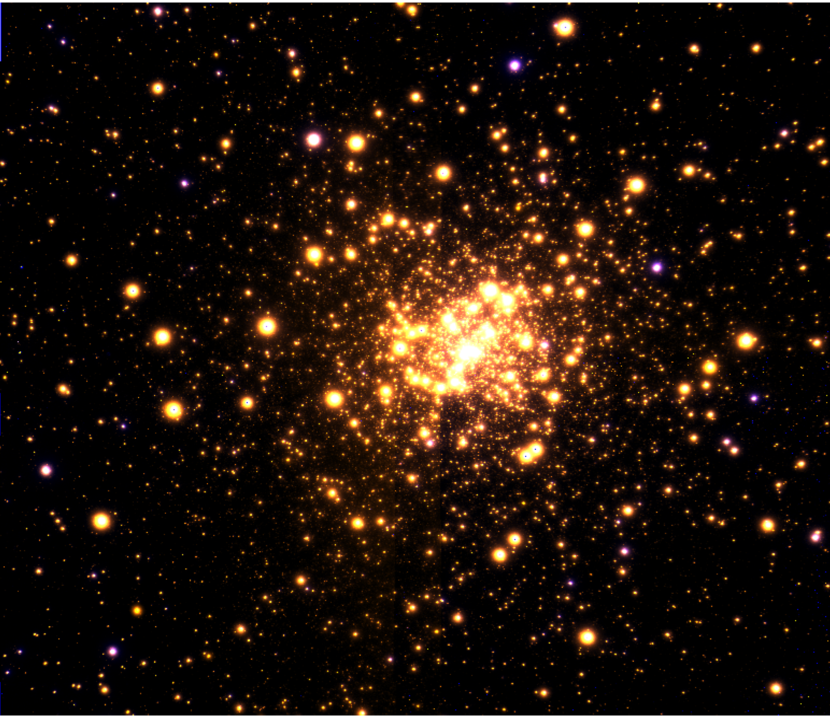
The main photometric data used in the present study consist of a set of high-resolution images obtained with the IR camera Gemini South Adaptive Optics Imager (GSAOI) assisted by the Gemini Multi-Conjugate Adaptive Optics System (GeMS) mounted at the 8 m Gemini South Telescope (Chile), in April 2013 (Program ID: GS-2013-Q-23; PI: D. Geisler). GSAOI is equipped with a mosaic of Rockwell HAWAII-2RG pixels arrays. It covers a global FoV of on the sky, with a resolution of /pixel (Neichel et al., 2014). We sampled the central region of Liller 1 with a mosaic of multiple exposures acquired with a dithering pattern of a few arcseconds. Seven and ten exposures have been acquired in the and bands, respectively, with an exposure time s each. The entire data set was acquired in an interval of time of mins. A constellation of five laser guide stars combined with three natural guide stars has been adopted to compensate the distortions due to the turbulence of Earth’s atmosphere. We have verified that the Full Width at Half Maximum (FWHM) is quite stable allover the FoV with a maximum variation of about , in agreement with what found by Neichel et al. (2014). The average FWHM (i.e. estimated on the entire FoV) varies from to for the images acquired in the band and from to for the ones. These values are only slightly larger than the diffraction limit of the telescope. In Figure 1 we show a two-color image of Liller 1 (catalog ), obtained by combining GEMINI and band observations.
As discussed in Section 3 below, in order to derive the radial star density and SB profiles of Liller 1 (catalog ), we complemented this data set with a near-IR catalog from the VISTA Variables in the Vía Láctea Survey (hereafter VVV, Minniti et al. 2010; Catelan et al. 2011) complemented with the Two Micron All Sky Survey (2MASS; Cutri et al. 2003).
For the GEMINI data set, a standard pre-reduction procedure, using IRAF333IRAF is distributed by the National Optical Astronomy Observatory, which is operated by the Association of Universities for Research in Astronomy, Inc., under cooperative agreement with the National Science Foundation. tools, was applied to the raw images to correct for flat fields and bias, and to perform the sky-subtraction. The photometric reduction was then carried out via point-spread function (PSF) fitting technique in each chip of each image independently, using DAOPHOT (Stetson, 1987), a package developed to perform accurate photometry in crowded fields. The PSF has been modeled by selecting about one hundred bright and isolated stars uniformly distributed in each chip, and by using the DAOPHOT/PSF routine. We allowed the PSF to vary within each chip following a cubic polynomial spatial variation. The best-fit PSF analytic models obtained for the and images, selected on the basis of a test, are a Penny function (Penny, 1976) and a Moffat function with (Moffat, 1969), respectively. The PSF models thus obtained were then applied to all the star-like sources detected at a 3 level from the local background by using ALLSTAR. We have derived in this way the stellar instrumental magnitudes. Then, starting from the star lists thus obtained and to fill the gaps among the GSAOI chips, we created a master star list containing all the stars measured in at least one and image.
As done in other works (see, e.g., Dalessandro et al. 2014, and reference therein), the master-lists thus created have been used as input for ALLFRAME (Stetson, 1994). The files obtained as output have been combined to have a complete catalog with the and magnitudes and the positions of all detected stars. For every stellar source, different magnitude estimates have been homogenized and their mean values and standard deviations have been finally adopted as the star magnitudes and photometric errors in the final catalog (see Ferraro et al. 1991, 1992).
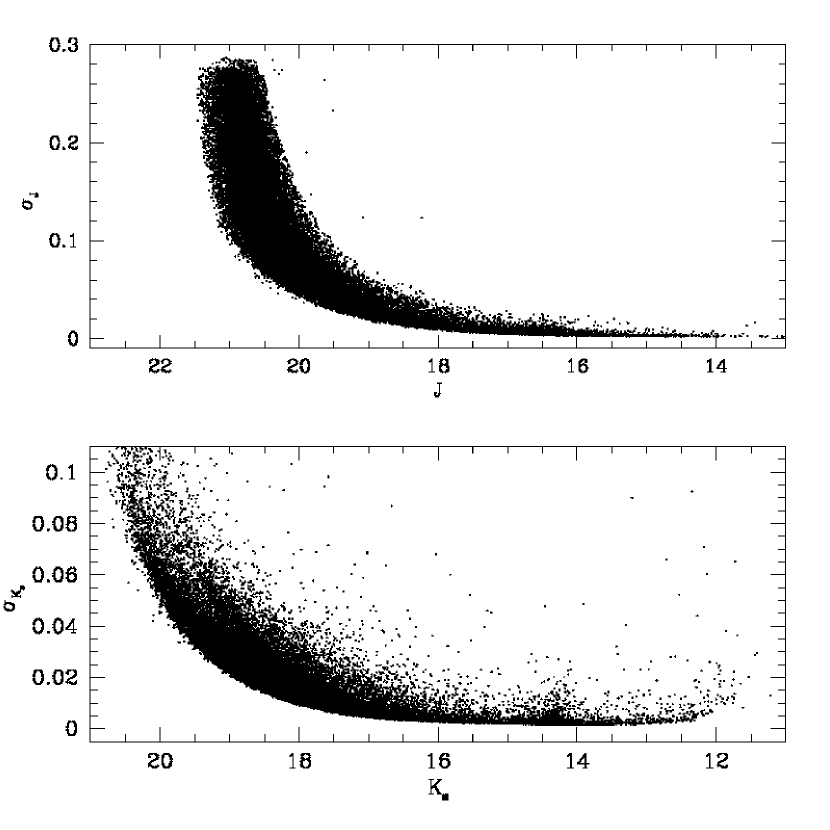
The distribution of the photometric errors as a function of the and magnitudes are shown in Figure 2. Errors vary from 0.01 - 0.02 for bright RGB stars, and they reach values and . As expected, given the overall stability of the PSF, we do not observe any significant radial trend.
The instrumental magnitudes have been converted into the 2MASS photometric system by using the stars in common with the publicly available catalog obtained with SOFI (Valenti et al., 2010). To minimize the effect of blending, photometric errors and saturation, we used only stars at a distance larger than from the cluster center and with 2.8 (SOFI - GeMS ) 3.6 and 2.6 (SOFI J - GeMS J) 3.6, respectively. The and calibration curves are shown in Figure 3. As can be seen, we used an iterative sigma-clipping procedure to estimate the median of the (SOFI - GeMS ) and (SOFI - GeMS ) distributions for the stars satisfying the criteria listed above. The r.m.s of the best-fit relation is 0.1 and 0.08 in and , respectively. The values thus obtained (Figure 3) have been applied to the instrumental GeMS magnitudes. The same stars have been used also to put the instrumental positions onto the absolute astrometric system.
We retrieved VVV images obtained in the direction of Liller 1 from the Vista Science Archive website444 http://horus.roe.ac.uk/vsa/. The data set is composed of one exposure per filter and it covers a total FoV of . Data were prereduced at the Cambridge Astronomical Survey Unit (CASU)555 http://casu.ast.cam.ac.uk/ with the VIRCAM pipeline (Irwin et al., 2004). We then performed PSF-fitting photometry by using the DAOPHOT based VVV-SkZ_pipeline (Mauro et al., 2013) on the single pixels chip extracted from the stacked VVV pawprints (Saito et al., 2012). A quadratically variable Moffat function with has been adopted. The VVV magnitudes and instrumental coordinates were then reported to the 2MASS photometric and astrometric system (see details in Chené et al., 2012; Moni Bidin et al., 2011; Mauro et al., 2013).
We estimated the differential reddening in the direction of Liller 1 by adopting a procedure similar to that discussed in Massari et al. (2012), with the only difference that here we used the RGB instead of the MS stars as reference sequence. In particular, we divided the GSAOI FoV in a grid of cells, each 18″-wide. We considered RGB stars approximately in the magnitude range : the upper and the lower thresholds of the selection box have been set running parallel to the reddening vector. Considering the RGB stars within each cell, we estimated the median color. The cell with the bluest color (nominally corresponding to the lowest extinction value) has been adopted as reference. The relative color shift of each ith cell, is then defined as the shift needed to make the median color of the ith cell match the reference cell color. Then, from the value of we derived the corresponding by adopting the extinction coefficients R and R (Cardelli et al., 1989). Extinction variations as large as mag have been measured in the direction of the cluster.
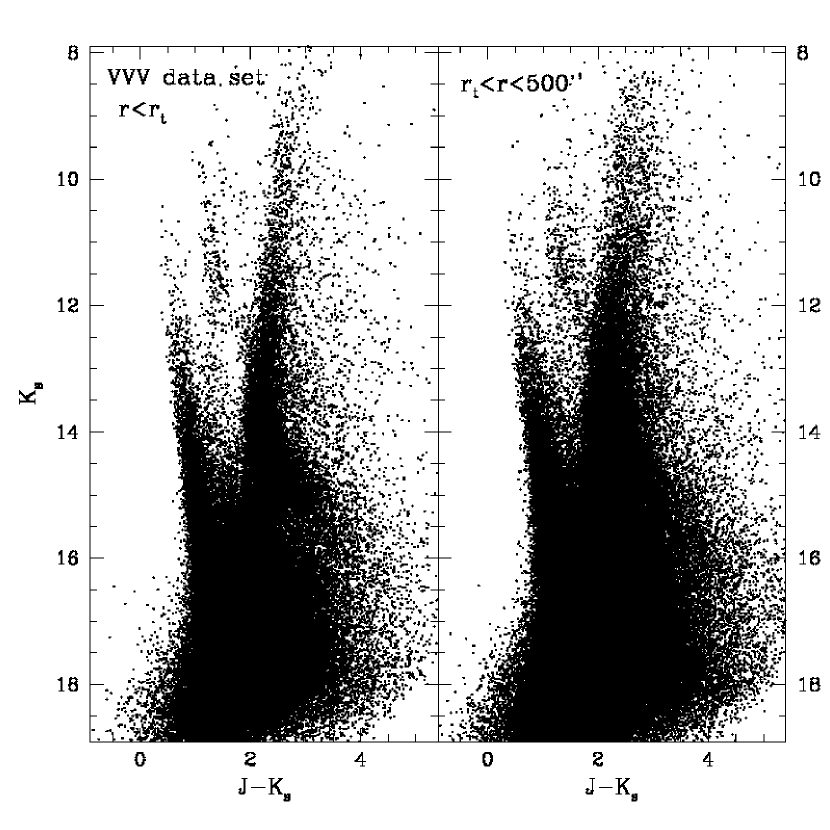
Figure 4 shows the differential reddening corrected () CMD of Liller 1 (catalog ). This is the deepest and most accurate CMD ever obtained for this stellar system, reaching and thus sampling the MS-TO region. Its well defined red clump, clearly visible at , is a typical feature of a metal rich GC. Unfortunately, stars lying along the brightest portion of the RGB () are saturated in all the available images. As apparent from Figure 5, Liller 1 (catalog ) suffers from significant field contamination mainly from the Galactic bulge and disk stars, which define a blue plume clearly visible in the bluest portion of the CMD for . While the features of the CMD will be discussed in detail in a forthcoming paper (hereafter, paper II), here we focus on the derivation of the star density profile of Liller 1 and the estimate of its main structural and physical parameters.
3 Results
3.1 Distance and reddening of Liller 1
The most recent determinations of the distance and reddening of Liller 1 (Valenti et al., 2010) have been obtained on the basis of a relatively shallow -CMD, reaching only the red clump level. Since the GEMINI photometry presented here is significantly deeper, we used our new data to re-determine both these quantities. Following Valenti et al. (2007, see also , ), we used a differential method, consisting in the comparison between the CMD and the luminosity function of Liller 1 with those of a reference cluster, NGC 6553, a bulge GC with similar metallicity (Origlia et al., 2002; Meléndez et al., 2003; Alves-Brito et al., 2006; Valenti et al., 2007). The data set used for NGC 6553 is from Valenti et al. (2007, see also , ). We found that, in order to align the RGB mean ridge line and the magnitude level of the red clump of the two clusters, a color shift and a magnitude shift must be applied to the sequences of NGC 6553 (see Figure 6). Thus, by adopting and for NGC 6553 (Valenti et al., 2010), we obtain and for Liller 1. The relative uncertanties on and are obtained by taking into account the photometric errors at the magnitude level of the red clumps and RGB bumps of Liller 1 and NGC 6553, the errors due to the photometric calibration (Section 2) and the histogram bin size.
It is important to note that the adopted reddening value has been obtained by using the differential reddening-corrected CMD of Liller 1, hence it corresponds to the least extincted region in the GEMINI FoV (see Section 2). By averaging the values of E(B-V) of each cell considered in Section 2 weighted by the number of reference stars sampled, we obtain a mean extinction of in the direction of Liller 1. This yields a true (unreddened) distance modulus of , which corresponds to a distance of kpc, in agreement with previous determinations (Harris 1996; Valenti et al. 2010; Ortolani et al. 2007).
Interestingly, Figure 6 also shows that the relative positions of the red clump and of the RGB bump (Fusi Pecci et al., 1990; Ferraro et al., 1999a) are quite similar in the two clusters. Hence, since the location in magnitude of the RGB bump is quite sensitive to metal abundance, such a nice correspondence further supports the evidence that Liller 1 and NGC 6553 share the same chemistry.
3.2 Center of gravity
Using the absolute positions of individual stars in the GEMINI sample, we determined the center of gravity () of Liller 1 (catalog ), by following the iterative procedure described in Montegriffo et al. (1995, see also ), averaging the right ascension () and declination () values of properly selected stars. As discussed in Ferraro et al. (2003, see also ), the use of individual stars to measure the center of gravity and the star density profile provides the most robust approach to derive cluster structural parameters, since the counting of individual stars is not affected by the presence of a few bright objects (which can, instead, generate spurious luminosity clumping in the measurements based on the observed SB). However star counts can be affected by incompleteness. We estimated the effect of completeness by means of artificial stars experiments. We followed the approach and prescriptions extensively described in Dalessandro et al. (2011, see also ). We obtained that only stars with have a completeness at any distance from the cluster center. We used only these stars to study both the center of gravity and the density profile (Section 3.3).
We estimated the gravity center by considering different sub-samples of stars: we used stars lying within different distances (, and ) from a first guess center, and with three different cuts in magnitudes ( =15.5, 15.0 and 14.5). The final value of is the average of the different estimates. It turns out to be located at , , with an uncertainty of and in and , respectively. Our center is south-east from that reported by H96 and estimated by using the SB distribution.
3.3 Star density profile and structural parameters
By adopting the derived value of and the data sets described in Section 2, we constructed the projected density profile of the cluster over its entire radial extension (out to ). Following the procedure described in Ferraro et al. (1999b, see also ), we divided the GEMINI and the VVV samples in several concentric annuli centered on , each one split into a variable number of sub-sectors. The number of stars lying within each sub-sector was counted, and the star density was obtained by dividing these values by the corresponding sub-sector areas. The stellar density in each annulus was then computed as the average of the sub-sector densities and the standard deviation was adopted as the uncertainty. In order to avoid incompleteness and saturation biases, different limiting magnitudes have been adopted for the two data sets: for the GEMINI sample and for the VVV data set. By guaranteeing an adequate radial overlap () among the two samples, the annuli in common between the adjacent data sets have been used to join the two portions of the profile. At the end of the procedure, the inner portion () is sampled by the high-resolution GEMINI data, while the outermost portion is obtained from the VVV data set.
The projected density profile thus obtained is shown in Figure 7 (empty circles). The distance from the center associated with each point corresponds to the mid-value of each adopted radial bin. The projected density at is approximately constant, consistent with being due to the Galactic field population alone. To estimate the background and foreground Galaxy contamination we therefore used the -clipped average of the five outermost points (dotted line in Figure 7). The field-decontaminated star density profile of Liller 1 is marked by the solid circles in the figure. The observed density distributions of GCs are traditionally described by means of King models (King, 1966), even if deviations from this kind of profile have been found in some cases (see, e.g., McLaughlin & van der Marel, 2005; Moni Bidin et al., 2011; Miocchi et al., 2013, and references therein). To reproduce the observed star density profile of Liller 1 (catalog ) and derive its structural parameters we used an isotropic, single-mass King model (King, 1966), and we followed the procedure fully described in Miocchi et al. (2013). According to a test, the density profile of Liller 1 (catalog ) can be excellently reproduced by a King model with core radius , concentration parameter , half-mass radius and tidal (or limiting) radius .
The structural parameters we obtained are significantly different from those quoted by H96 based on the SB profiles in and bands (, and thus ). In particular, the newly derived parameters show that Liller 1 is significantly less concentrated and less extended than previously thought. A reasonably good agreement is found with the values estimated from the analysis of images by Cohen et al. (2007, )666It is worth noticing, however, that the approach used in Cohen et al. (2007) to fit the SB profile is quite different from ours, since the authors derived the central SB and the core radius of the cluster after adopting and from the online database of H96. Hence, the results obtained are not directly comparable. and by Malkan et al. (1980, ). A plausible explanation for the disagreement between the structural parameters derived from optical and near-IR observations could be a differential reddening effect, that may produce a spurious distortion of the optical SB profile, as well as low in the optical due to the heavy extinction.
We derived also the SB profiles of Liller 1 directly from the images. To this aim, we used the wide-field images of the 2MASS data-set, since the VVV images heavily suffer from saturation. We produced and SB profiles by following the procedure described in Dalessandro et al. (2012, see also ) and by adopting the same center, and a setup of annuli and sub-sectors similar to the one used to obtain the density profile. Basically, for each annulus we summed the photon counts sampled in each sub-sector and we assumed as final SB the average value of the different sub-sectors. In order to reduce statistical fluctuations due to the presence of a few bright giants randomly distributed in the FoV of the and 2MASS images, a threshold of 8000 photon counts was adopted for each pixel. The counts have been converted into instrumental magnitudes and then calibrated by using appropriate zero-points. The contribution of the Galactic background was finally estimated for , obtaining mag/arcsec2 and mag/arcsec2. The SB profiles thus obtained are shown in Figure 8. These profiles are well fit by the same King model derived from the projected density distribution, thus confirming the accuracy of the structural parameters derived in the present work. The values of the central SB measured in the and bands, and , are listed in Table 1, together with all the relevant parameters derived for the cluster.
3.4 Cluster physical parameters
Given the value of the effective radius estimated from the best-fit King model discussed in the previous Section (), we derived the integrated luminosity of the cluster within . By using aperture photometry on the 2MASS images and after subtracting the background contribution determined as described in Section 3.3, we obtained . Hence, by definition of (i.e., the projected radius including half the total integrated light), the total integrated magnitude of the cluster is . This value is significantly brighter than previous estimates. In fact Cohen et al. (2007) found , while our estimate over the same cluster region is 0.6 mag brighter, . We emphasize, however, that our estimate is a direct measure of the integrated magnitude over the 2MASS image, while that of Cohen et al. (2007) depends on the assumed cluster parameters (which are different from those derived here, as discussed in Section 3.3).
By adopting a color excess , a distance modulus (see Section 3.1), and a bolometric correction appropriate for a population of intrinsic color (Montegriffo et al., 1993), we estimated a bolometric luminosity of about , corresponding to a total luminosity . From this value, the total mass of Liller 1 can be estimated by assuming a mass-to-light ratio (Maraston & Thomas, 2000; Maraston, 2003) appropriate for a Salpeter Initial Mass Function (IMF), thus obtaining . We also estimated the mass of Liller 1 assuming as obtained by Maraston (2003) for a Kroupa IMF. We obtain in this case .
Note that such a large value of the mass is similar to that extimated for Cen (Merritt et al., 1997) and Terzan 5 (Ferraro et al., 2009a; Lanzoni et al., 2010), and rankes Liller 1 in the high-mass tail of the distribution observed for GC-like stellar systems in the Milky Way.
Same values of the total mass are obtained from the total integrated -band magnitude (see above) and adopting mass-to-light ratios and (Maraston & Thomas, 2000; Maraston, 2003) for a Salpeter and a Kroupa IMF, respectively.
We also used the available data to get a new estimate of the central mass density of the cluster. To do so, we followed the same procedure described for -band data in Djorgovski (1993). However, in order to minimize the effects due to the strong and differential reddening affecting the system, we re-derived eq. (5) of Djorgovski (1993) in the appropriate form for -band photometry. By adopting 3.28 as the -band magnitude of the Sun, we obtain:
| (1) |
where is the central projected luminosity density in units of pc-2. From eq. (4) of Djorgovski (1993) and the structural parameters quoted in Section 3.3, we then derived the central luminosity density of the system in the -band. By assuming appropriate for a Salpeter IMF, we finally converted it into the central mass density, pc-3. Using instead a Kroupa IMF which gives , we obtain pc-3. These values are between 5 and 7 times larger than those obtained from the -band central luminosity density quoted in H96, by assuming (from Maraston & Thomas, 2000; Maraston, 2003).
4 Summary and conclusions
By using GeMS+GSAOI at the Gemini South Telescope, we have obtained the deepest CMD of the Galactic GC Liller 1 published so far, properly sampling even the innermost regions of the system (except for some saturated stars). This allowed us to obtain new estimates of the cluster distance and reddening, which essentially confirm previous determinations. Significant differences with respect to the literature values, instead, have been found for the cluster center and structural parameters: with respect to the values quoted in the H96 catalog, Liller 1 turns out to be located south-east, to be significantly less concentrated (, instead of ), to have a larger core radius (, instead of ), and thus to be less extended overall (, instead of ). Also its total mass and central mass density pc-3 ( and pc-3 for a Kroupa IMF) appear to be a factor of a few larger that those derivable from the -band parameters listed in the H96 catalog.
From these new estimates, we also re-determined the collisional parameter of the system, which can be expressed as for virialized and King model systems. We find that is 20 - 40 times larger than the one obtained by using the H96 parameters. It corresponds to about half the collisional parameter of Terzan 5 estimated in Lanzoni et al. (2010), and is much larger than the values derived for other massive GCs for which the structural parameters have been re-determined consistently with what is done here (NGC 6388, NGC 6266, 47 Tucanae; see Dalessandro et al., 2008a; Beccari et al., 2006; Mapelli et al., 2006, respectively).
Hence, our analysis confirms the previous suggestion (Verbunt & Hut, 1987) that the collisional parameter of Liller 1 is the second highest (after that of Terzan 5) among all Galactic GCs. In stellar systems with high values of , large populations of “collisional” objects (like LMXBs, MSPs, BSS and CVs), whose formation is promoted by single/binary encounters, should not be unusual (also depending on the availability of the progenitors). In this respect, it is interesting to note that, while Terzan 5 hosts the largest population of MSPs ever observed in a GC (Ransom et al., 2005), no MSPs have been detected so far in Liller 1, the only exotic object being in fact a LMXB (Homer et al., 2001, see also the Introduction). The lack of detection of large populations of MSPs, LMXBs and CVs might be due to observational biases. In fact Liller 1 is located in a region of the Galactic plane where diffuse emission is very strong. In this respect, deeper MSP searches, perhaps with the Square Kilometer Array, could help understanding the real MSP content of the system. On the other hand, the strong -ray emission (the most intense among all Galactic GCs) detected in the direction of the cluster (Tam et al., 2011) may suggest the possible presence of numerous, but still hidden, MSPs. Another possibility, emerging from the results presented in this work, is that the -ray emission is not associated with Liller 1. In fact Tam et al. (2011) localized the position of the intense -ray source at from the cluster center. While this distance is smaller than the tidal radius quoted in H96 (), it is larger than the cluster tidal radius obtained in this work (). Even by taking into account the -ray position error ( for the Fermi-LAT observations), the location of the -ray source is only marginally compatible with the newly determined radial extension of Liller 1, thus opening the possibility that such a strong emission is not coming from this stellar system.
| Parameter | Derived Value |
|---|---|
| Center of gravity | |
| Reddening | |
| Distance Modulus | = 14.55 0.15 |
| Distance | d = 8.1 1.0 Kpc |
| Core radius | pc |
| Effective radius | pc |
| Half-mass radius | pc |
| Tidal radius | pc |
| Concentration | |
| Total luminosity | |
| Total mass | (Salpeter IMF) |
| (Kroupa IMF) | |
| Central mass density | (Salpeter IMF) |
| (Kroupa IMF) | |
| Central -band SB | mag arcsec-2 |
| Central -band SB | mag arcsec-2 |


References
- Alves-Brito et al. (2006) Alves-Brito, A., Barbuy, B., Zoccali, M., et al. 2006, A&A, 460, 269
- Bailyn (1992) Bailyn, C. D. 1992, ApJ, 392, 519
- Beccari et al. (2006) Beccari, G., Ferraro, F. R., Possenti, A., et al. 2006, AJ, 131, 2551
- Bellazzini et al. (1995) Bellazzini, M., Pasquali, A., Federici, L., Ferraro, F. R., & Pecci, F. F. 1995, ApJ, 439, 687
- Bellazzini et al. (2012) Bellazzini, M., Dalessandro, E., Sollima, A., & Ibata, R. 2012, MNRAS, 423, 844
- Cardelli et al. (1989) Cardelli, J. A., Clayton, G. C., & Mathis, J. S. 1989, ApJ, 345, 245
- Catelan et al. (2011) Catelan, M., Minniti, D., Lucas, P. W., et al. 2011, RR Lyrae Stars, Metal-Poor Stars, and the Galaxy, 145
- Chené et al. (2012) Chené, A.-N., Borissova, J., Clarke, J. R. A., et al. 2012, A&A, 545, AA54
- Cohen et al. (2007) Cohen, J. G., Hsieh, S., Metchev, S., Djorgovski, S. G., & Malkan, M. 2007, AJ, 133, 99
- Cutri et al. (2003) Cutri, R. M., Skrutskie, M. F., van Dyk, S., et al. 2003, ”The IRSA 2MASS All-Sky Point Source Catalog, NASA/IPAC Infrared Science Archive.
- Davidge (2000) Davidge, T. J. 2000, ApJS, 126, 105
- Dalessandro et al. (2008a) Dalessandro, E., Lanzoni, B., Ferraro, F. R., et al. 2008a, ApJ, 677, 1069
- Dalessandro et al. (2008b) Dalessandro, E., Lanzoni, B., Ferraro, F. R., et al. 2008b, ApJ, 681, 311
- Dalessandro et al. (2011) Dalessandro, E., Lanzoni, B., Beccari, G., et al. 2011, ApJ, 743, 11
- Dalessandro et al. (2012) Dalessandro, E., Schiavon, R. P., Rood, R. T., et al. 2012, AJ, 144, 126
- Dalessandro et al. (2014) Dalessandro, E., Pallanca, C., Ferraro, F. R., et al. 2014, ApJ, 784, LL29
- Djorgovski (1993) Djorgovski, S. 1993, Structure and Dynamics of Globular Clusters, 50, 373
- Ferraro et al. (1991) Ferraro, F. R., Clementini, G., Fusi Pecci, F., & Buonanno, R. 1991, MNRAS, 252, 357
- Ferraro et al. (1992) Ferraro, F. R., Clementini, G., Fusi Pecci, F., Sortino, R., & Buonanno, R. 1992, MNRAS, 256, 391
- Ferraro et al. (1999a) Ferraro, F. R., Messineo, M., Fusi Pecci, F., et al. 1999a, AJ, 118, 1738
- Ferraro et al. (1999b) Ferraro, F. R., Paltrinieri, B., Rood, R. T., & Dorman, B. 1999b, ApJ, 522, 983
- Ferraro et al. (2000) Ferraro, F. R., Montegriffo, P., Origlia, L., & Fusi Pecci, F. 2000, AJ, 119, 1282
- Ferraro et al. (2001) Ferraro, F. R., D’Amico, N., Possenti, A., Mignani, R. P., & Paltrinieri, B. 2001, ApJ, 561, 337
- Ferraro et al. (2003) Ferraro, F. R., Possenti, A., Sabbi, E., et al. 2003, ApJ, 595, 179
- Ferraro et al. (2009a) Ferraro, F. R., Dalessandro, E., Mucciarelli, A., et al. 2009a, Nature, 462, 483
- Ferraro et al. (2009b) Ferraro, F. R., Beccari, G., Dalessandro, E., et al. 2009b, Nature, 462, 1028
- Ferraro et al. (2012) Ferraro, F. R., Lanzoni, B., Dalessandro, E., et al. 2012, Nature, 492, 393
- Frogel et al. (1995) Frogel, J. A., Kuchinski, L. E., & Tiede, G. P. 1995, AJ, 109, 1154
- Fusi Pecci et al. (1990) Fusi Pecci, F., Ferraro, F. R., Crocker, D. A., Rood, R. T., & Buonanno, R. 1990, A&A, 238, 95
- Harris (1996) Harris, W. E. 1996, AJ, 112, 1487
- Hoffman et al. (1978) Hoffman, J. A., Marshall, H. L., & Lewin, W. H. G. 1978, Nature, 271, 630
- Homer et al. (2001) Homer, L., Deutsch, E. W., Anderson, S. F., & Margon, B. 2001, AJ, 122, 2627
- Hui et al. (2010) Hui, C. Y., Cheng, K. S., & Taam, R. E. 2010, ApJ, 714, 1149
- Irwin et al. (2004) Irwin, M. J., Lewis, J., Hodgkin, S., et al. 2004, Proc. SPIE, 5493, 411
- King (1966) King, I. R. 1966, AJ, 71, 64
- Lanzoni et al. (2007) Lanzoni, B., Dalessandro, E., Ferraro, F. R., et al. 2007, ApJ, 668, L139
- Lanzoni et al. (2010) Lanzoni, B., Ferraro, F. R., Dalessandro, E., et al. 2010, ApJ, 717, 653
- Lugger et al. (1995) Lugger, P. M., Cohn, H. N., & Grindlay, J. E. 1995, ApJ, 439, 191
- Malkan et al. (1980) Malkan, M., Kleinmann, D. E., & Apt, J. 1980, ApJ, 237, 432
- Mallen-Ornelas & Djorgovski (1993) Mallen-Ornelas, G., & Djorgovski, S. 1993, Structure and Dynamics of Globular Clusters, 50, 313
- Mapelli et al. (2006) Mapelli, M., Sigurdsson, S., Ferraro, F. R., et al. 2006, MNRAS, 373, 361
- Maraston & Thomas (2000) Maraston, C., & Thomas, D. 2000, ApJ, 541, 126
- Maraston (2003) Maraston, C. 2003, Extragalactic Globular Cluster Systems, 237
- Massari et al. (2012) Massari, D., Mucciarelli, A., Dalessandro, E., et al. 2012, ApJ, 755, LL32
- Massari et al. (2014) Massari, D., Mucciarelli, A., Ferraro, F. R., et al. 2014, ApJ, 795, 22
- Mauro et al. (2013) Mauro, F., Moni Bidin, C., Chené, A.-N., et al. 2013, Rev. Mexicana Astron. Astrofis., 49, 189
- McLaughlin & van der Marel (2005) McLaughlin, D. E., & van der Marel, R. P. 2005, ApJS, 161, 304
- Meléndez et al. (2003) Meléndez, J., Barbuy, B., Bica, E., et al. 2003, A&A, 411, 417
- Merritt et al. (1997) Merritt, D., Meylan, G., & Mayor, M. 1997, AJ, 114, 1074
- Minniti et al. (2010) Minniti, D., Lucas, P. W., Emerson, J. P., et al. 2010, New A, 15, 433
- Miocchi et al. (2013) Miocchi, P., Lanzoni, B., Ferraro, F. R., et al. 2013, ApJ, 774, 151
- Moffat (1969) Moffat, A. F. J. 1969, A&A, 3, 455
- Moni Bidin et al. (2011) Moni Bidin, C., Mauro, F., Geisler, D., et al. 2011, A&A, 535, AA33
- Montegriffo et al. (1993) Montegriffo, P. et al., 1993, MNRAS, 297, 872
- Montegriffo et al. (1995) Montegriffo, P., Ferraro, F. R., Fusi Pecci, F., & Origlia, L. 1995, MNRAS, 276, 739
- Montegriffo et al. (1998) Montegriffo, P., Ferraro, F. R., Origlia, L., & Fusi Pecci, F. 1998, MNRAS, 297, 872
- Neichel et al. (2014) Neichel, B., Rigaut, F., Vidal, F., et al. 2014, MNRAS, 440, 1002
- Origlia et al. (1997) Origlia, L., Ferraro, F. R., Fusi Pecci, F., & Oliva, E. 1997, A&A, 321, 859
- Origlia et al. (2002) Origlia, L., Rich, R. M., & Castro, S. 2002, AJ, 123, 1559
- Ortolani et al. (1996) Ortolani, S., Bica, E., & Barbuy, B. 1996, A&A, 306, 134
- Origlia et al. (2011) Origlia, L., Rich, R. M., Ferraro, F. R., et al. 2011, ApJ, 726, LL20
- Origlia et al. (2013) Origlia, L., Massari, D., Rich, R. M., et al. 2013, ApJ, 779, LL5
- Ortolani et al. (2001) Ortolani, S., Barbuy, B., Bica, E., et al. 2001, A&A, 376, 878
- Ortolani et al. (2007) Ortolani, S., Barbuy, B., Bica, E., Zoccali, M., & Renzini, A. 2007, A&A, 470, 1043
- Paresce et al. (1992) Paresce, F., de Marchi, G., & Ferraro, F. R. 1992, Nature, 360, 46
- Penny (1976) Penny, A. J. 1976, Sussex: University, 1976,
- Pooley & Hut (2006) Pooley, D., & Hut, P. 2006, ApJ, 646, L143
- Ransom et al. (2005) Ransom, S. M., Hessels, J. W. T., Stairs, I. H., et al. 2005, Science, 307, 892
- Saito et al. (2012) Saito, R., et al. 2012, A&A, 537, A107
- Stephens & Frogel (2004) Stephens, A. W., & Frogel, J. A. 2004, AJ, 127, 925
- Stetson (1987) Stetson, P. B. 1987, PASP, 99, 191
- Stetson (1994) Stetson, P. B. 1994, PASP, 106, 250
- Tam et al. (2011) Tam, P. H. T., Kong, A. K. H., Hui, C. Y., et al. 2011, ApJ, 729, 90
- Valenti et al. (2004a) Valenti, E., Ferraro, F. R., & Origlia, L. 2004a, MNRAS, 351, 1204
- Valenti et al. (2004b) Valenti, E., Ferraro, F. R., & Origlia, L. 2004b, MNRAS, 354, 815
- Valenti et al. (2007) Valenti, E., Ferraro, F. R., & Origlia, L. 2007, AJ, 133, 1287
- Valenti et al. (2010) Valenti, E., Ferraro, F. R., & Origlia, L. 2010, MNRAS, 402, 1729
- Verbunt & Hut (1987) Verbunt, F., & Hut, P. 1987, The Origin and Evolution of Neutron Stars, 125, 187